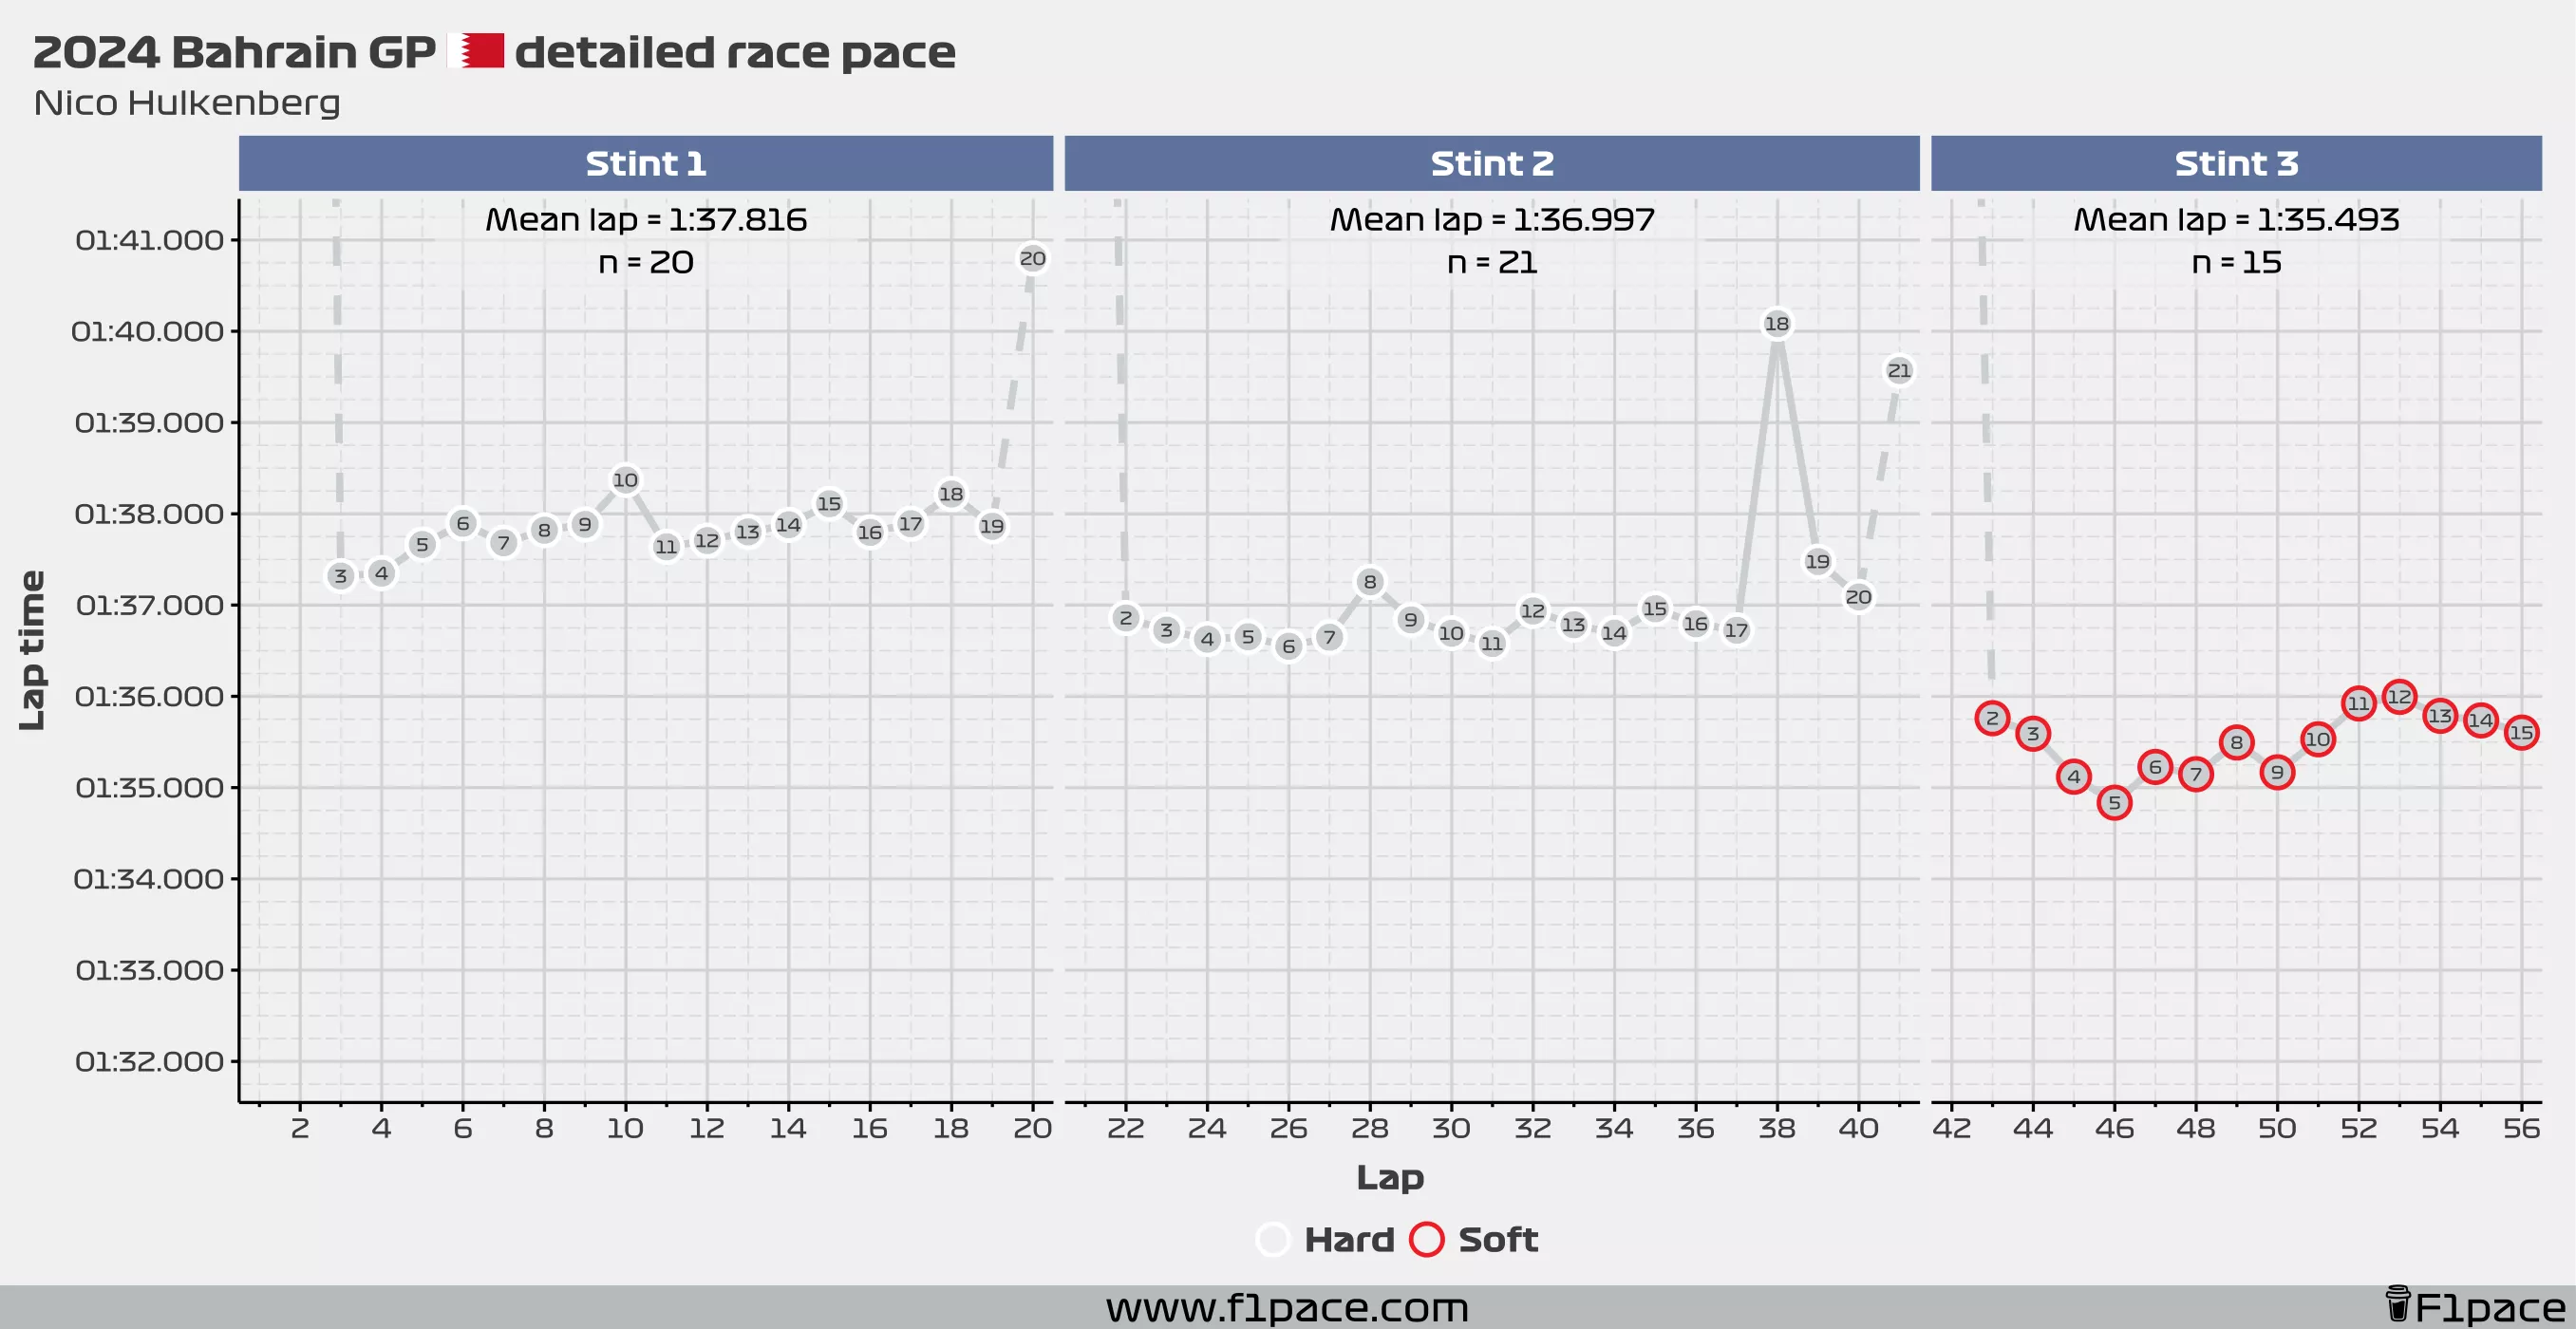
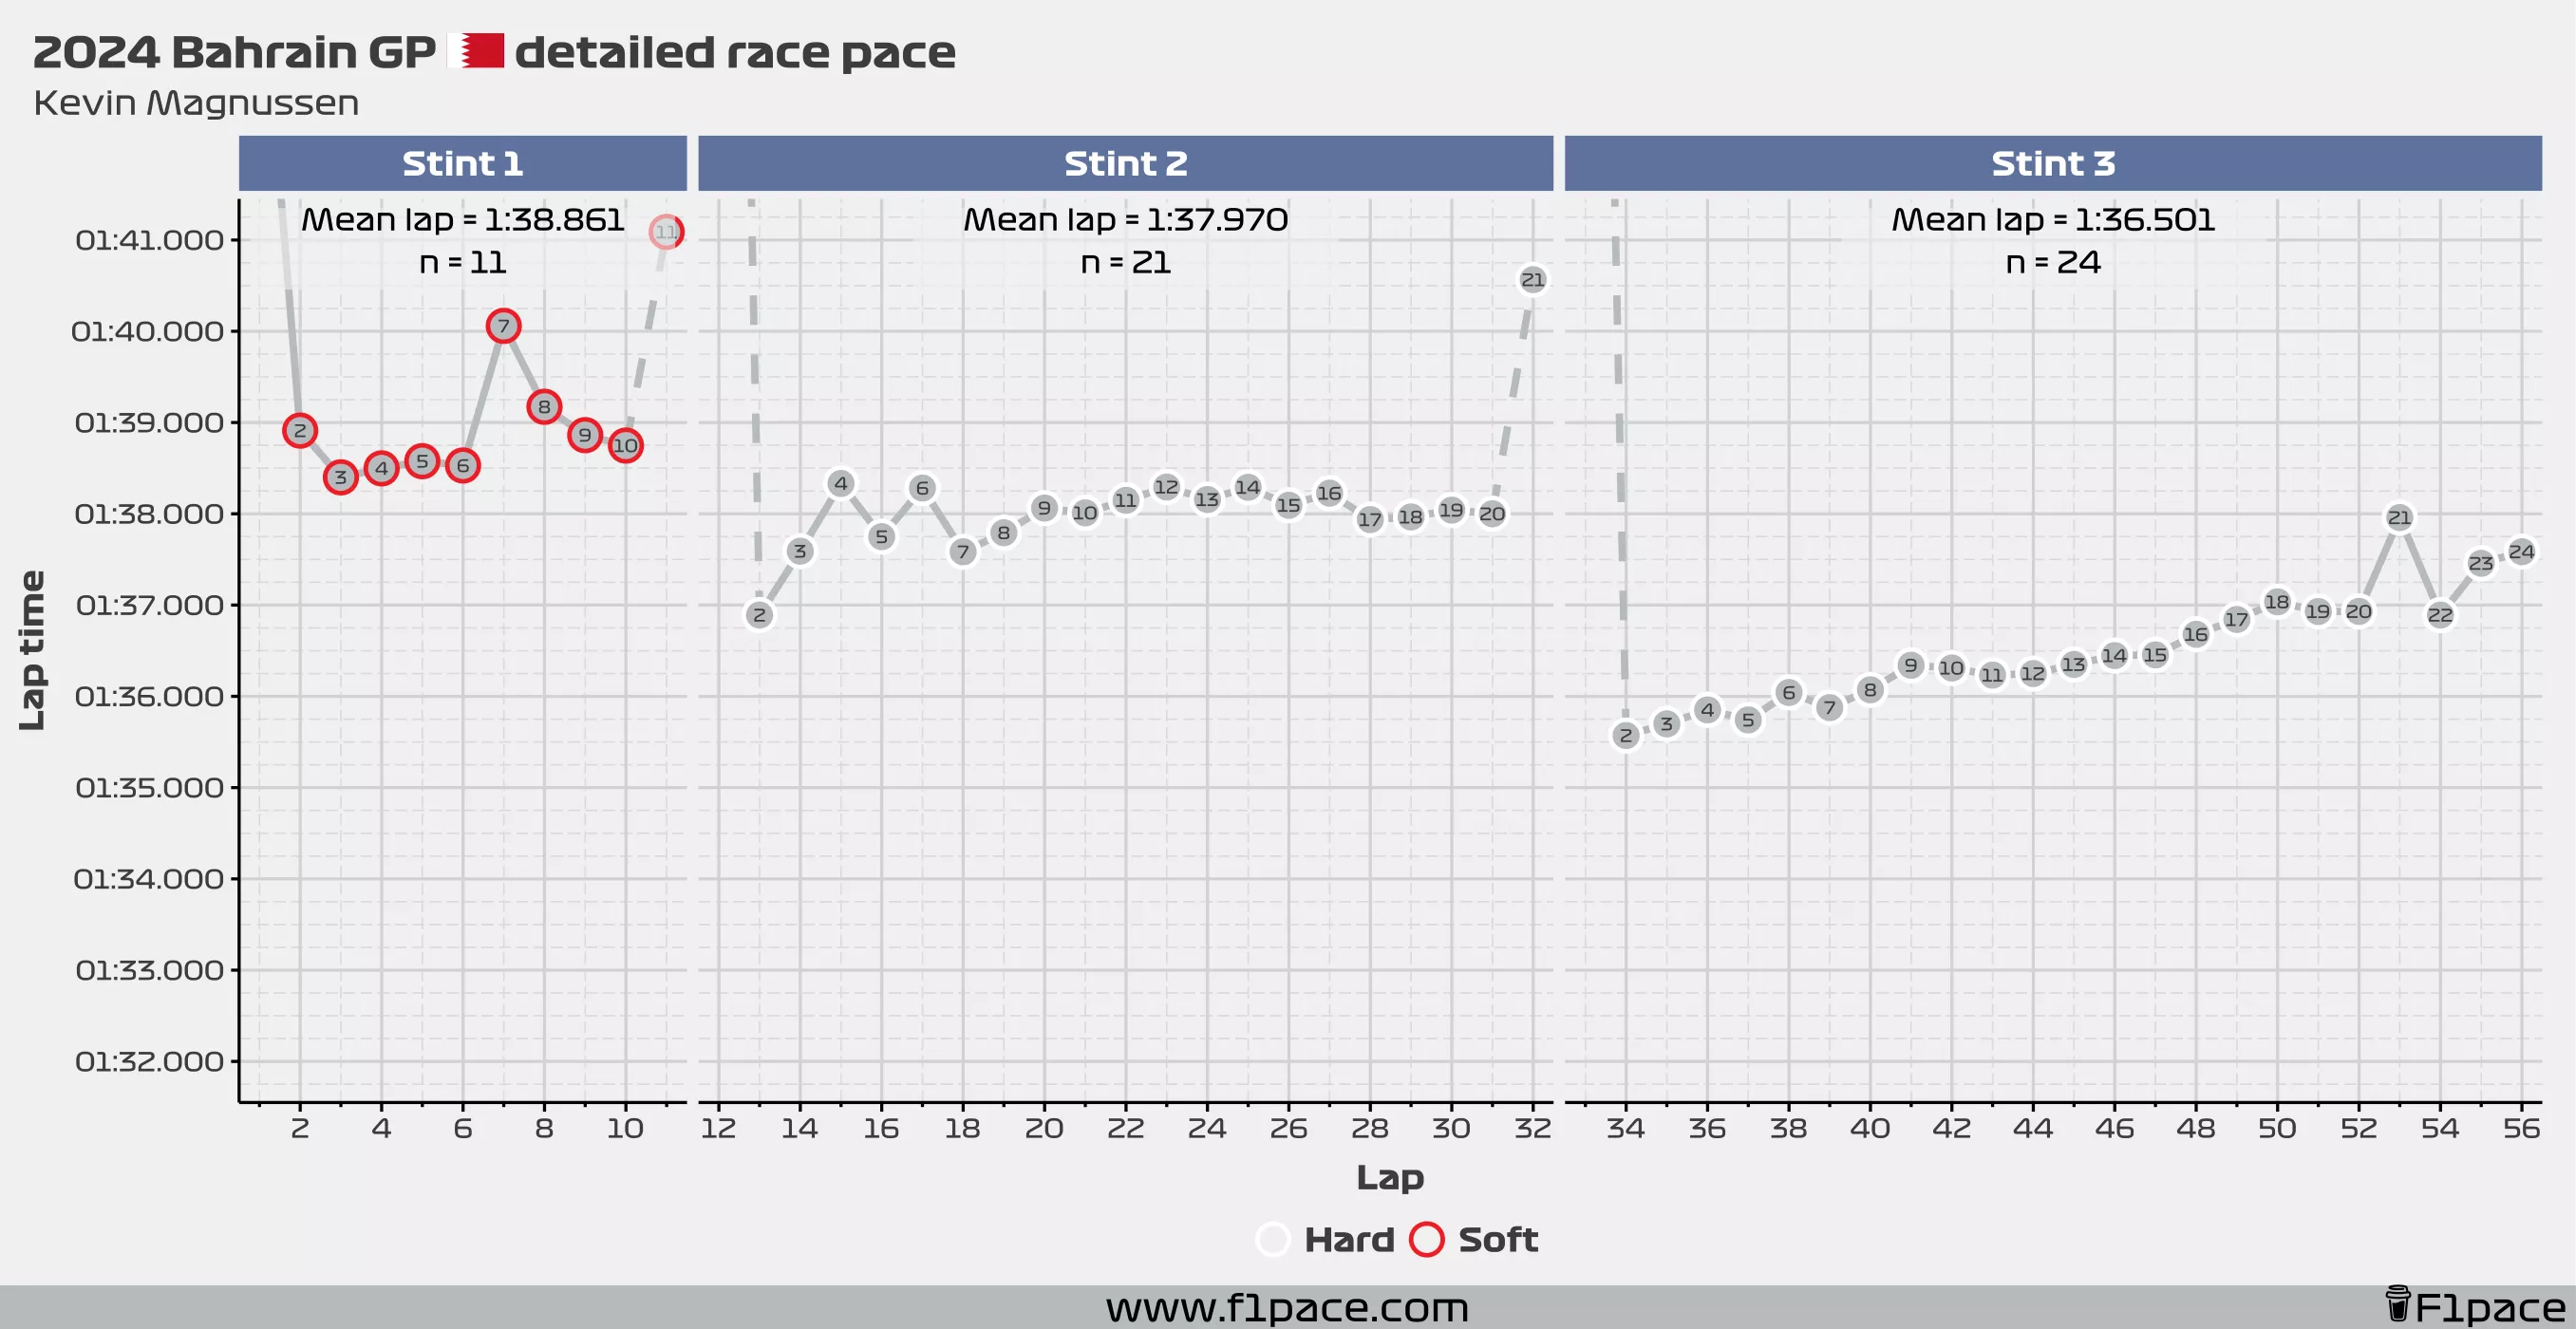
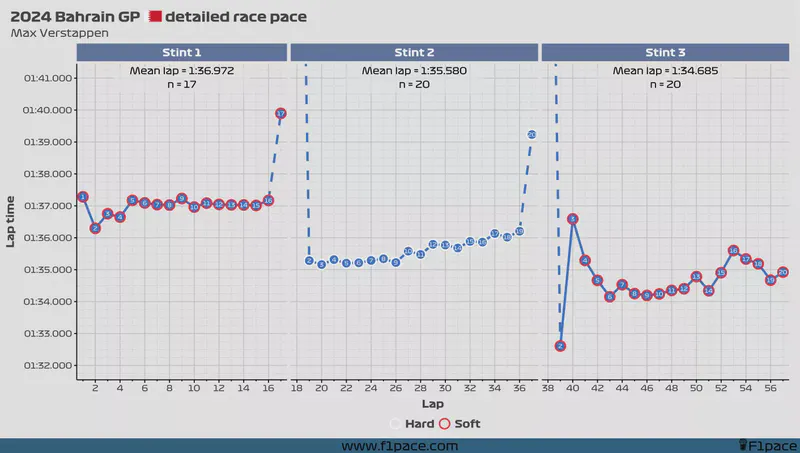
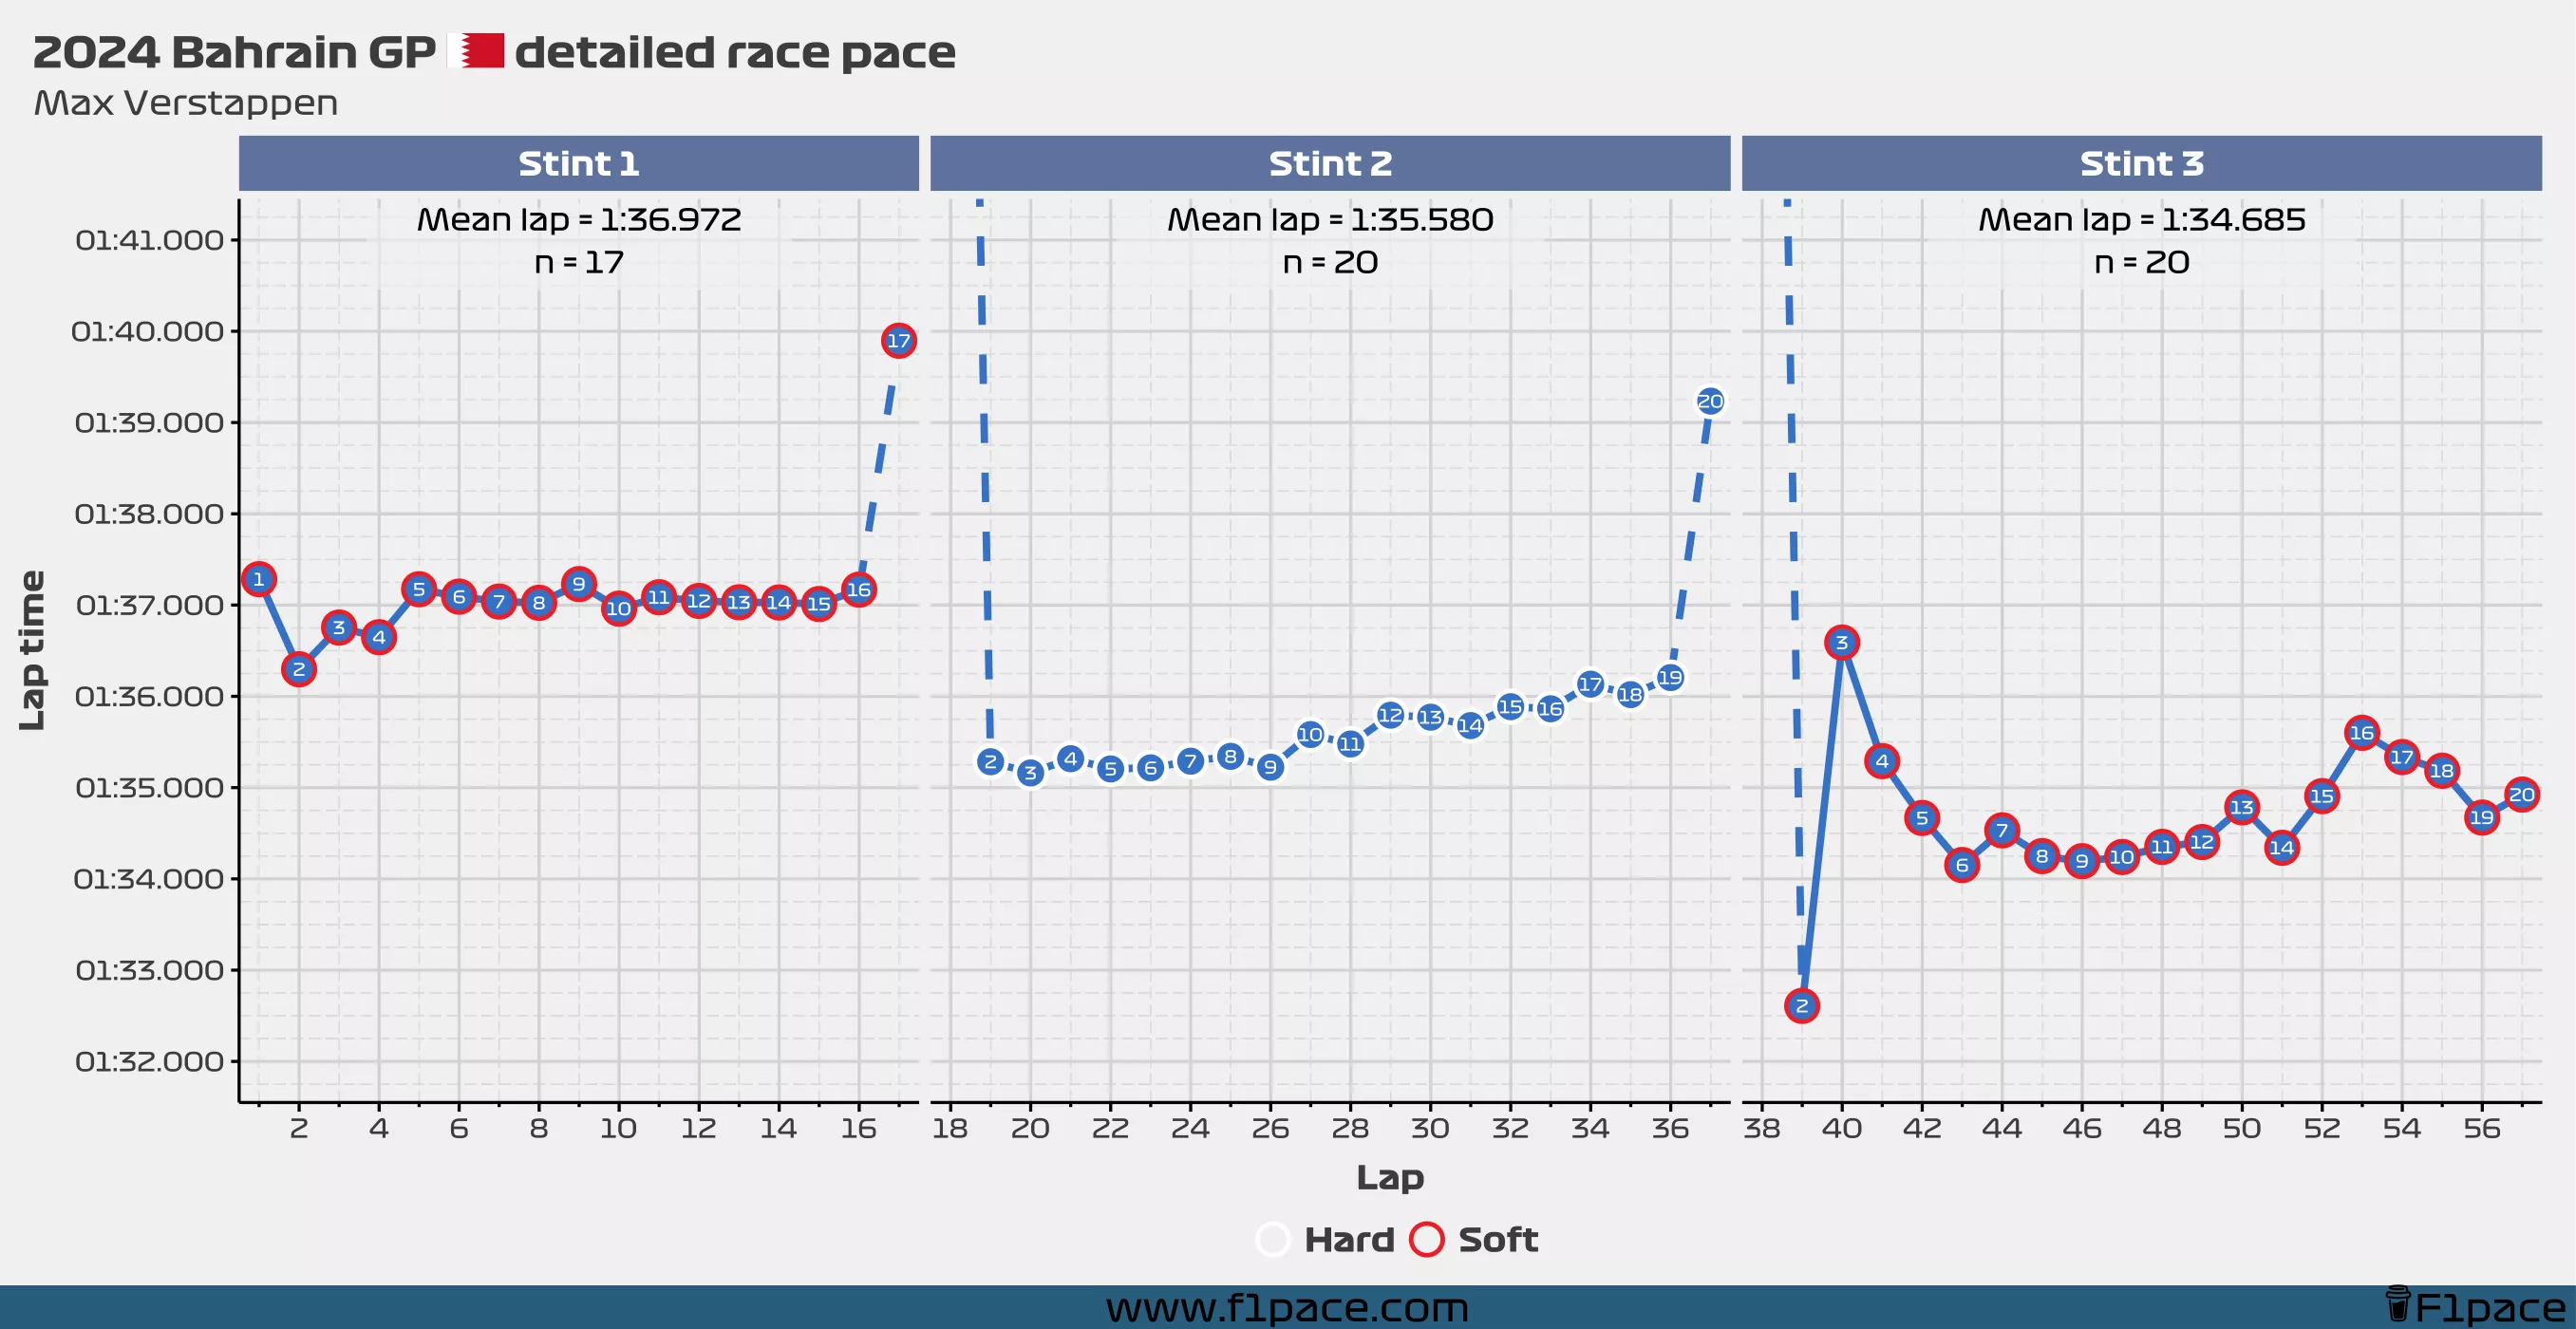
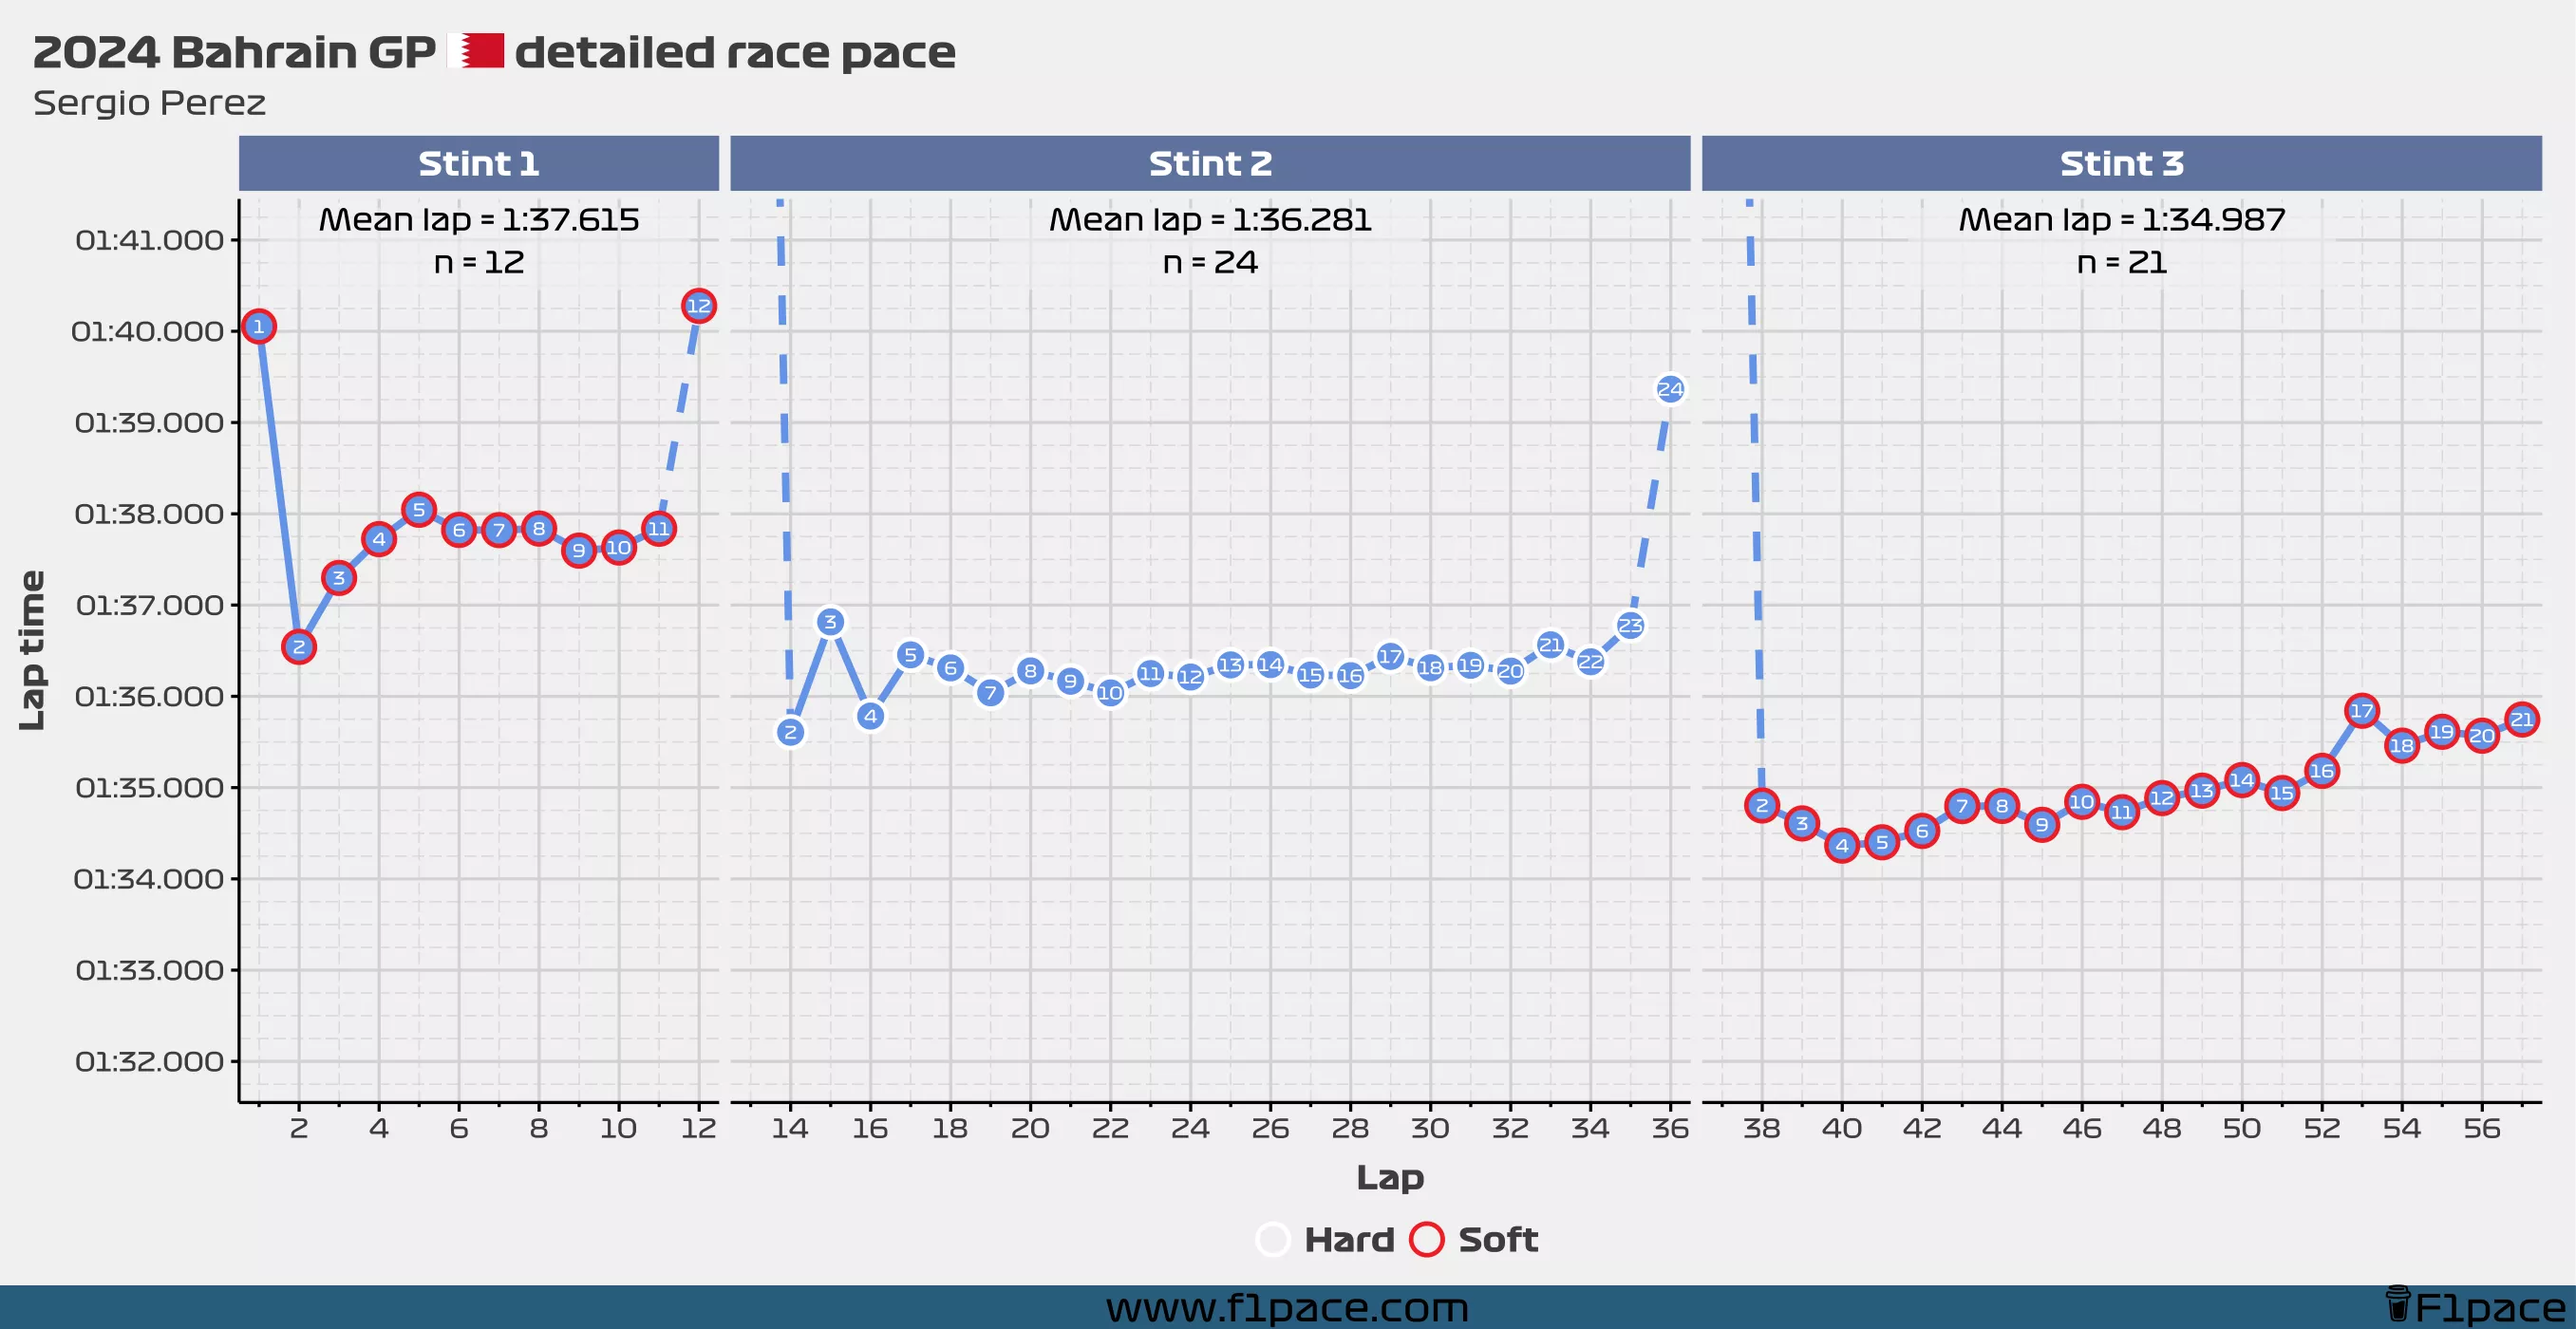
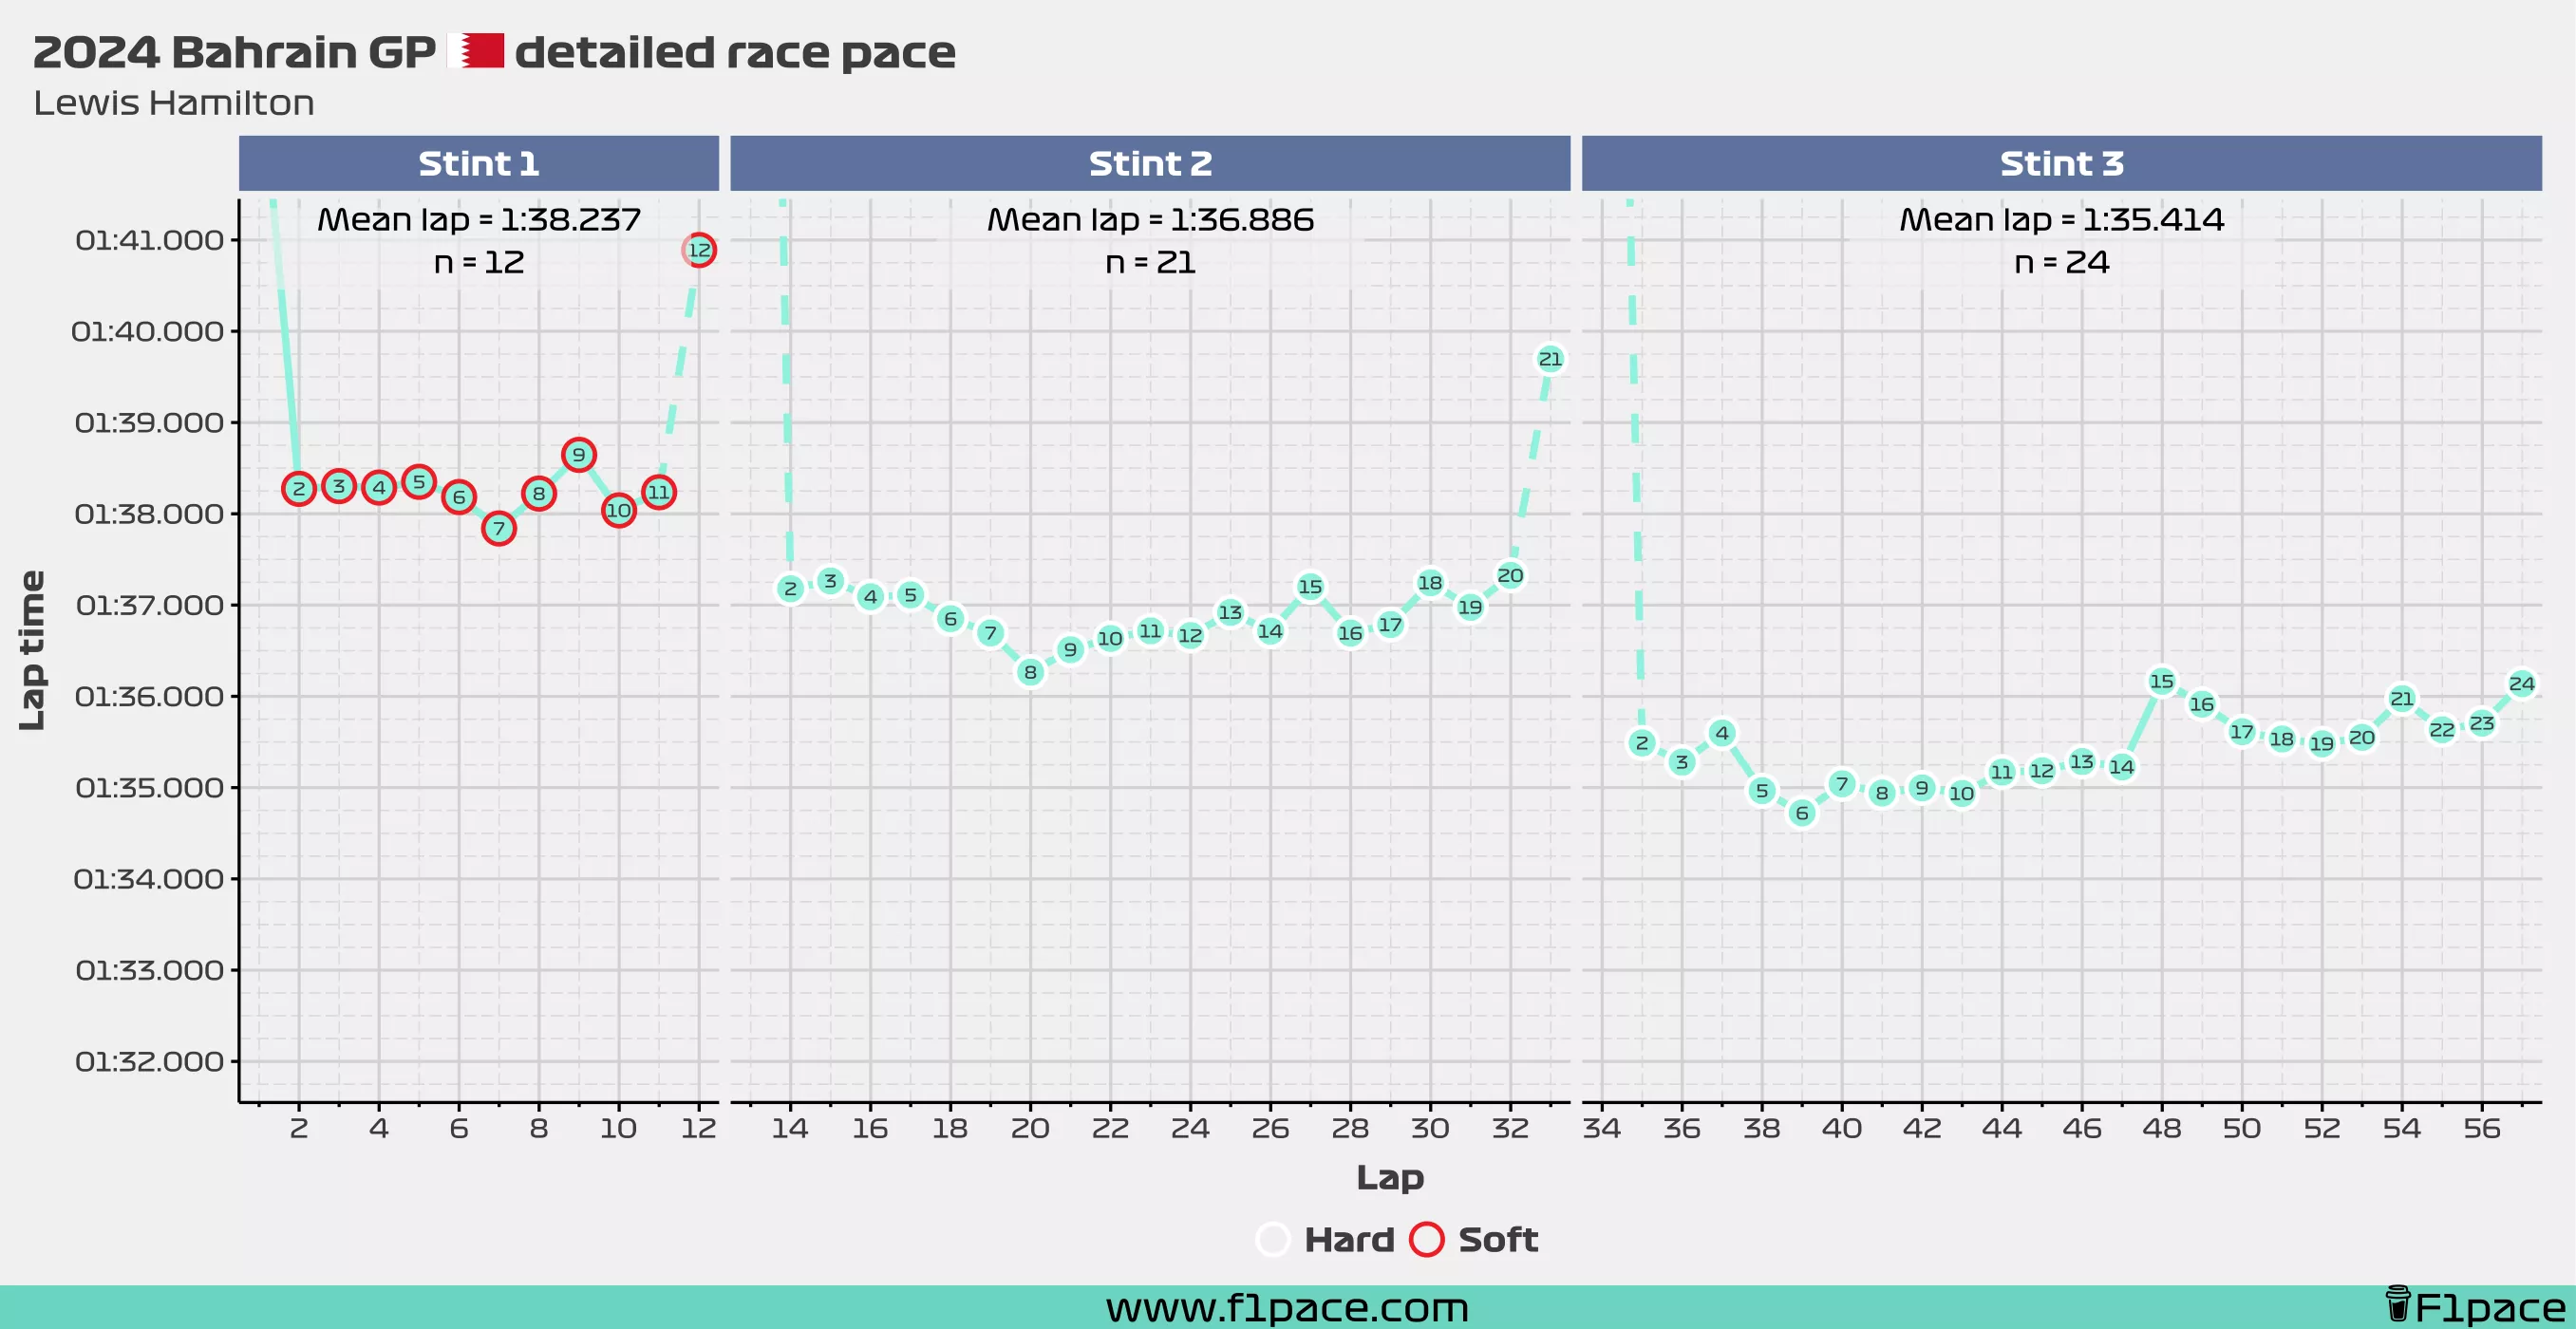
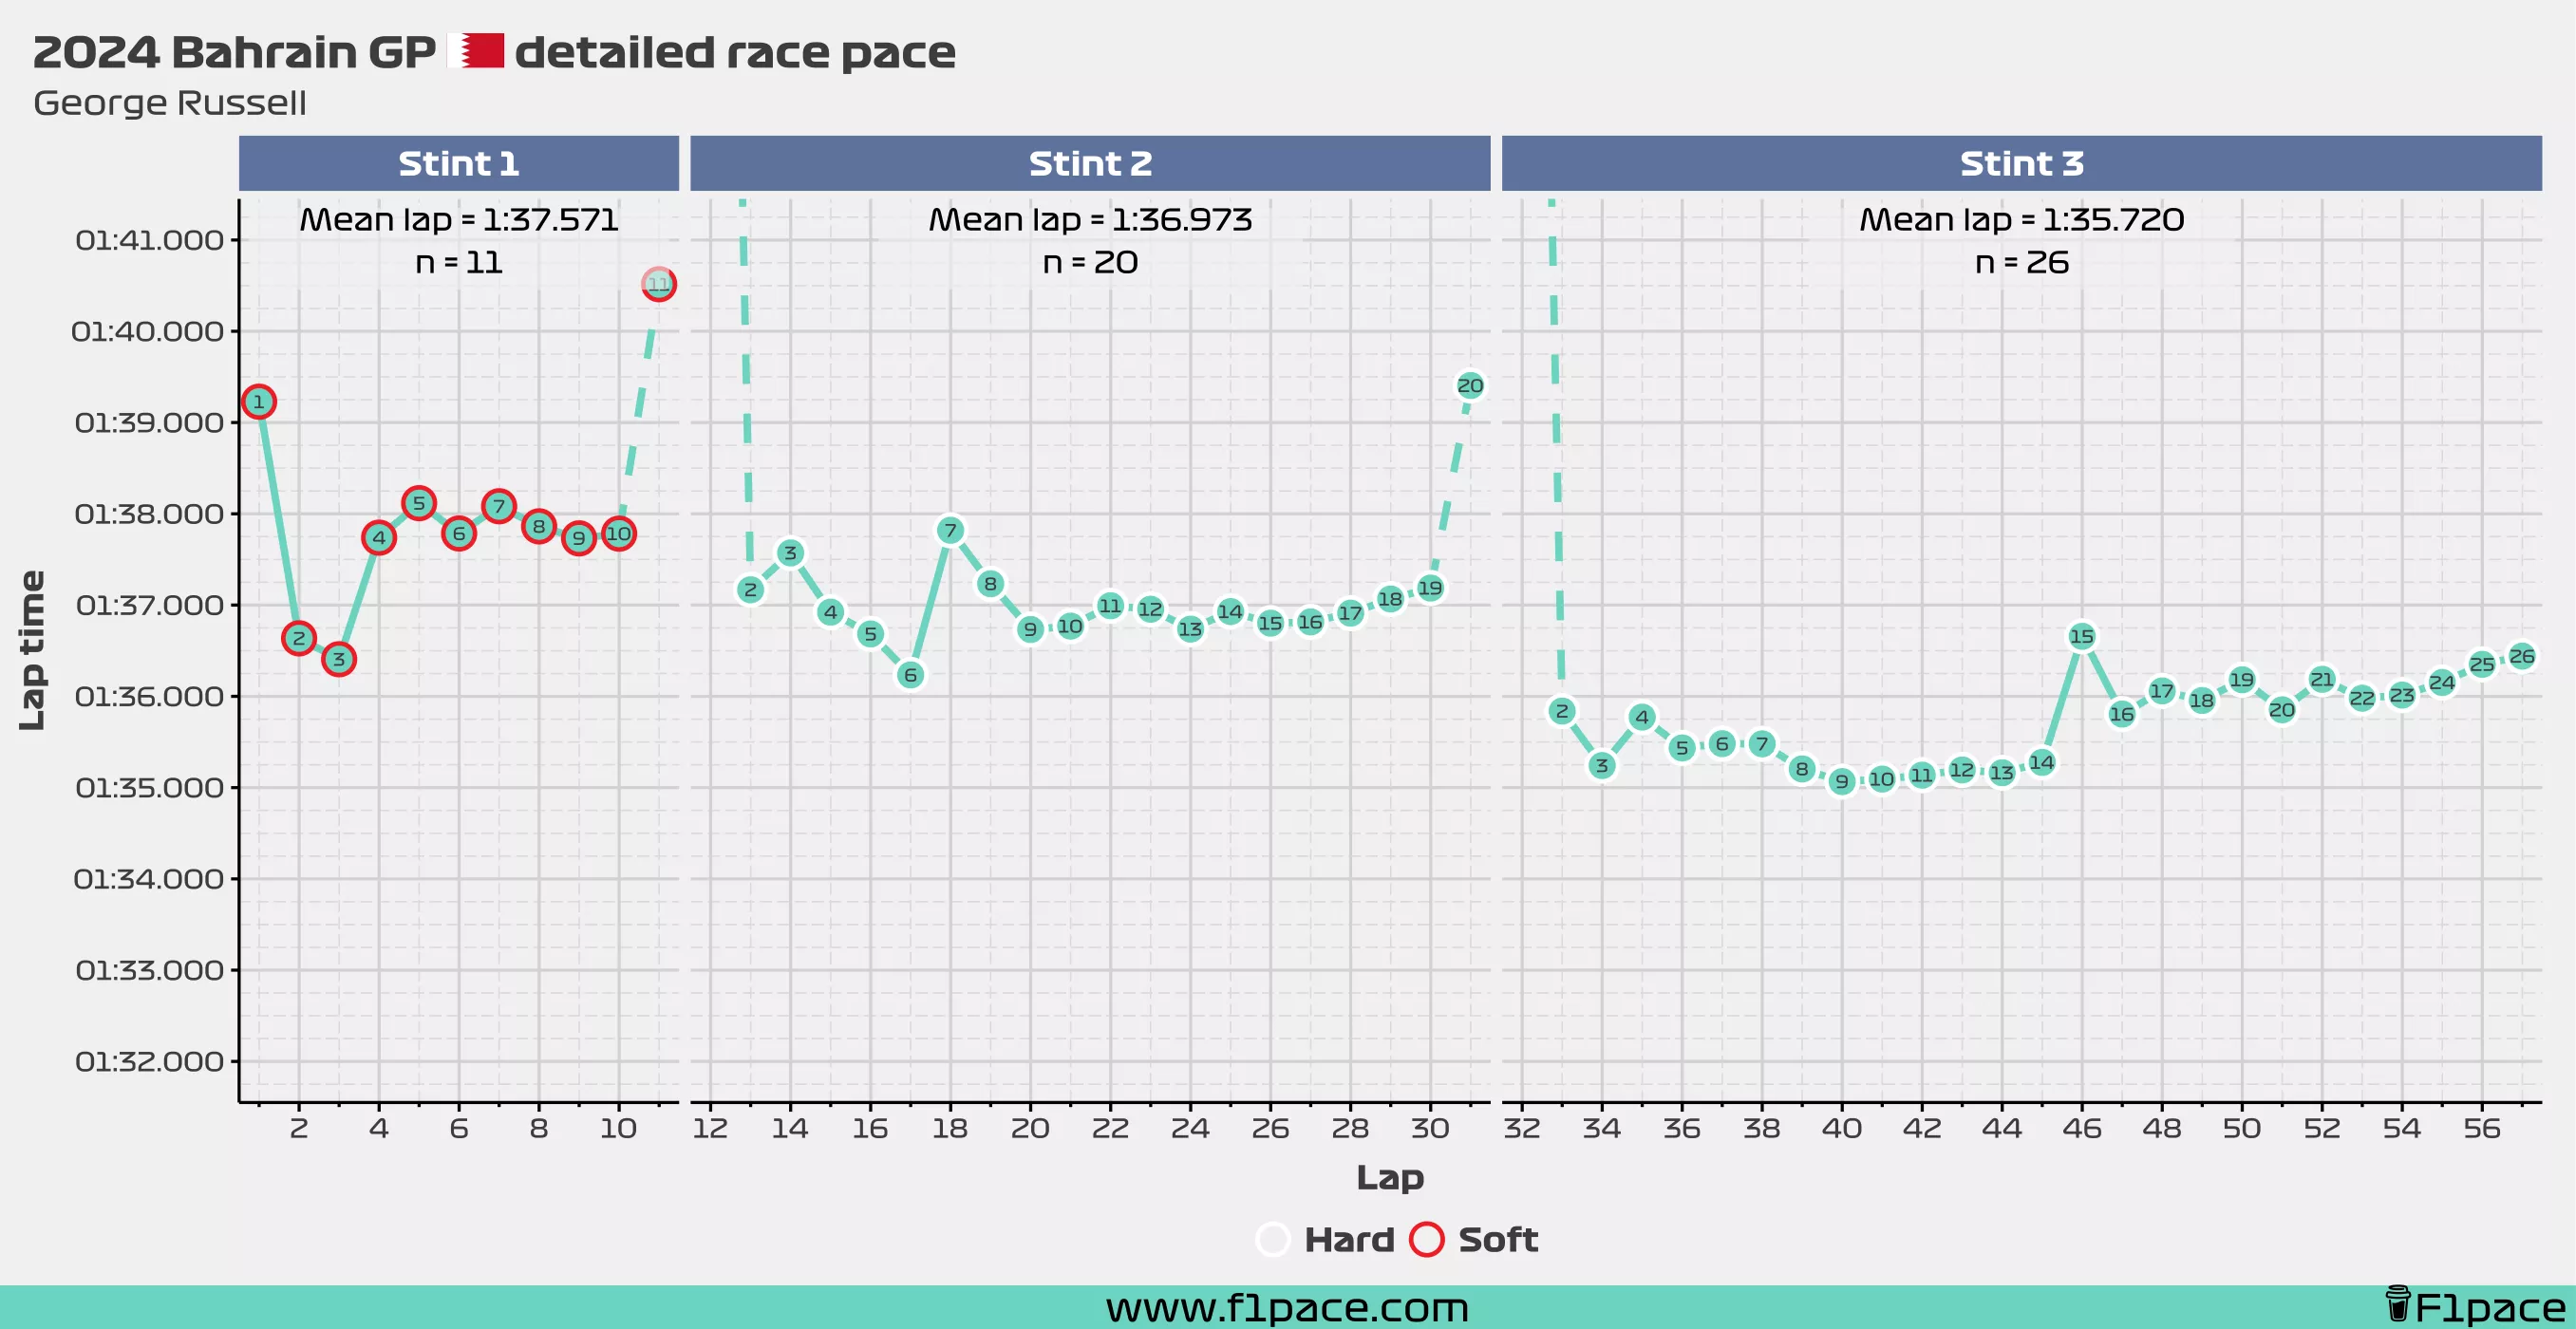
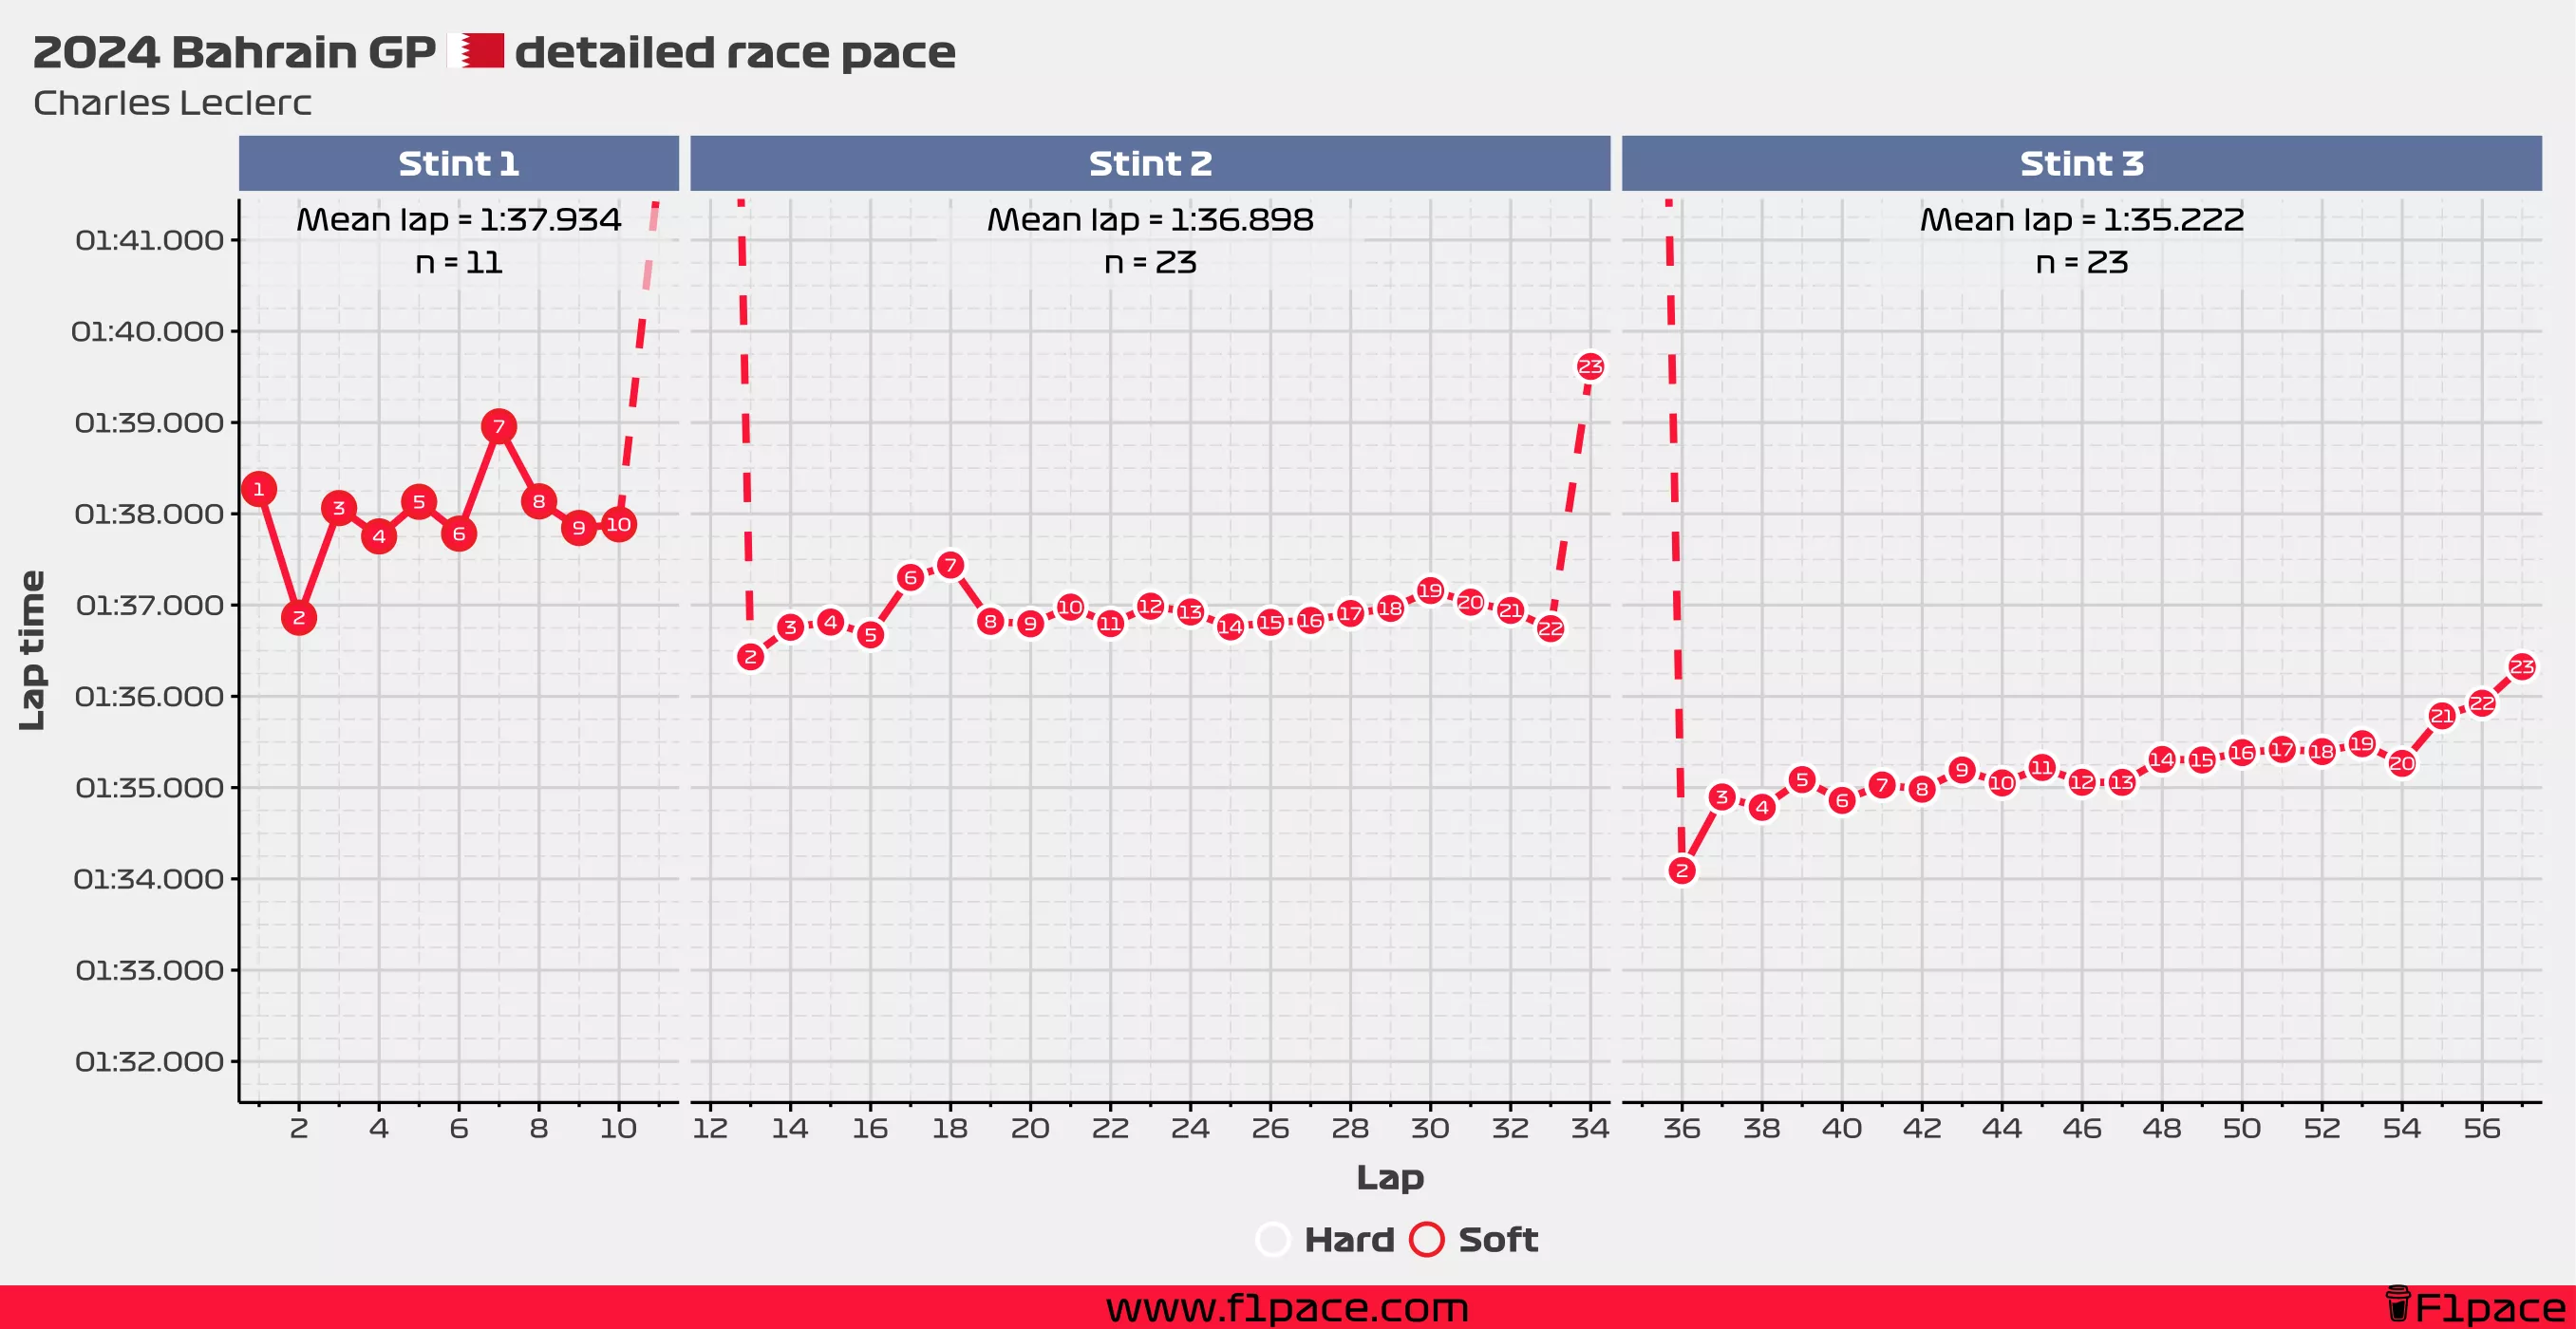
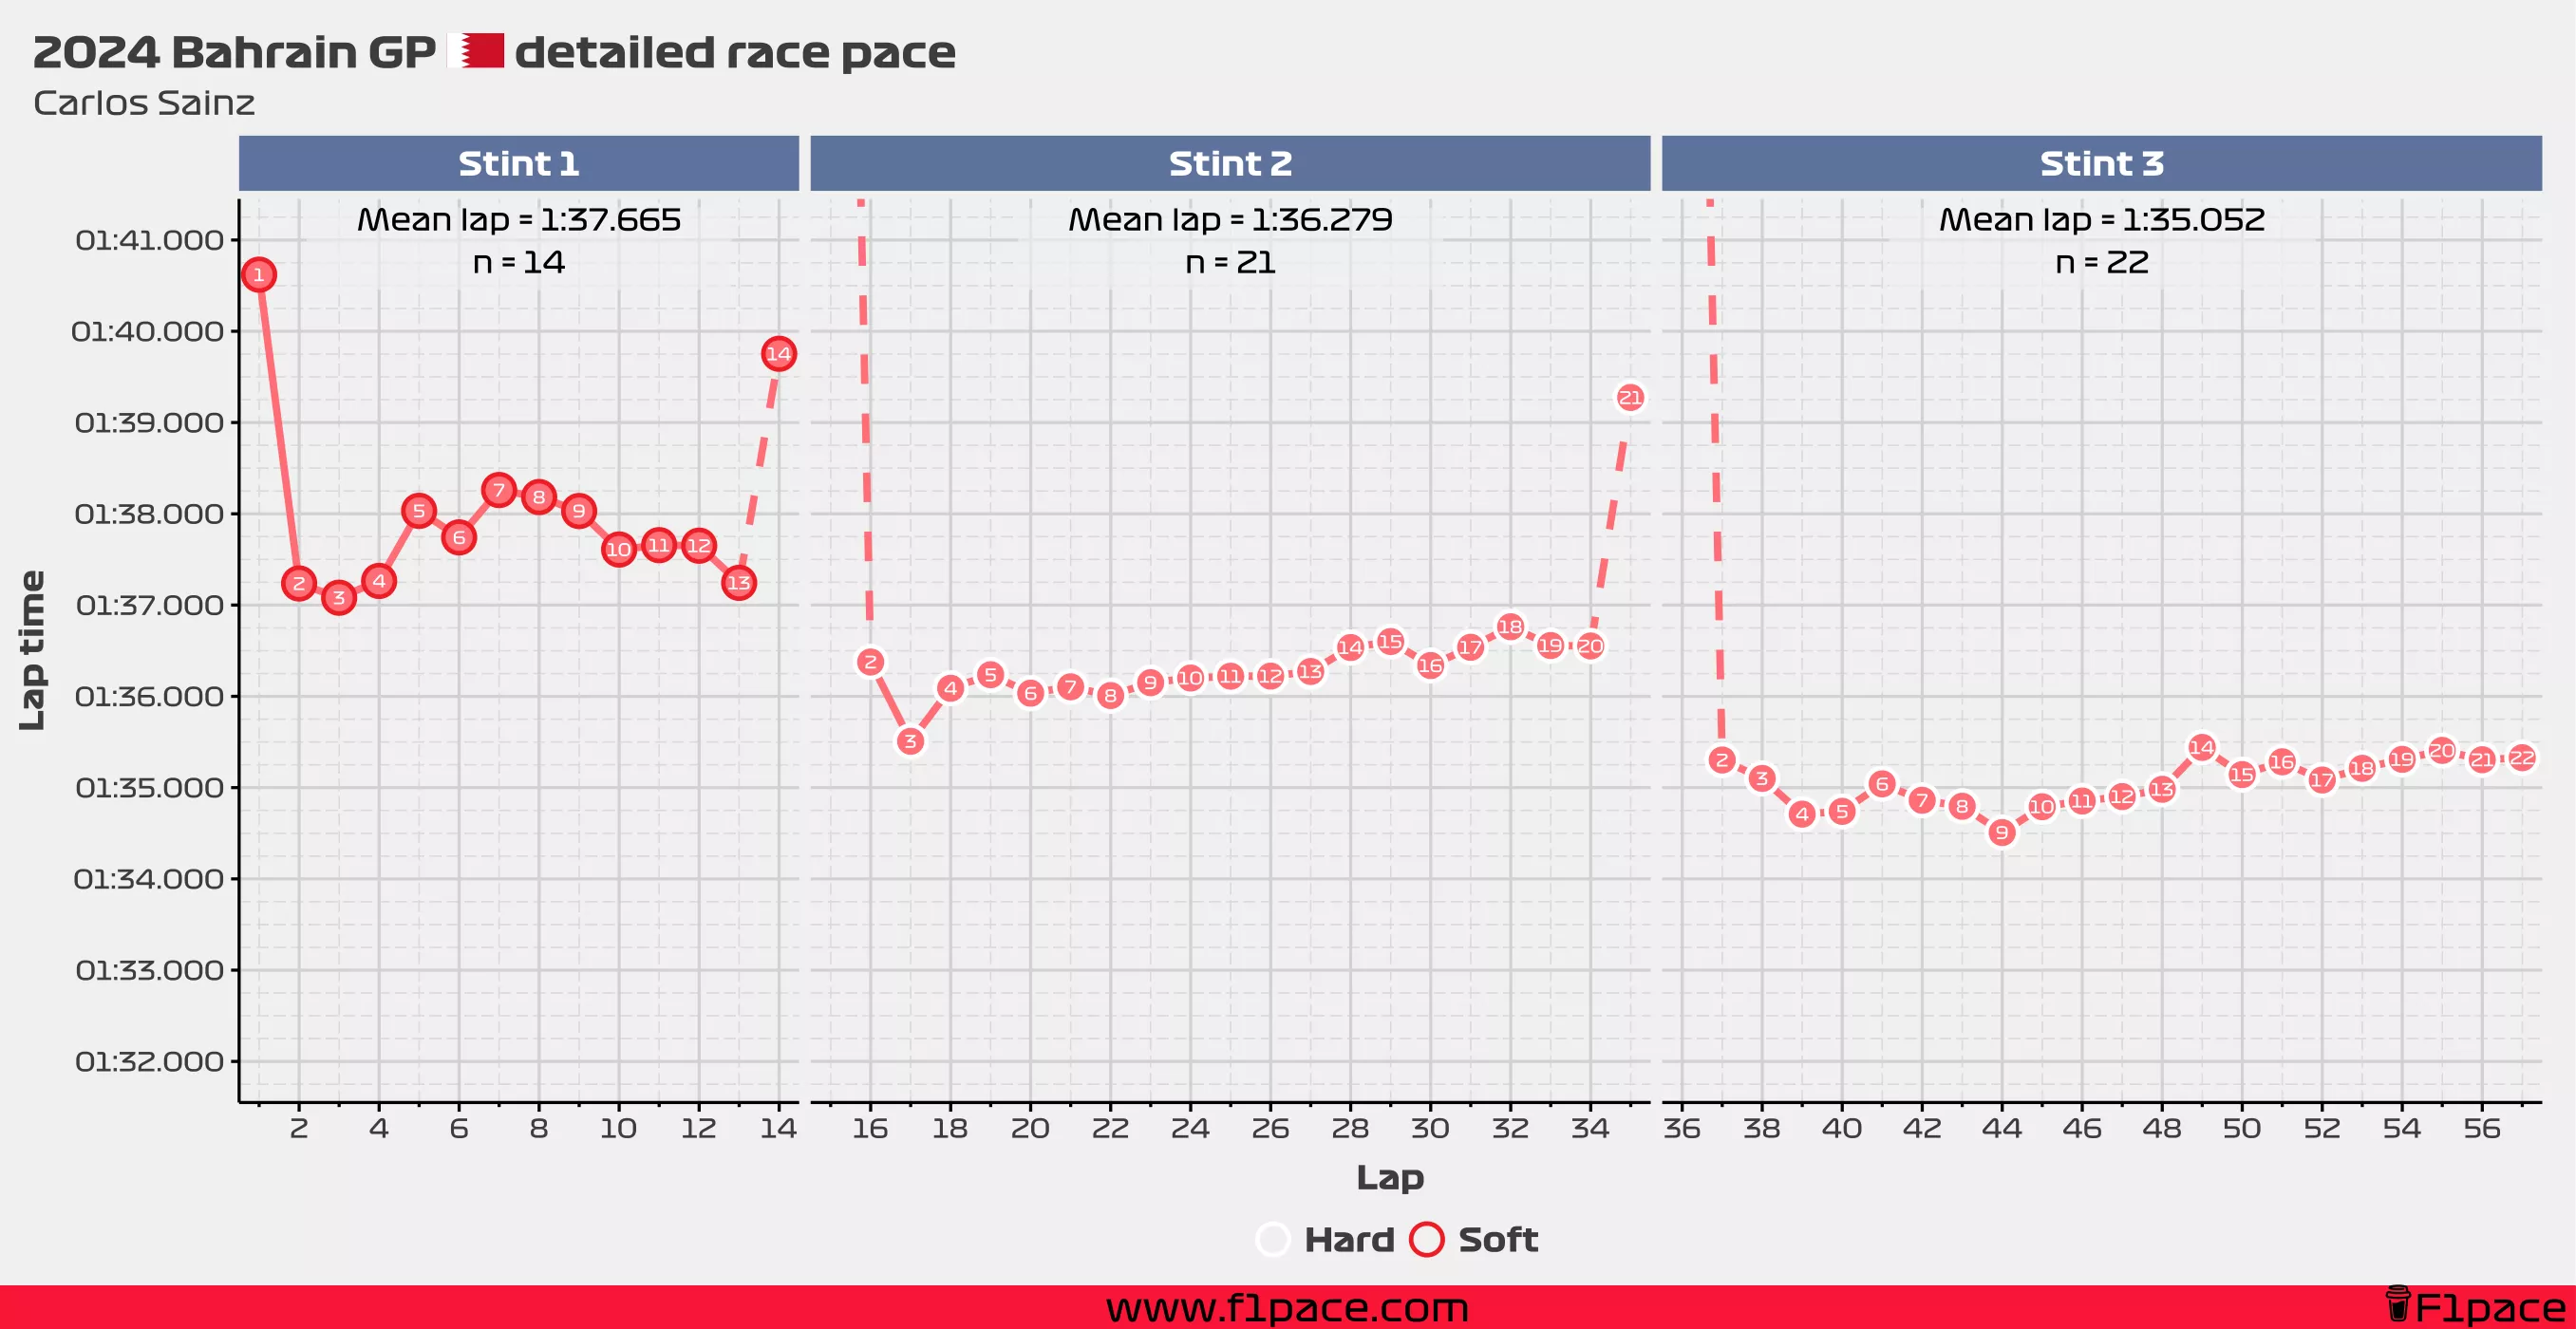
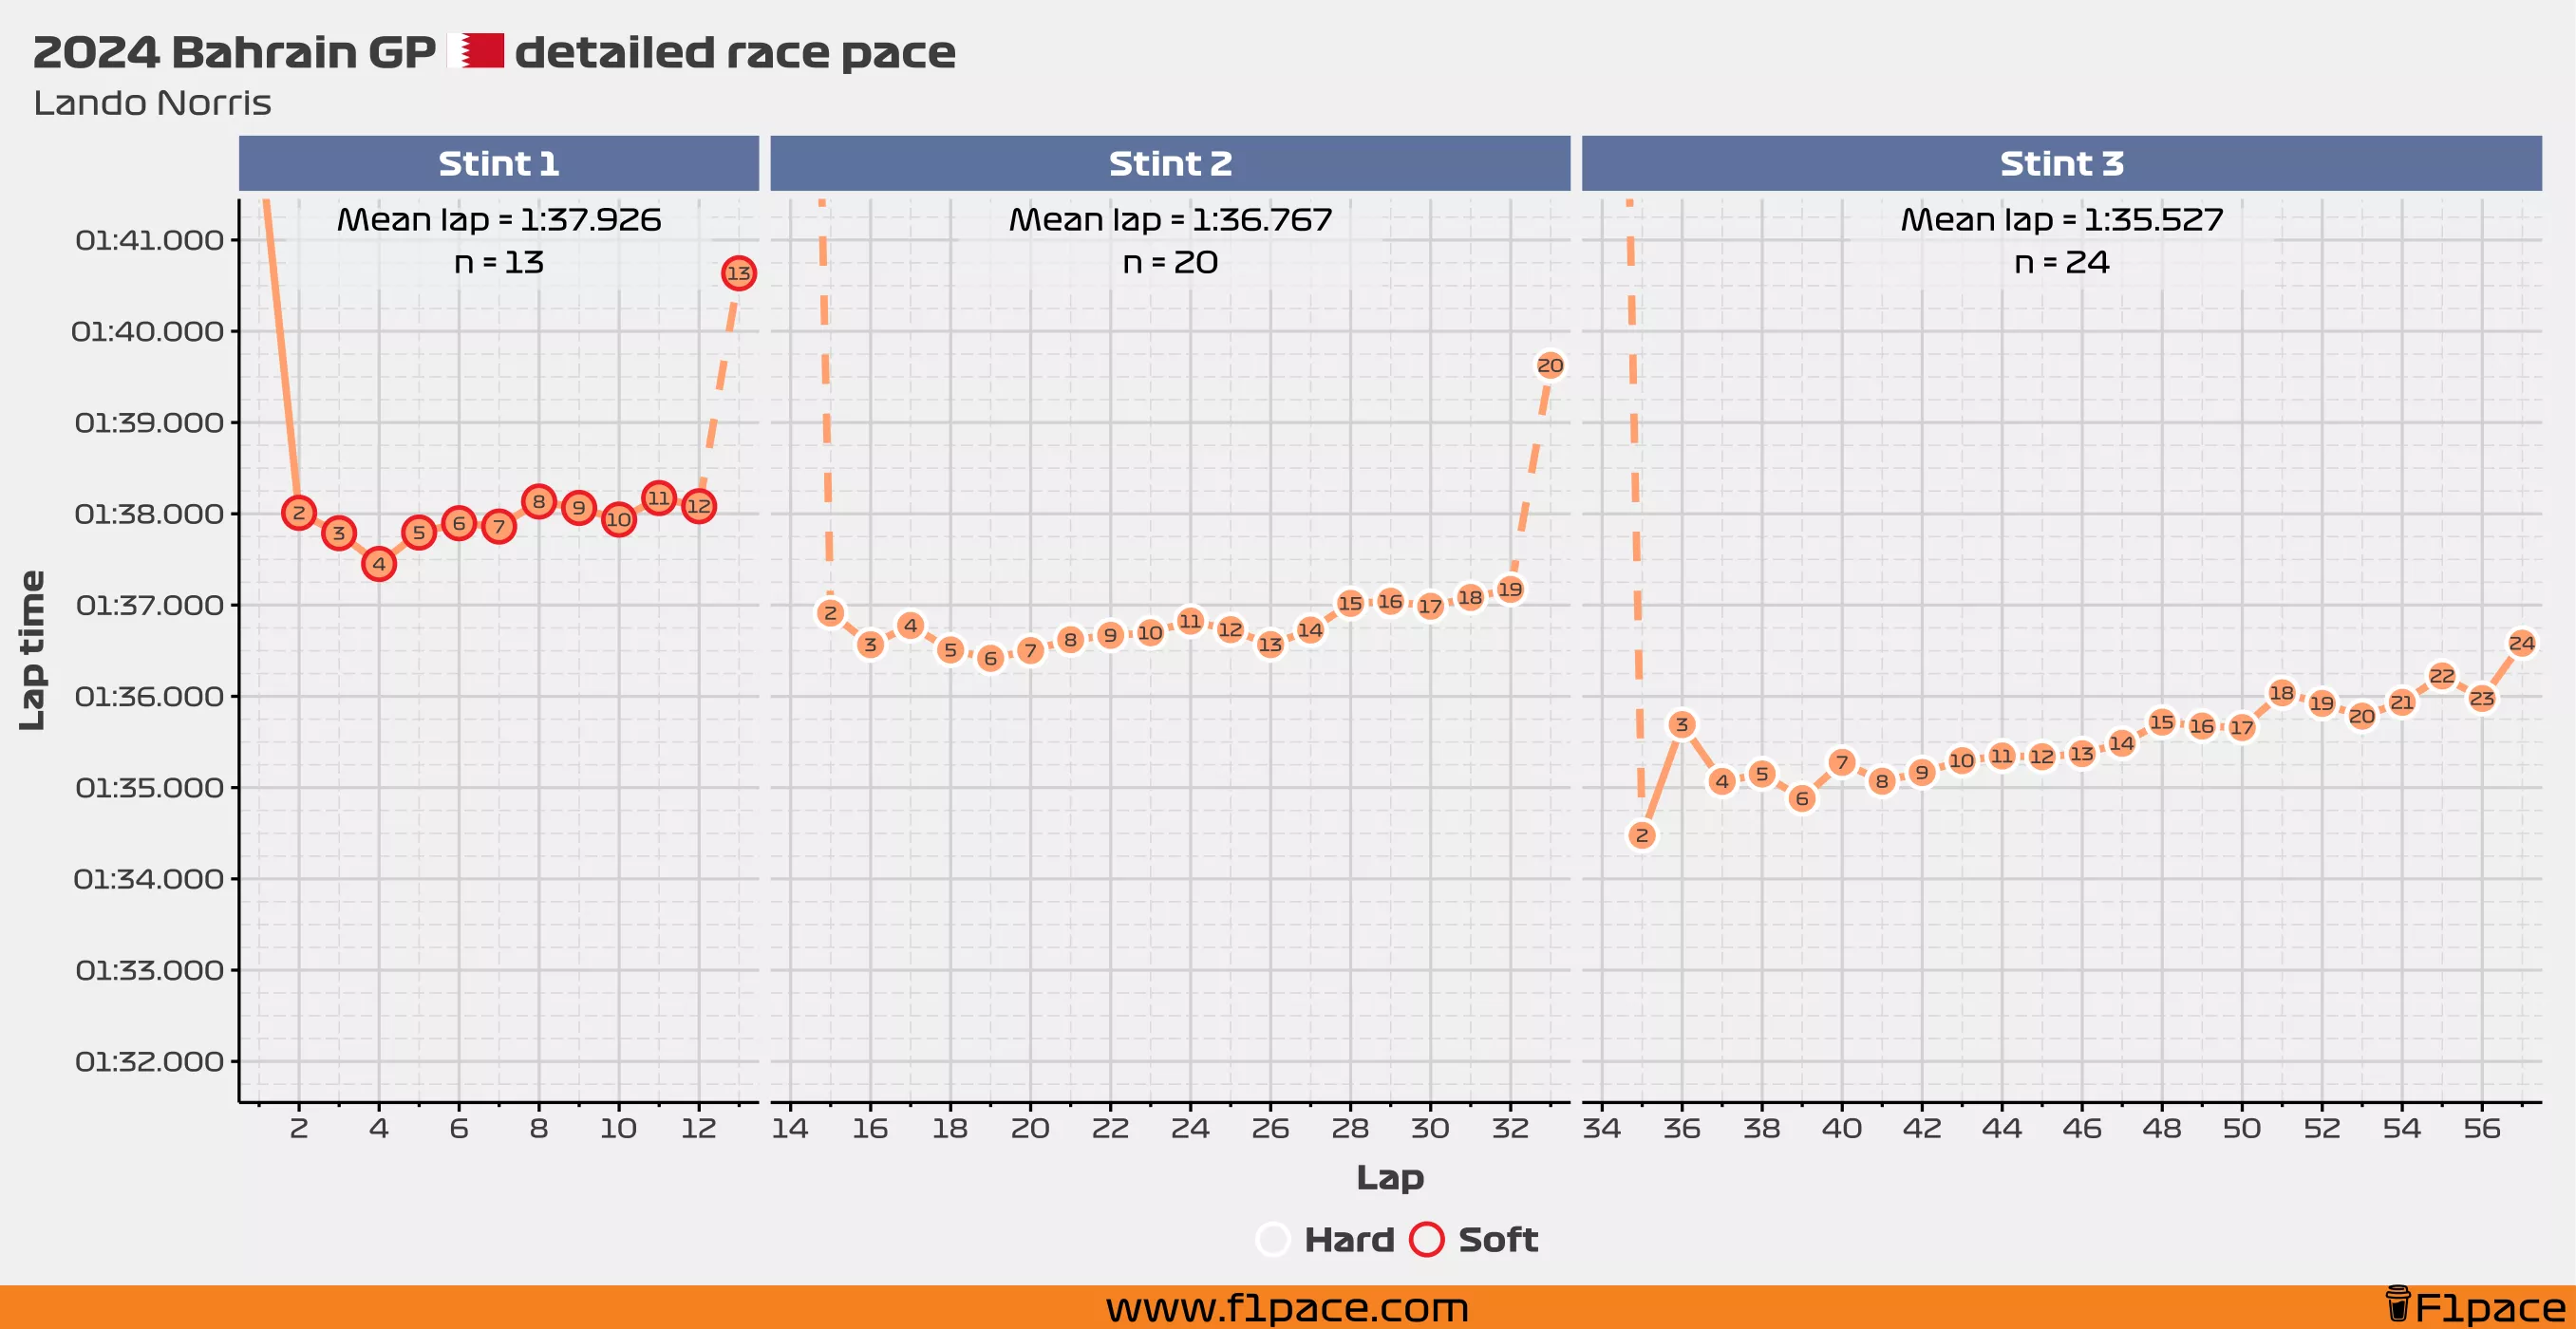
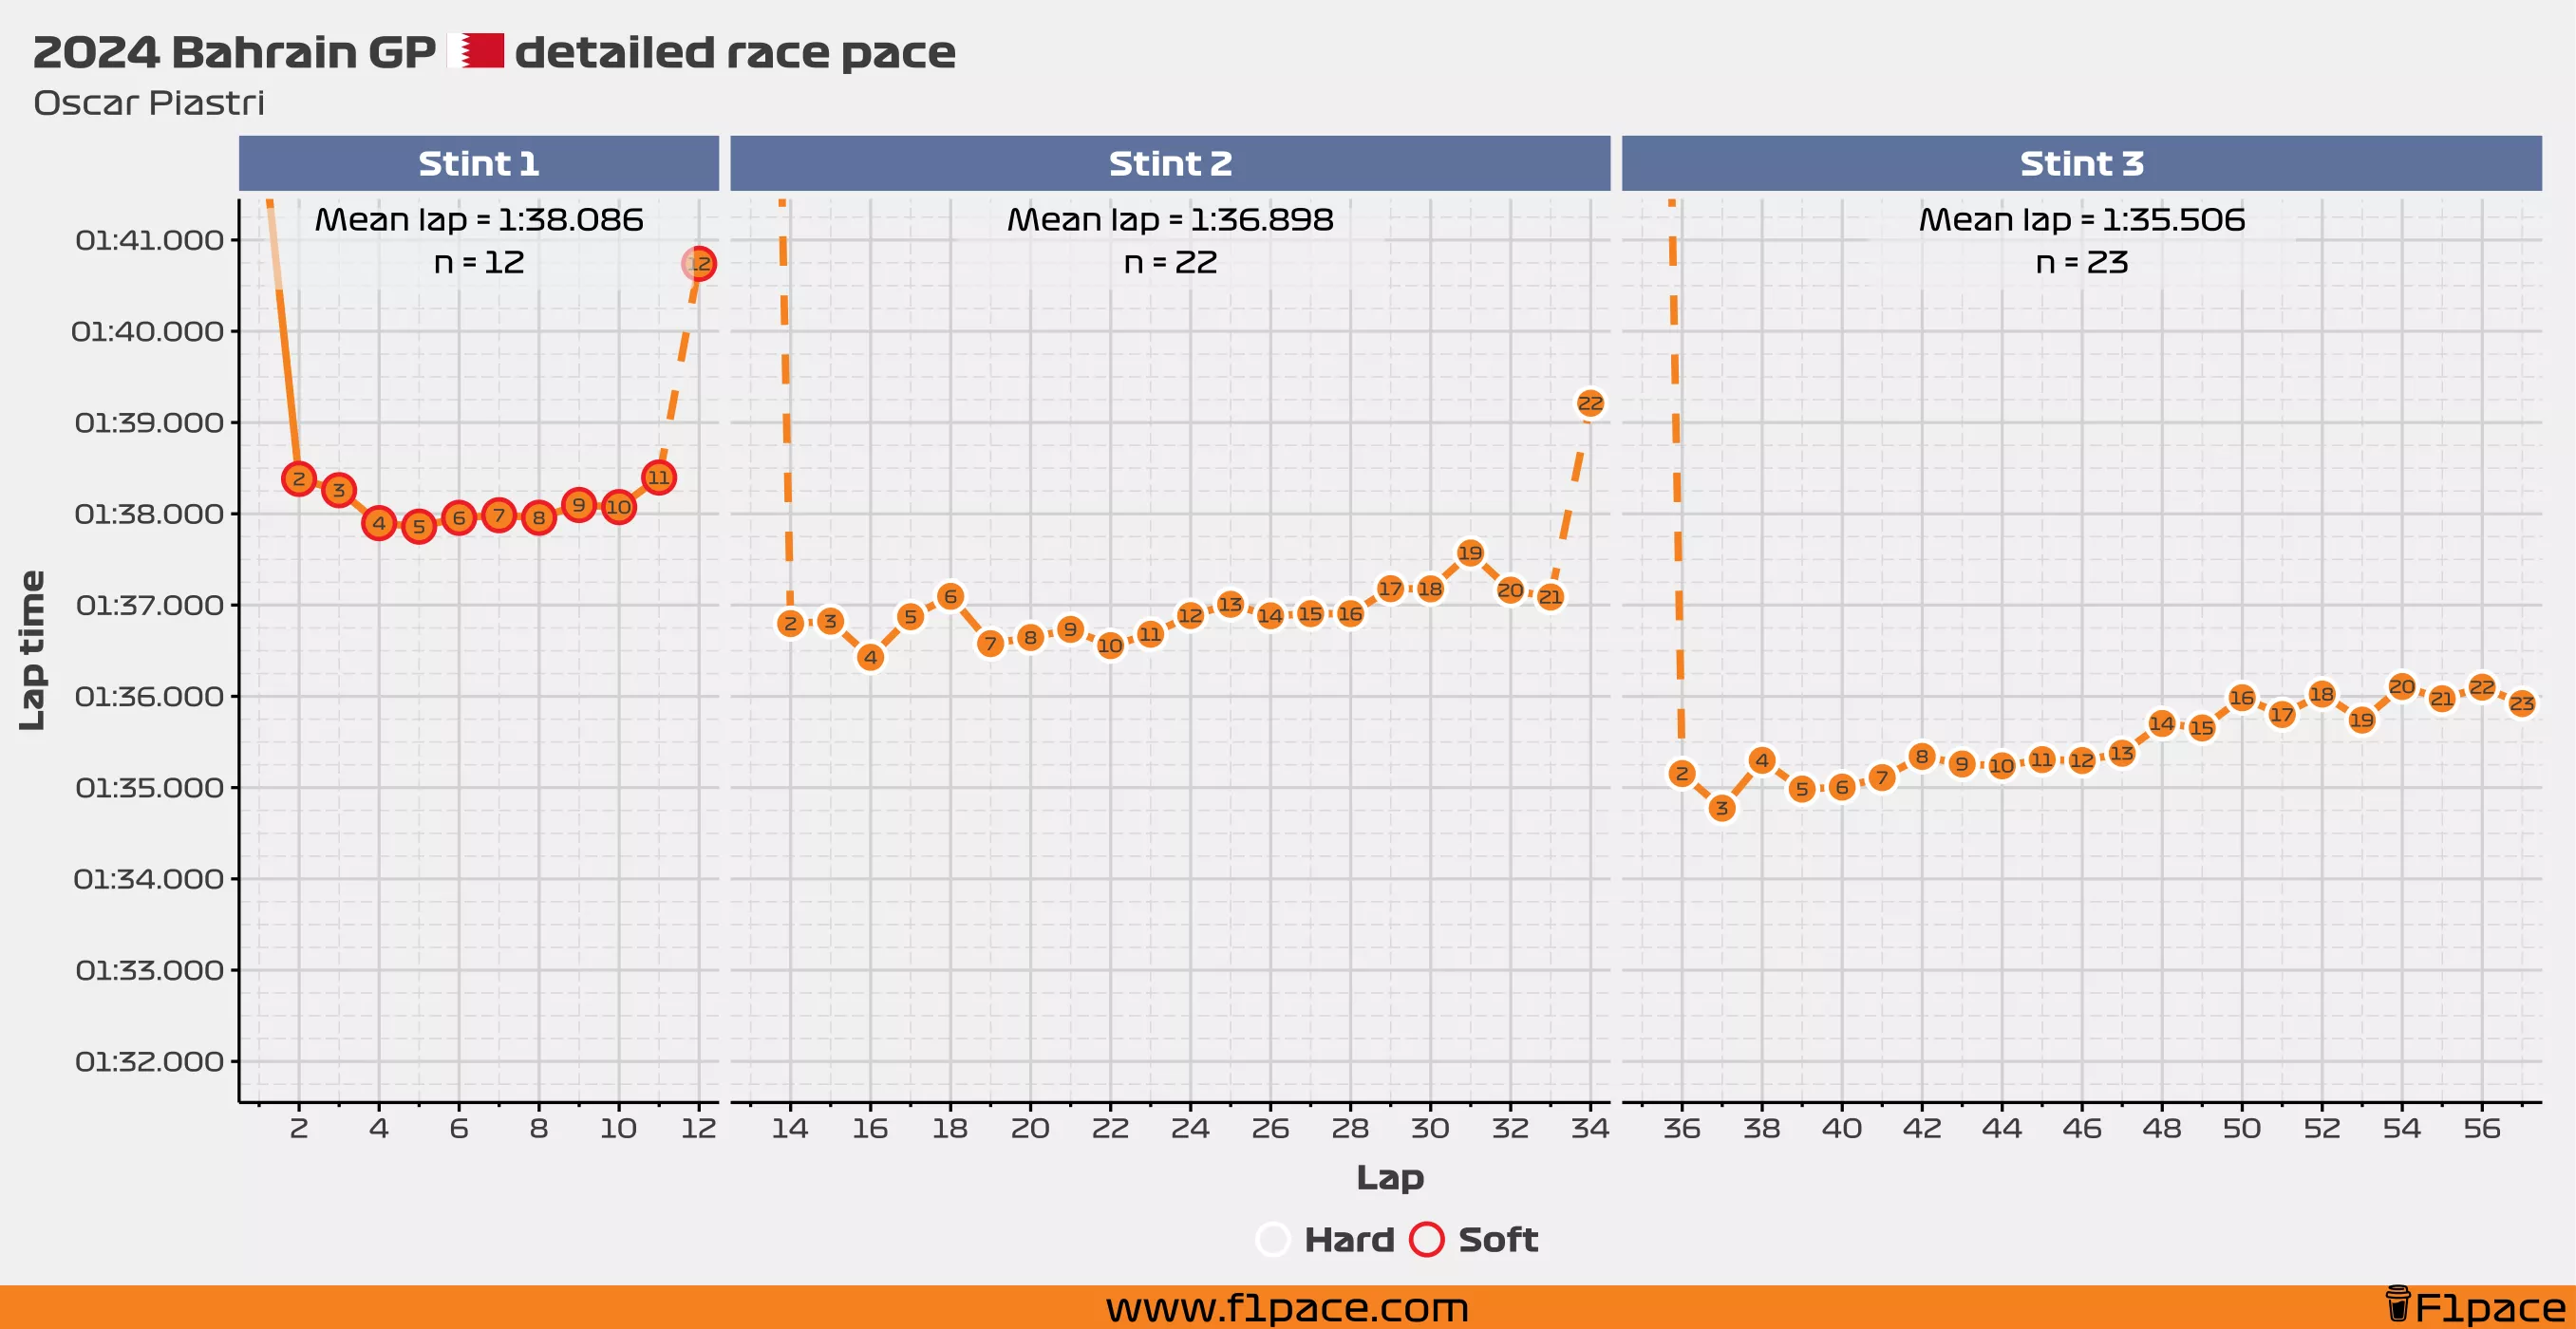
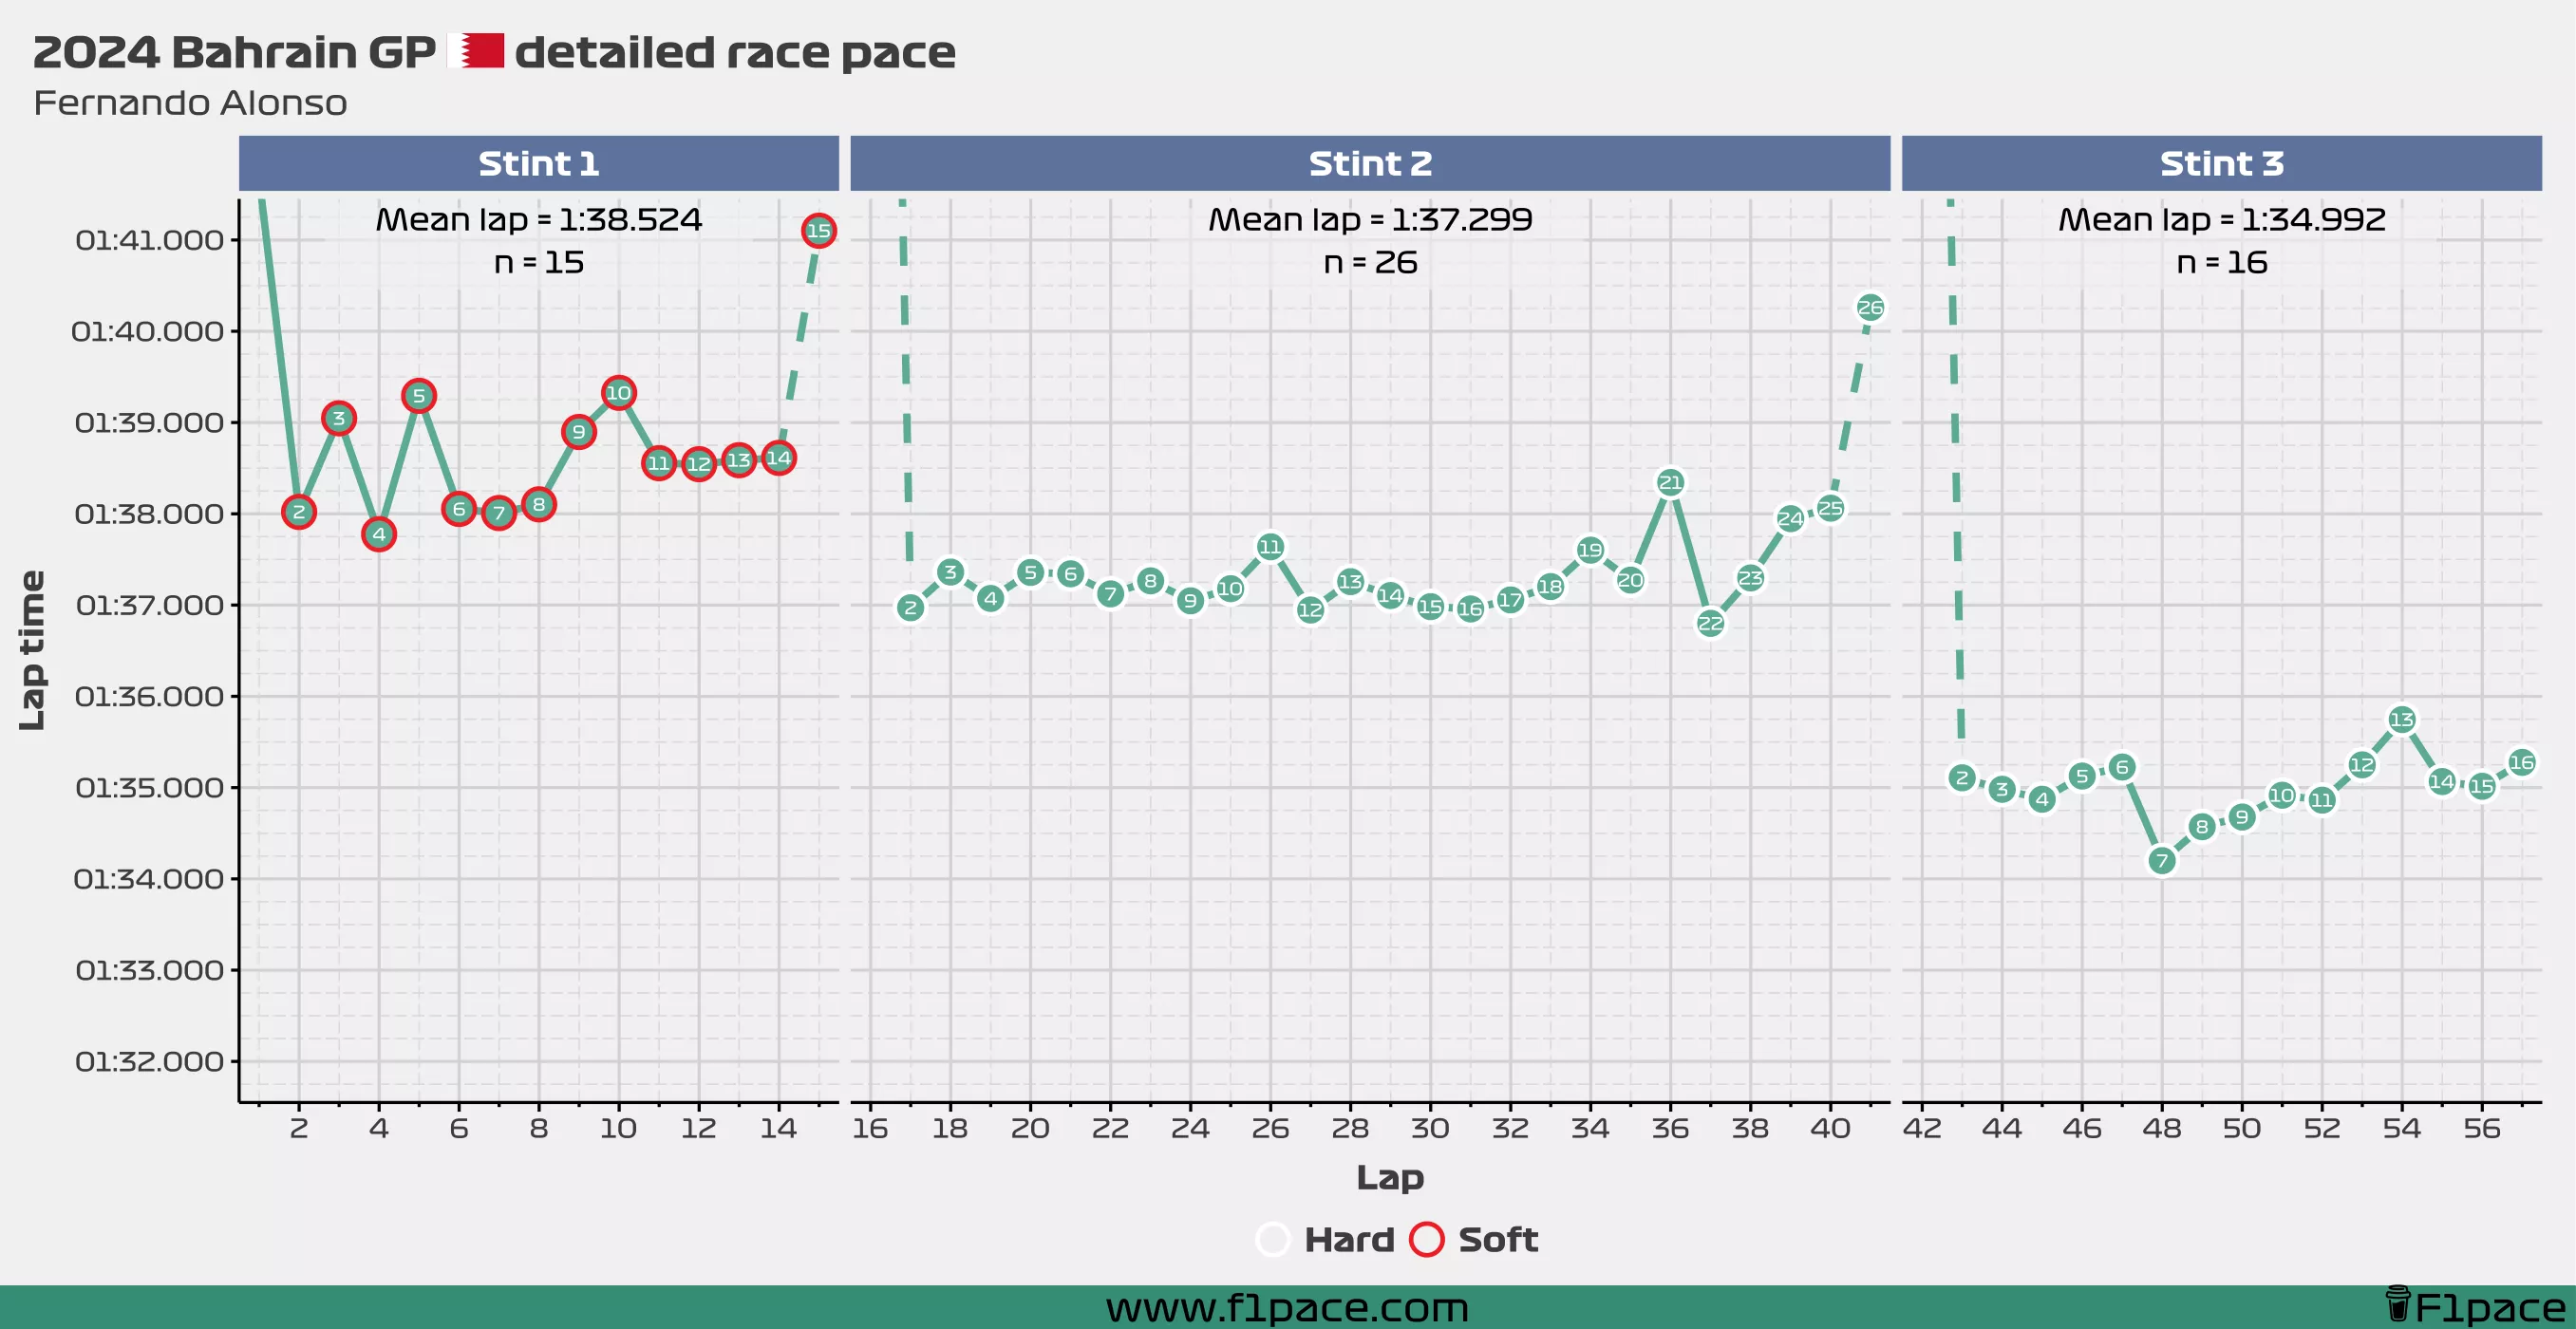
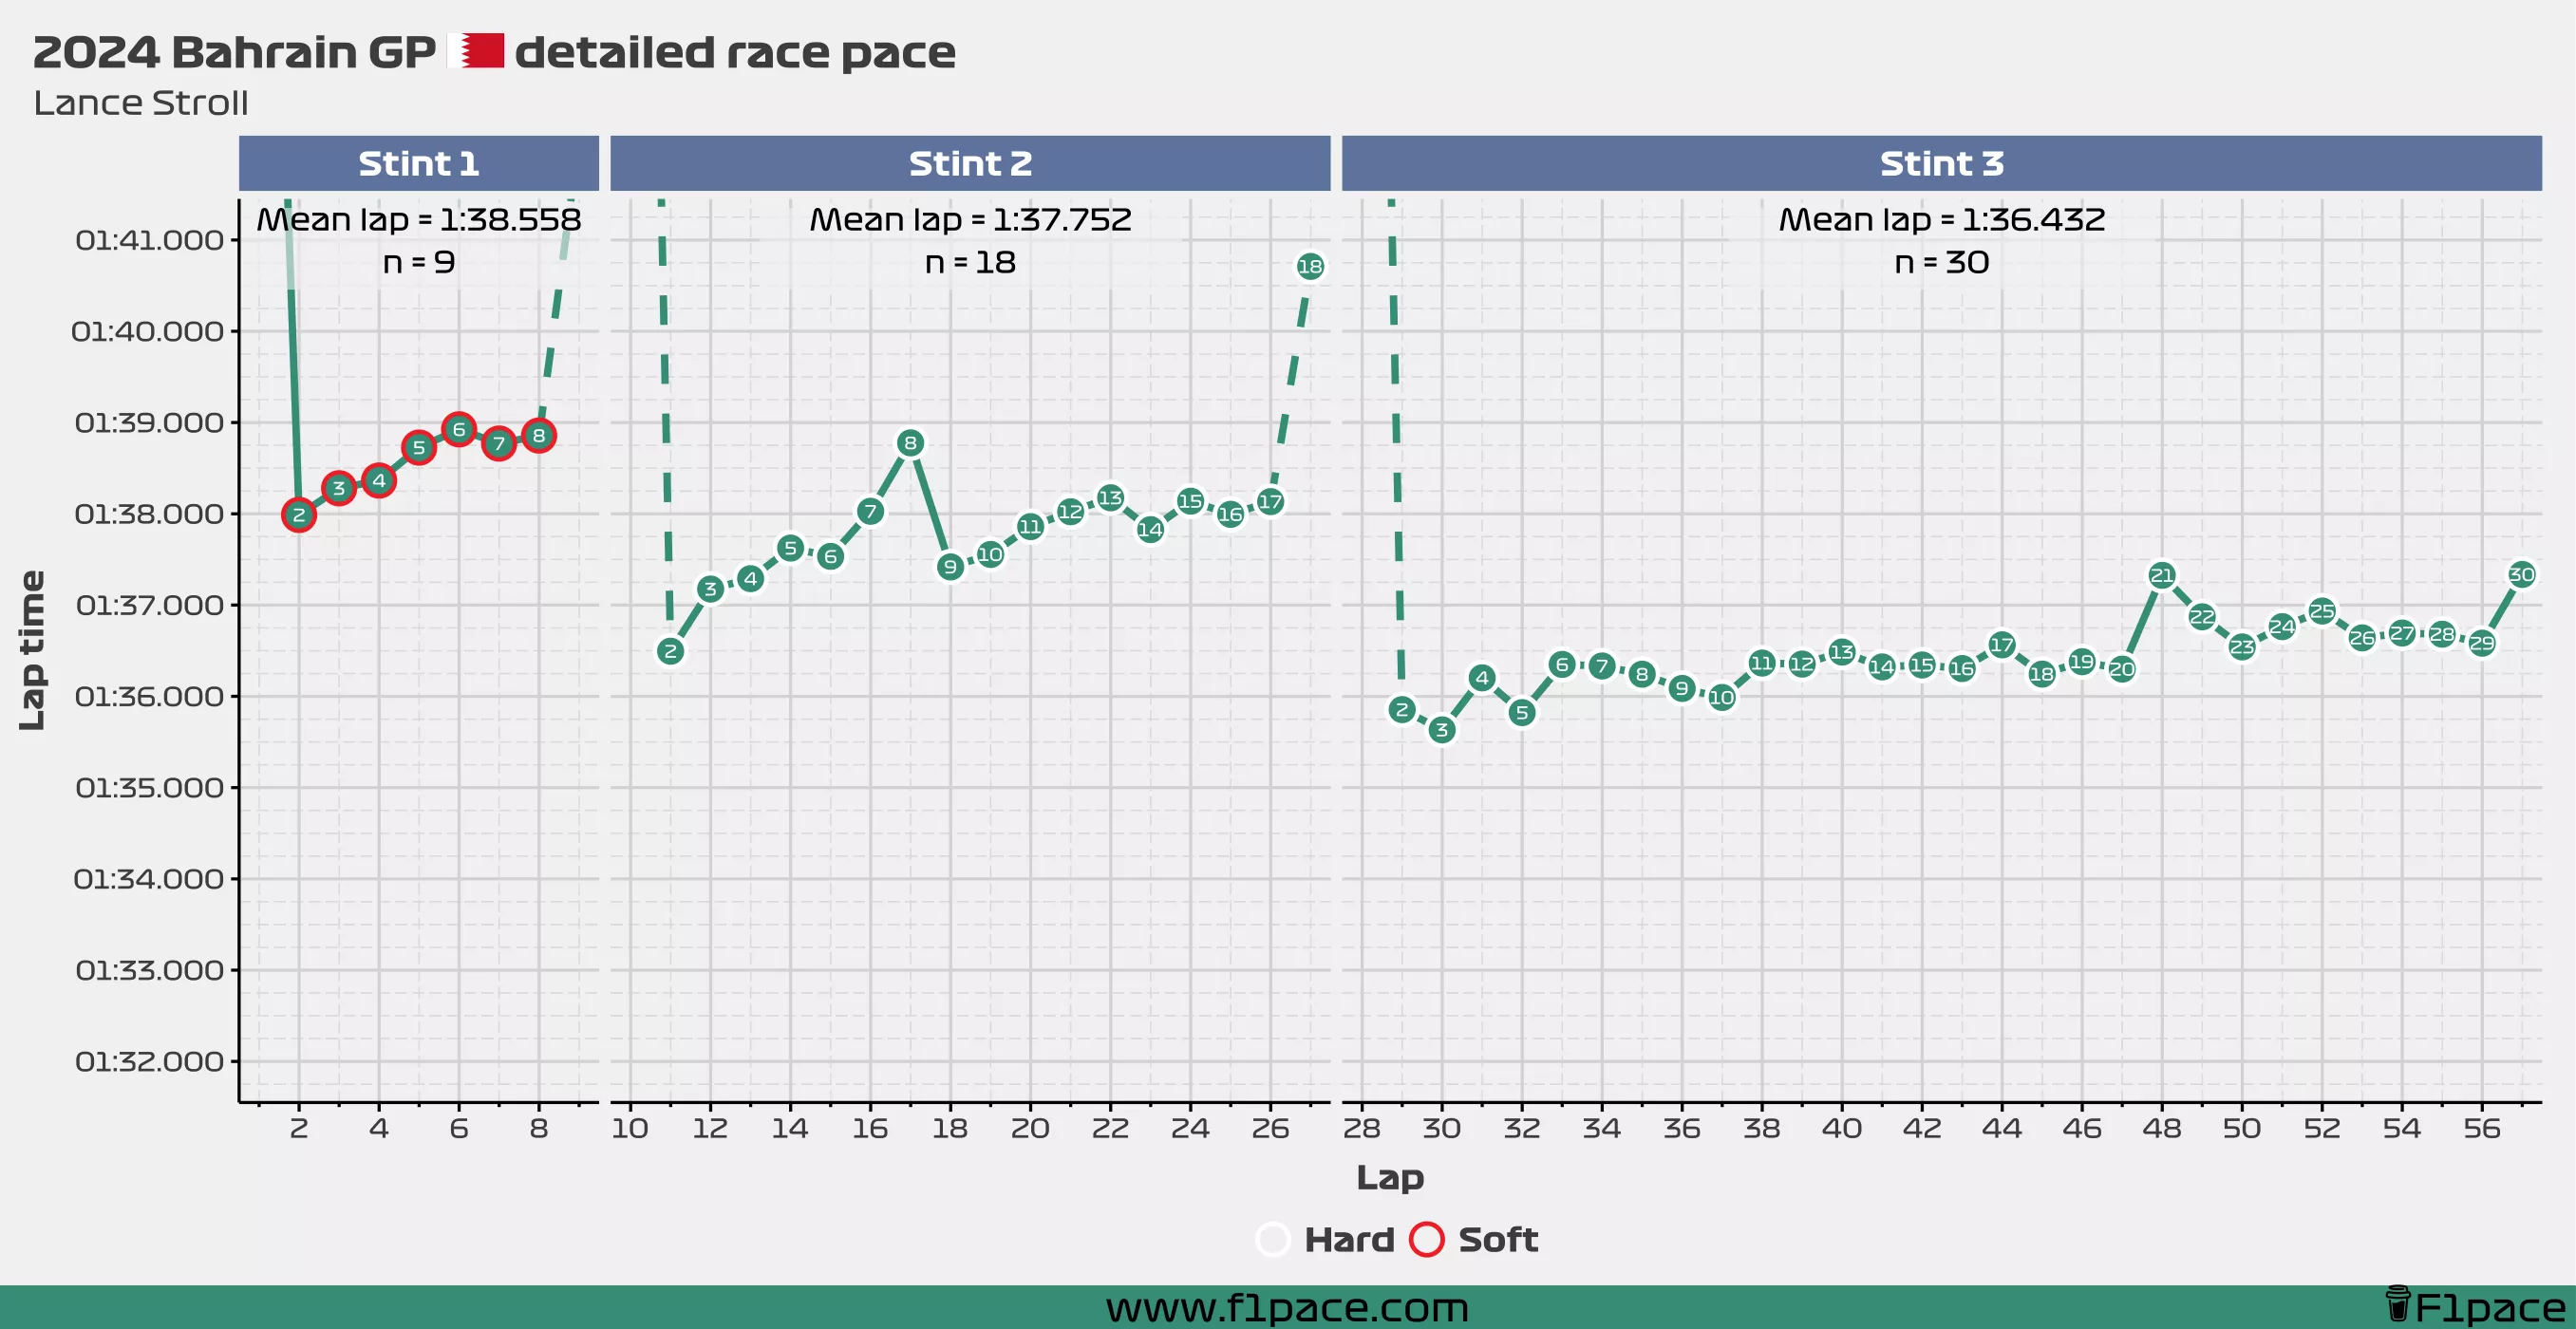
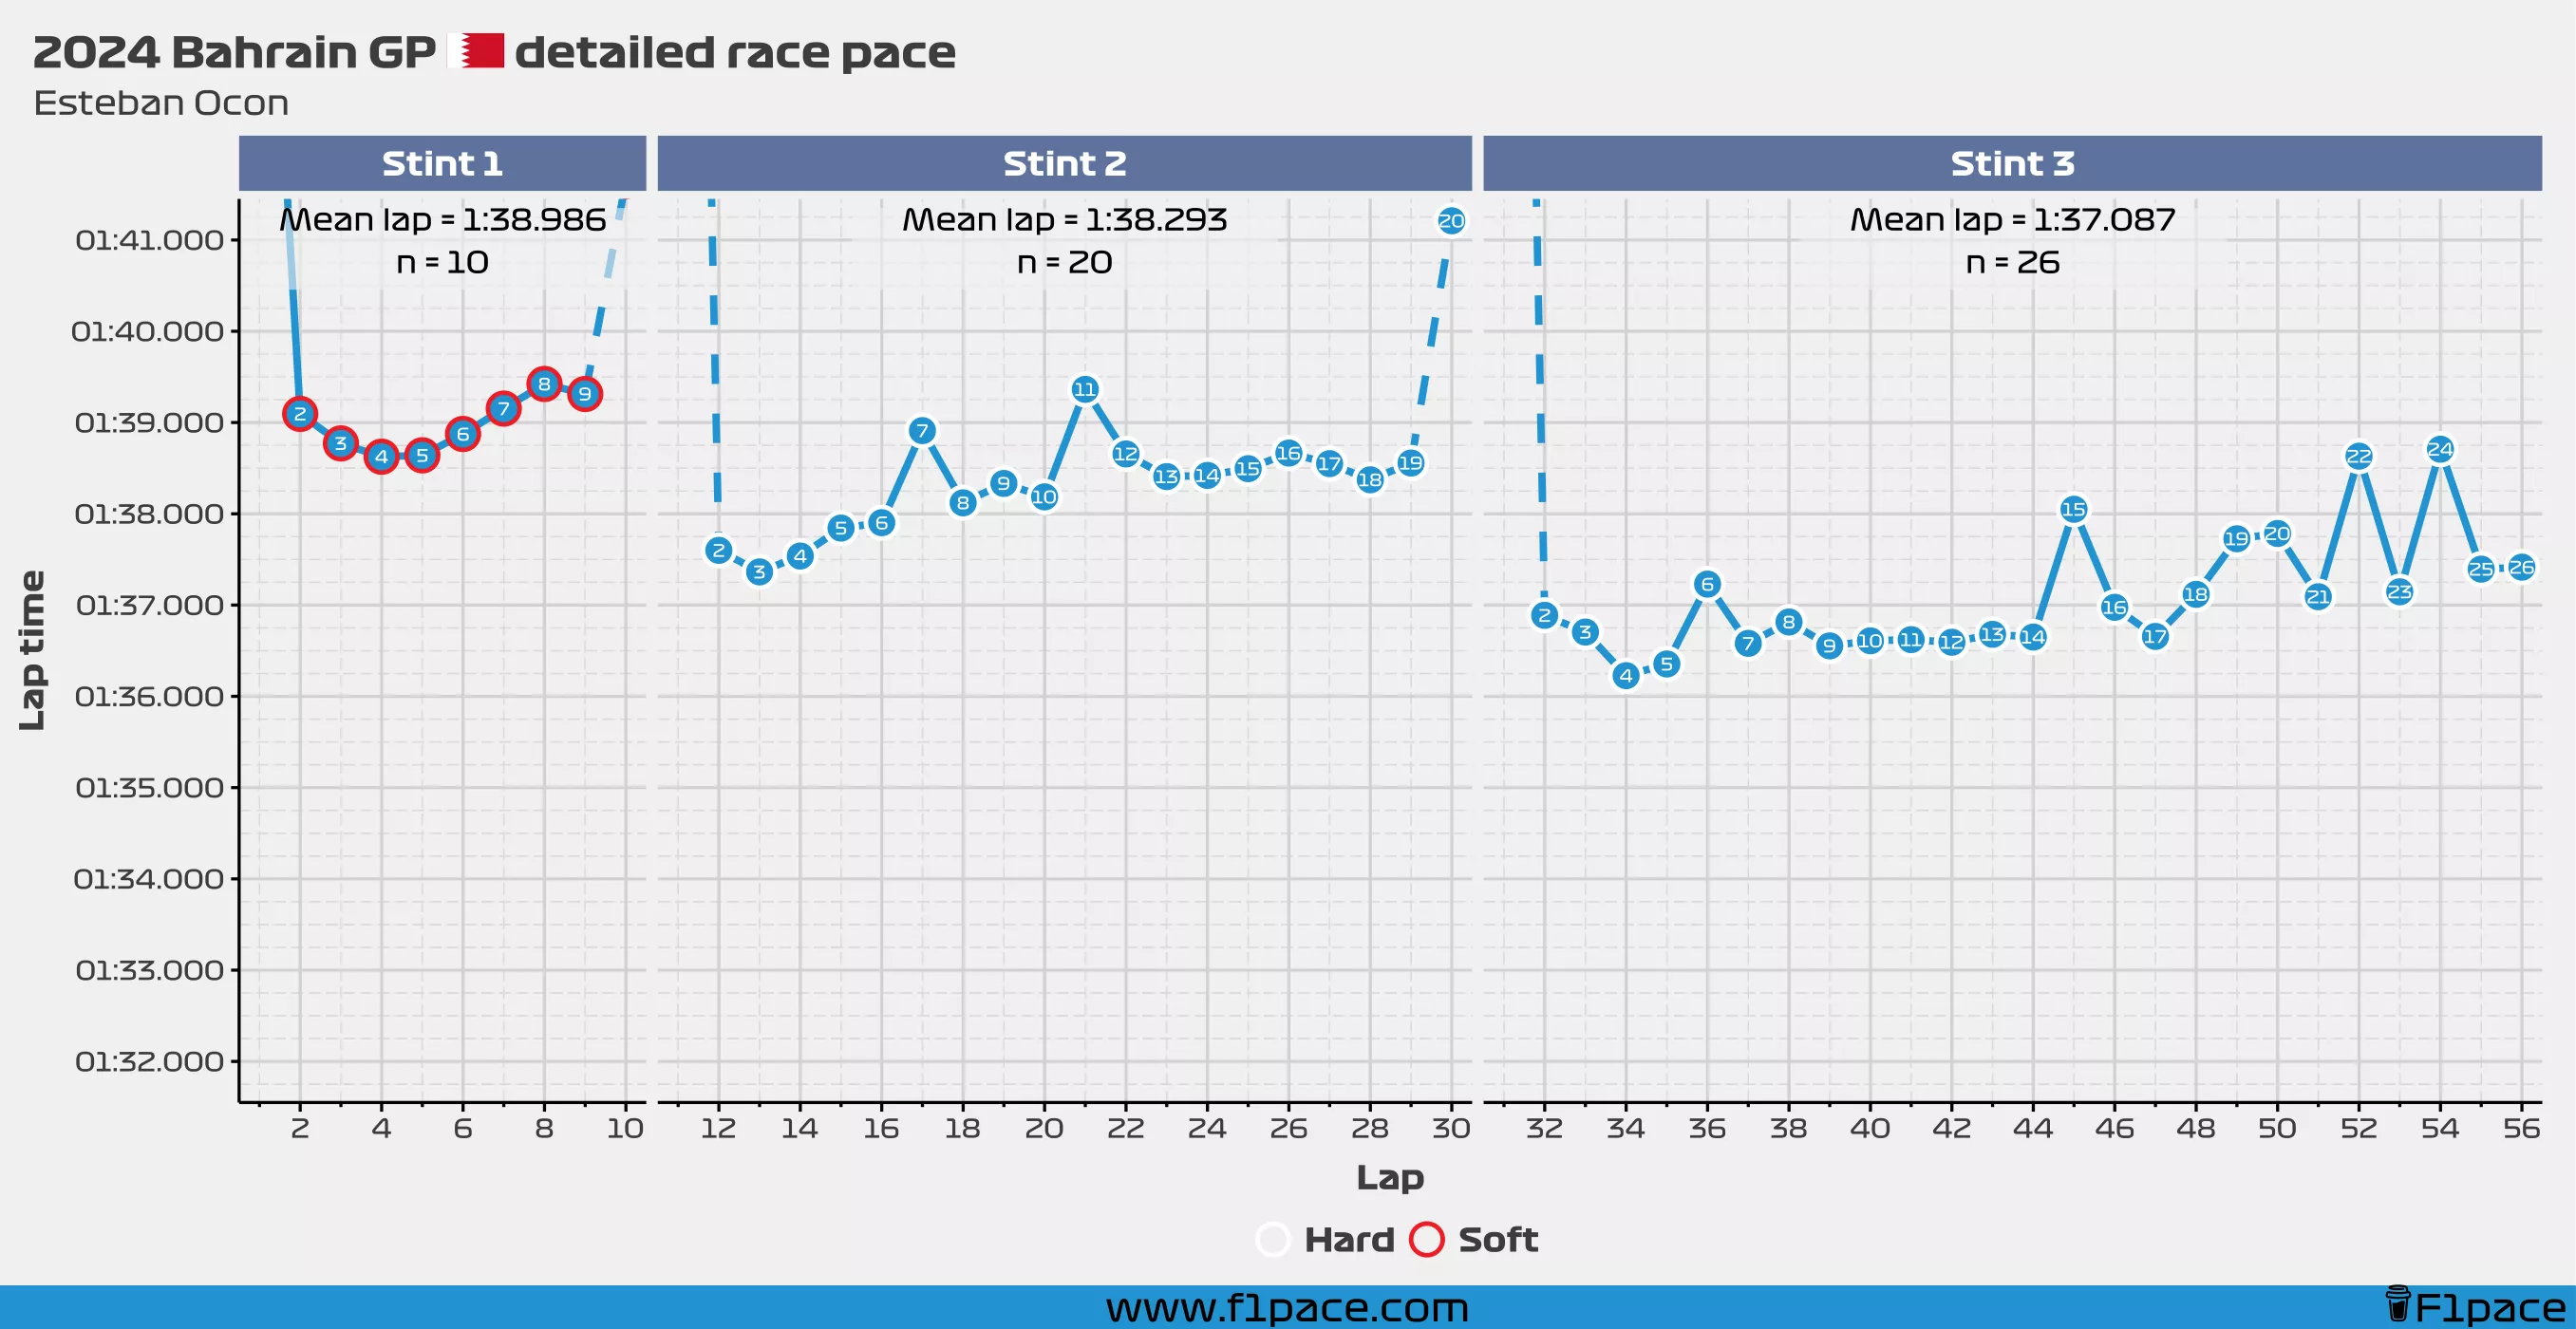
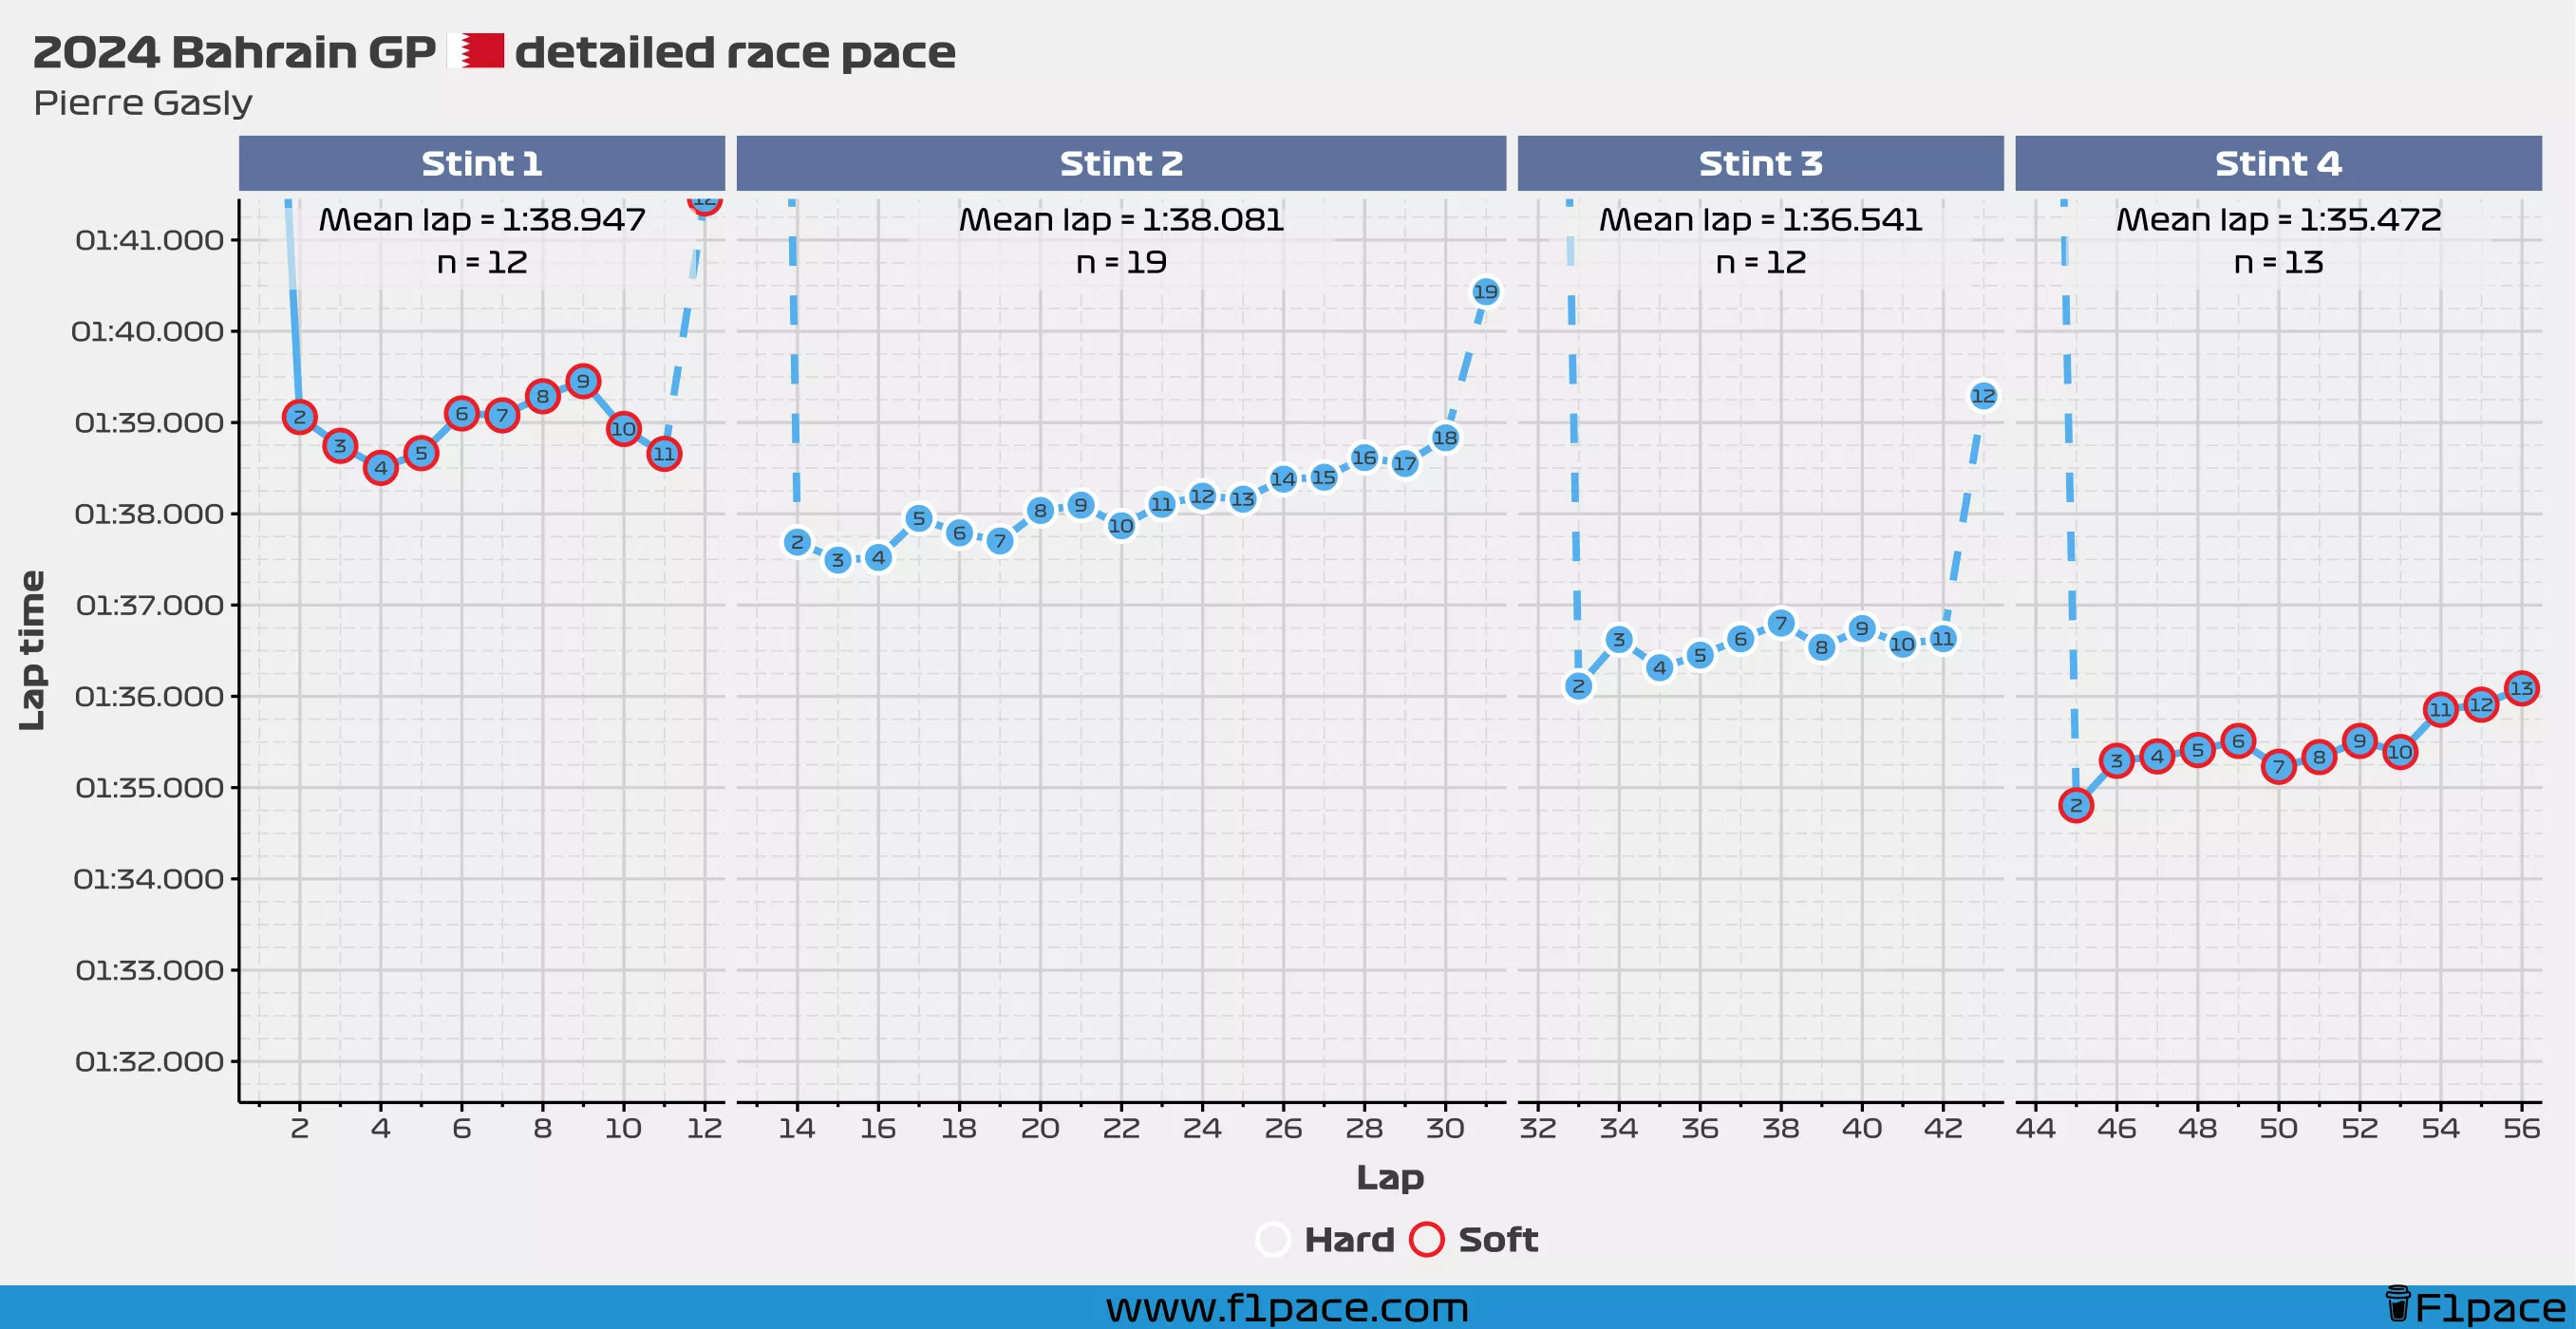
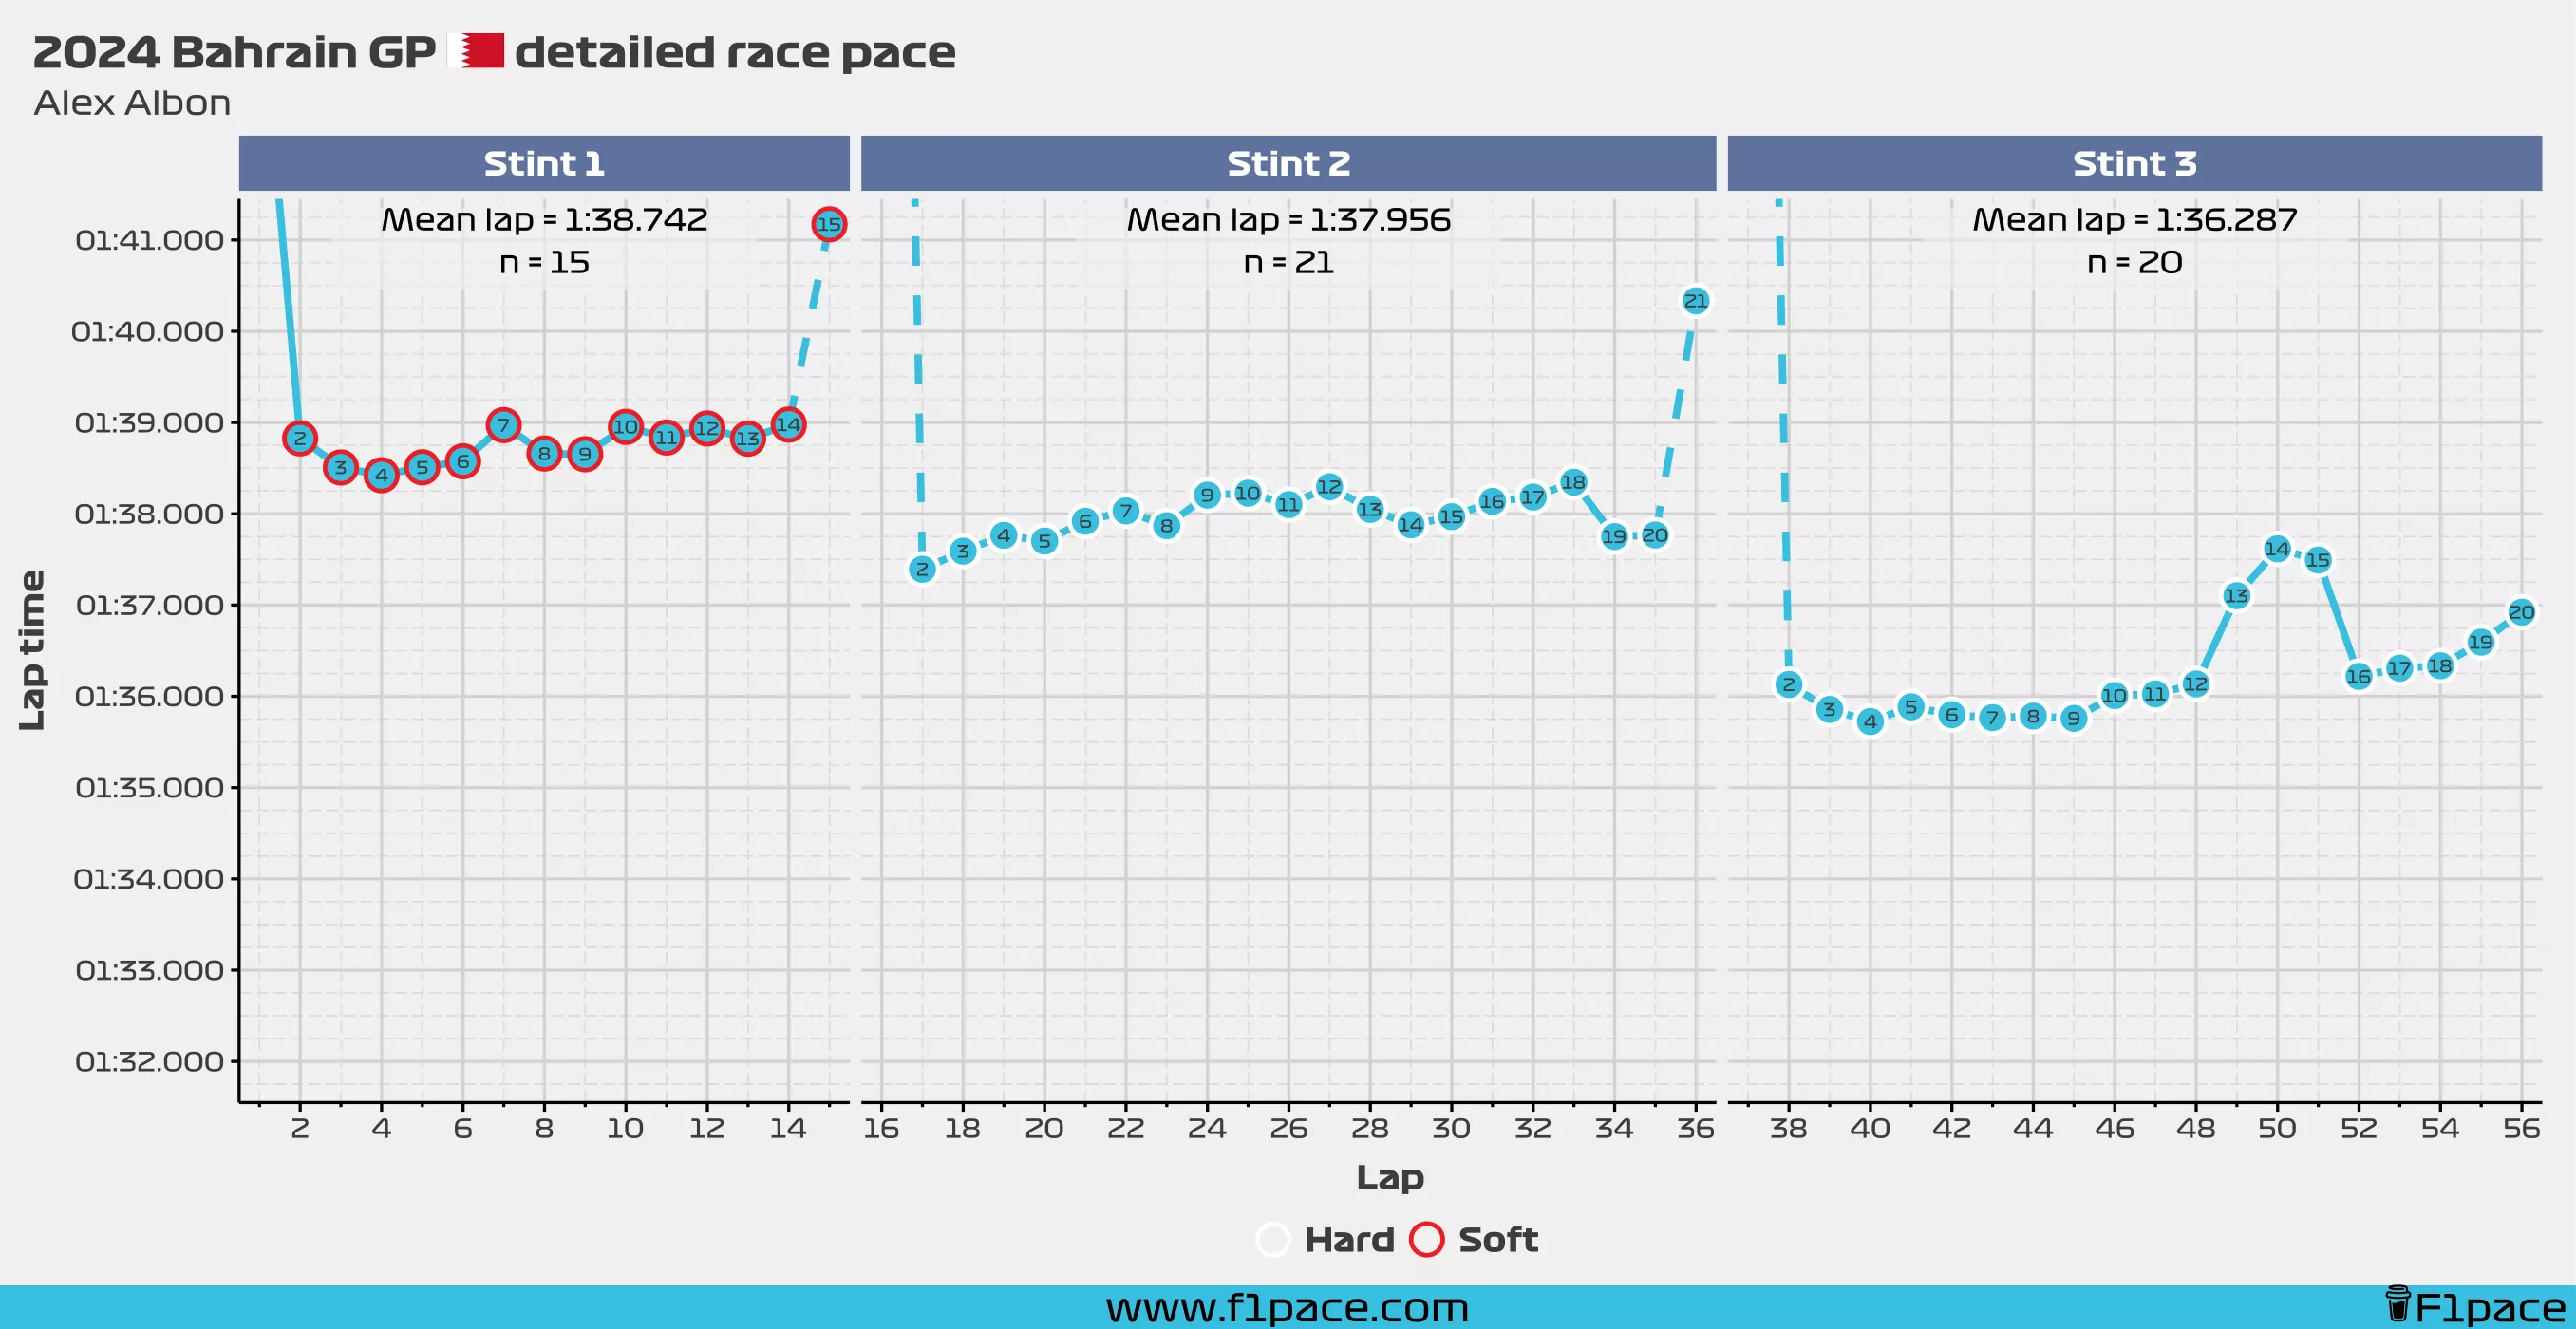
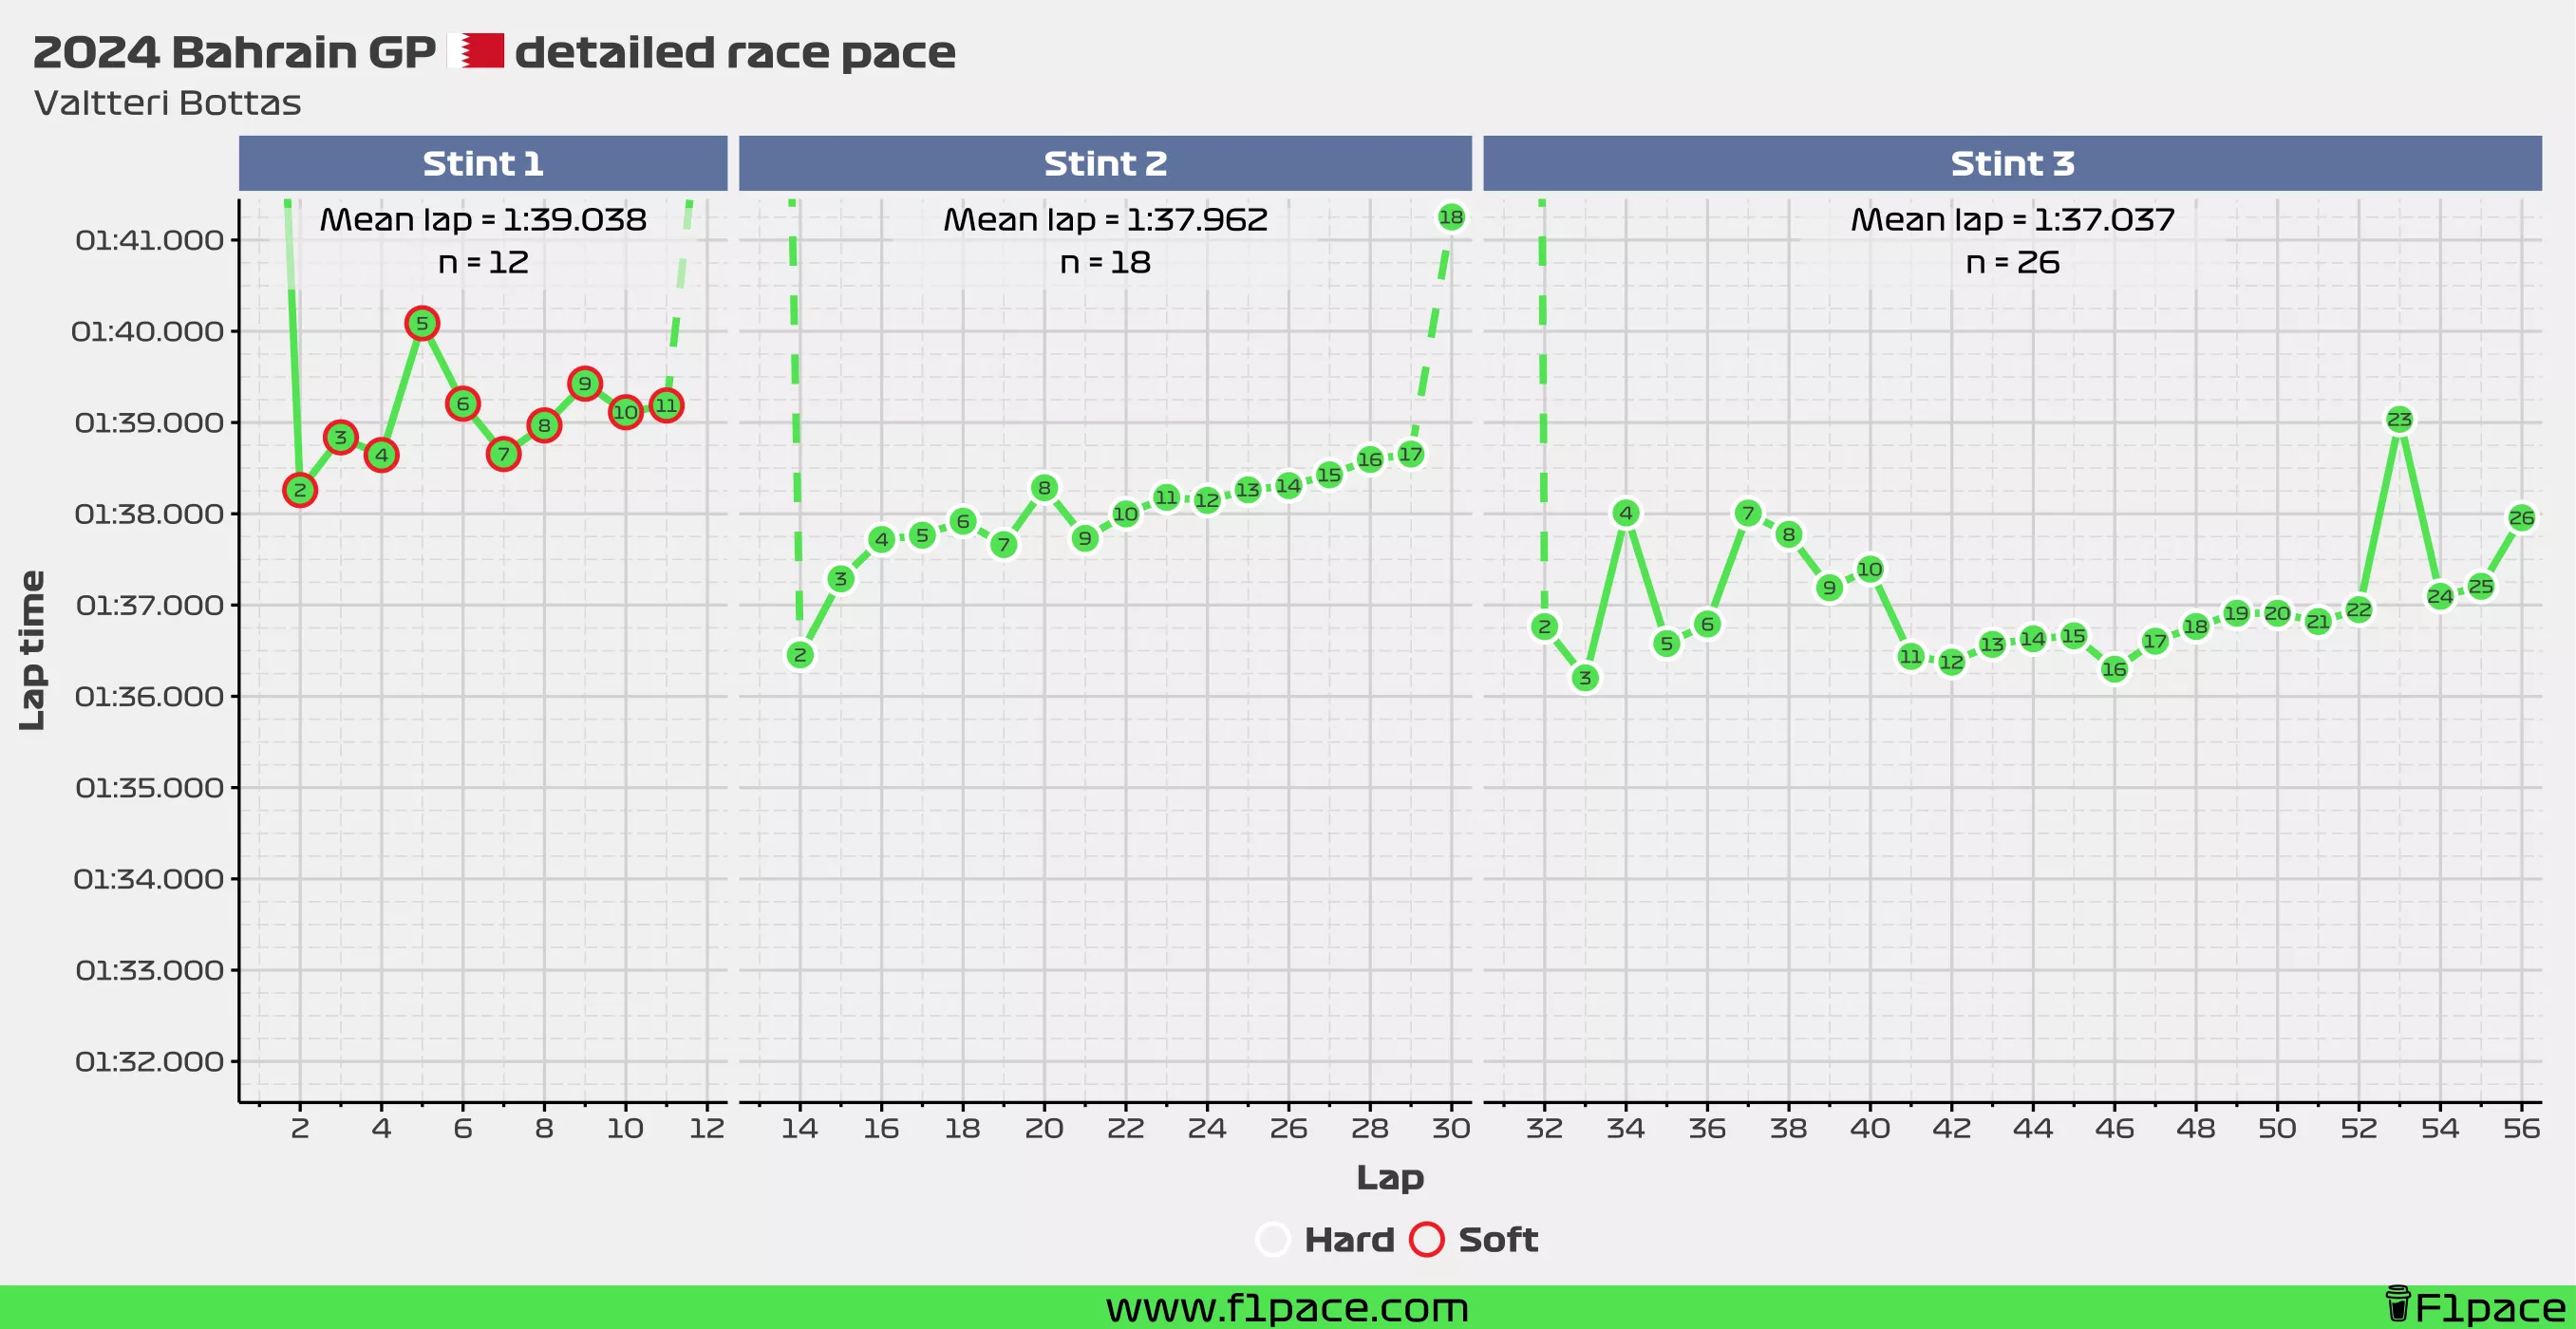
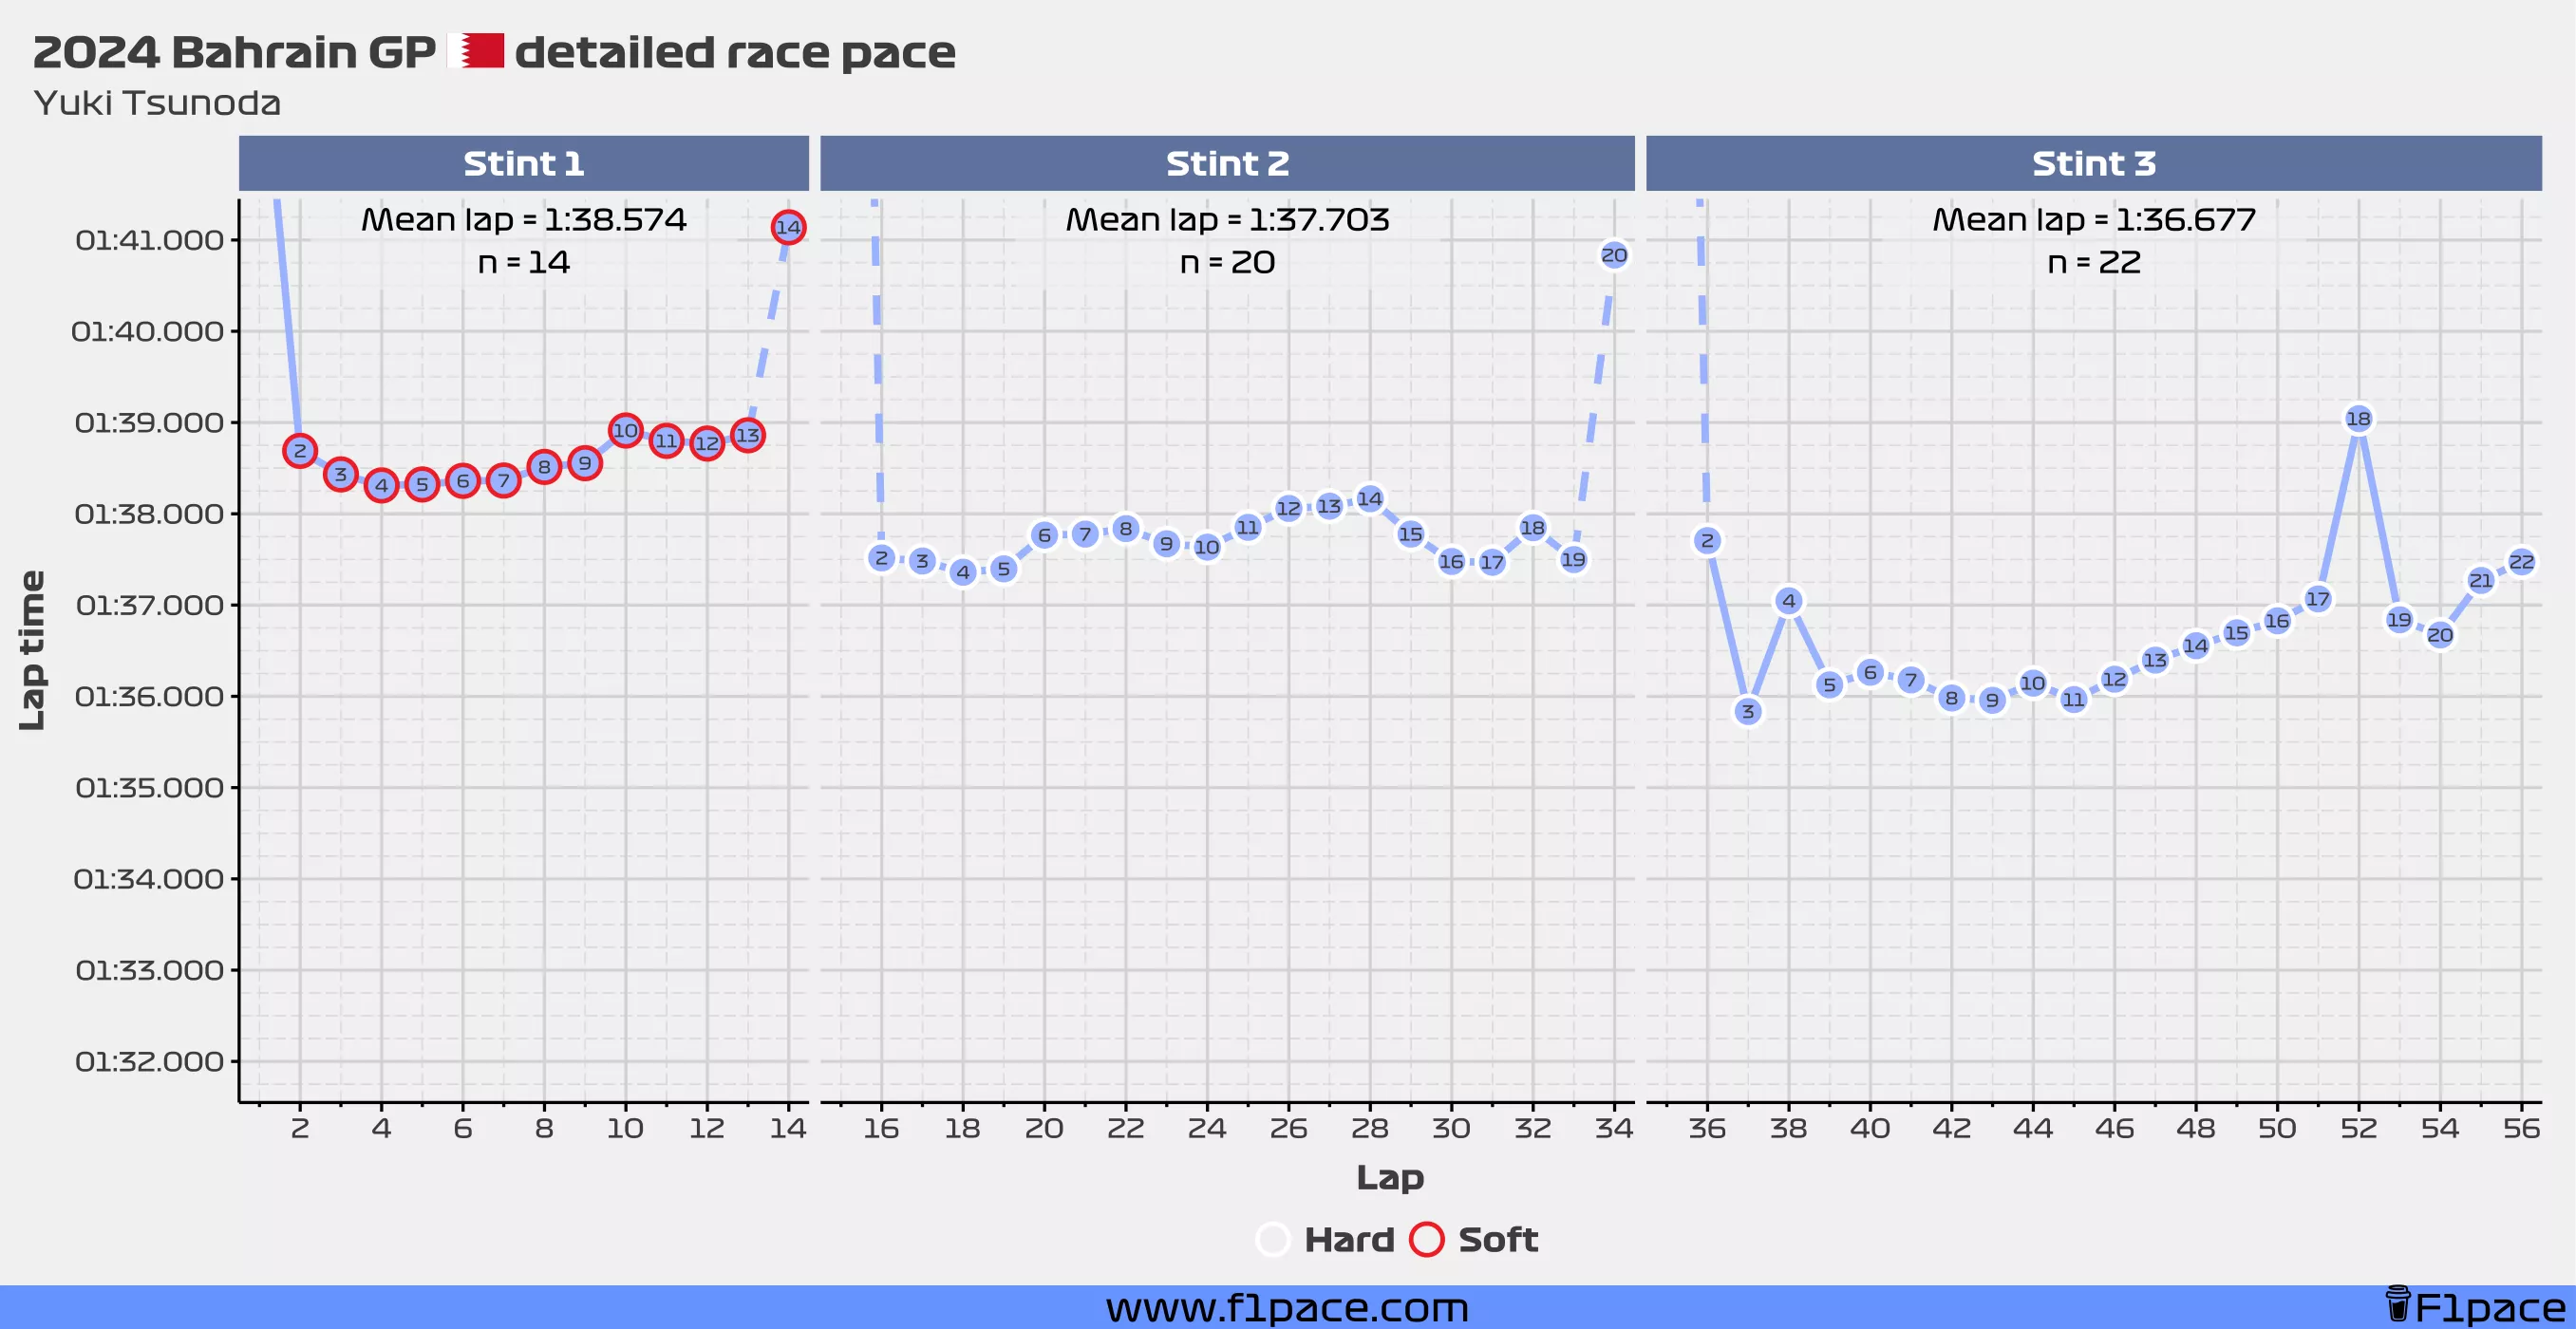
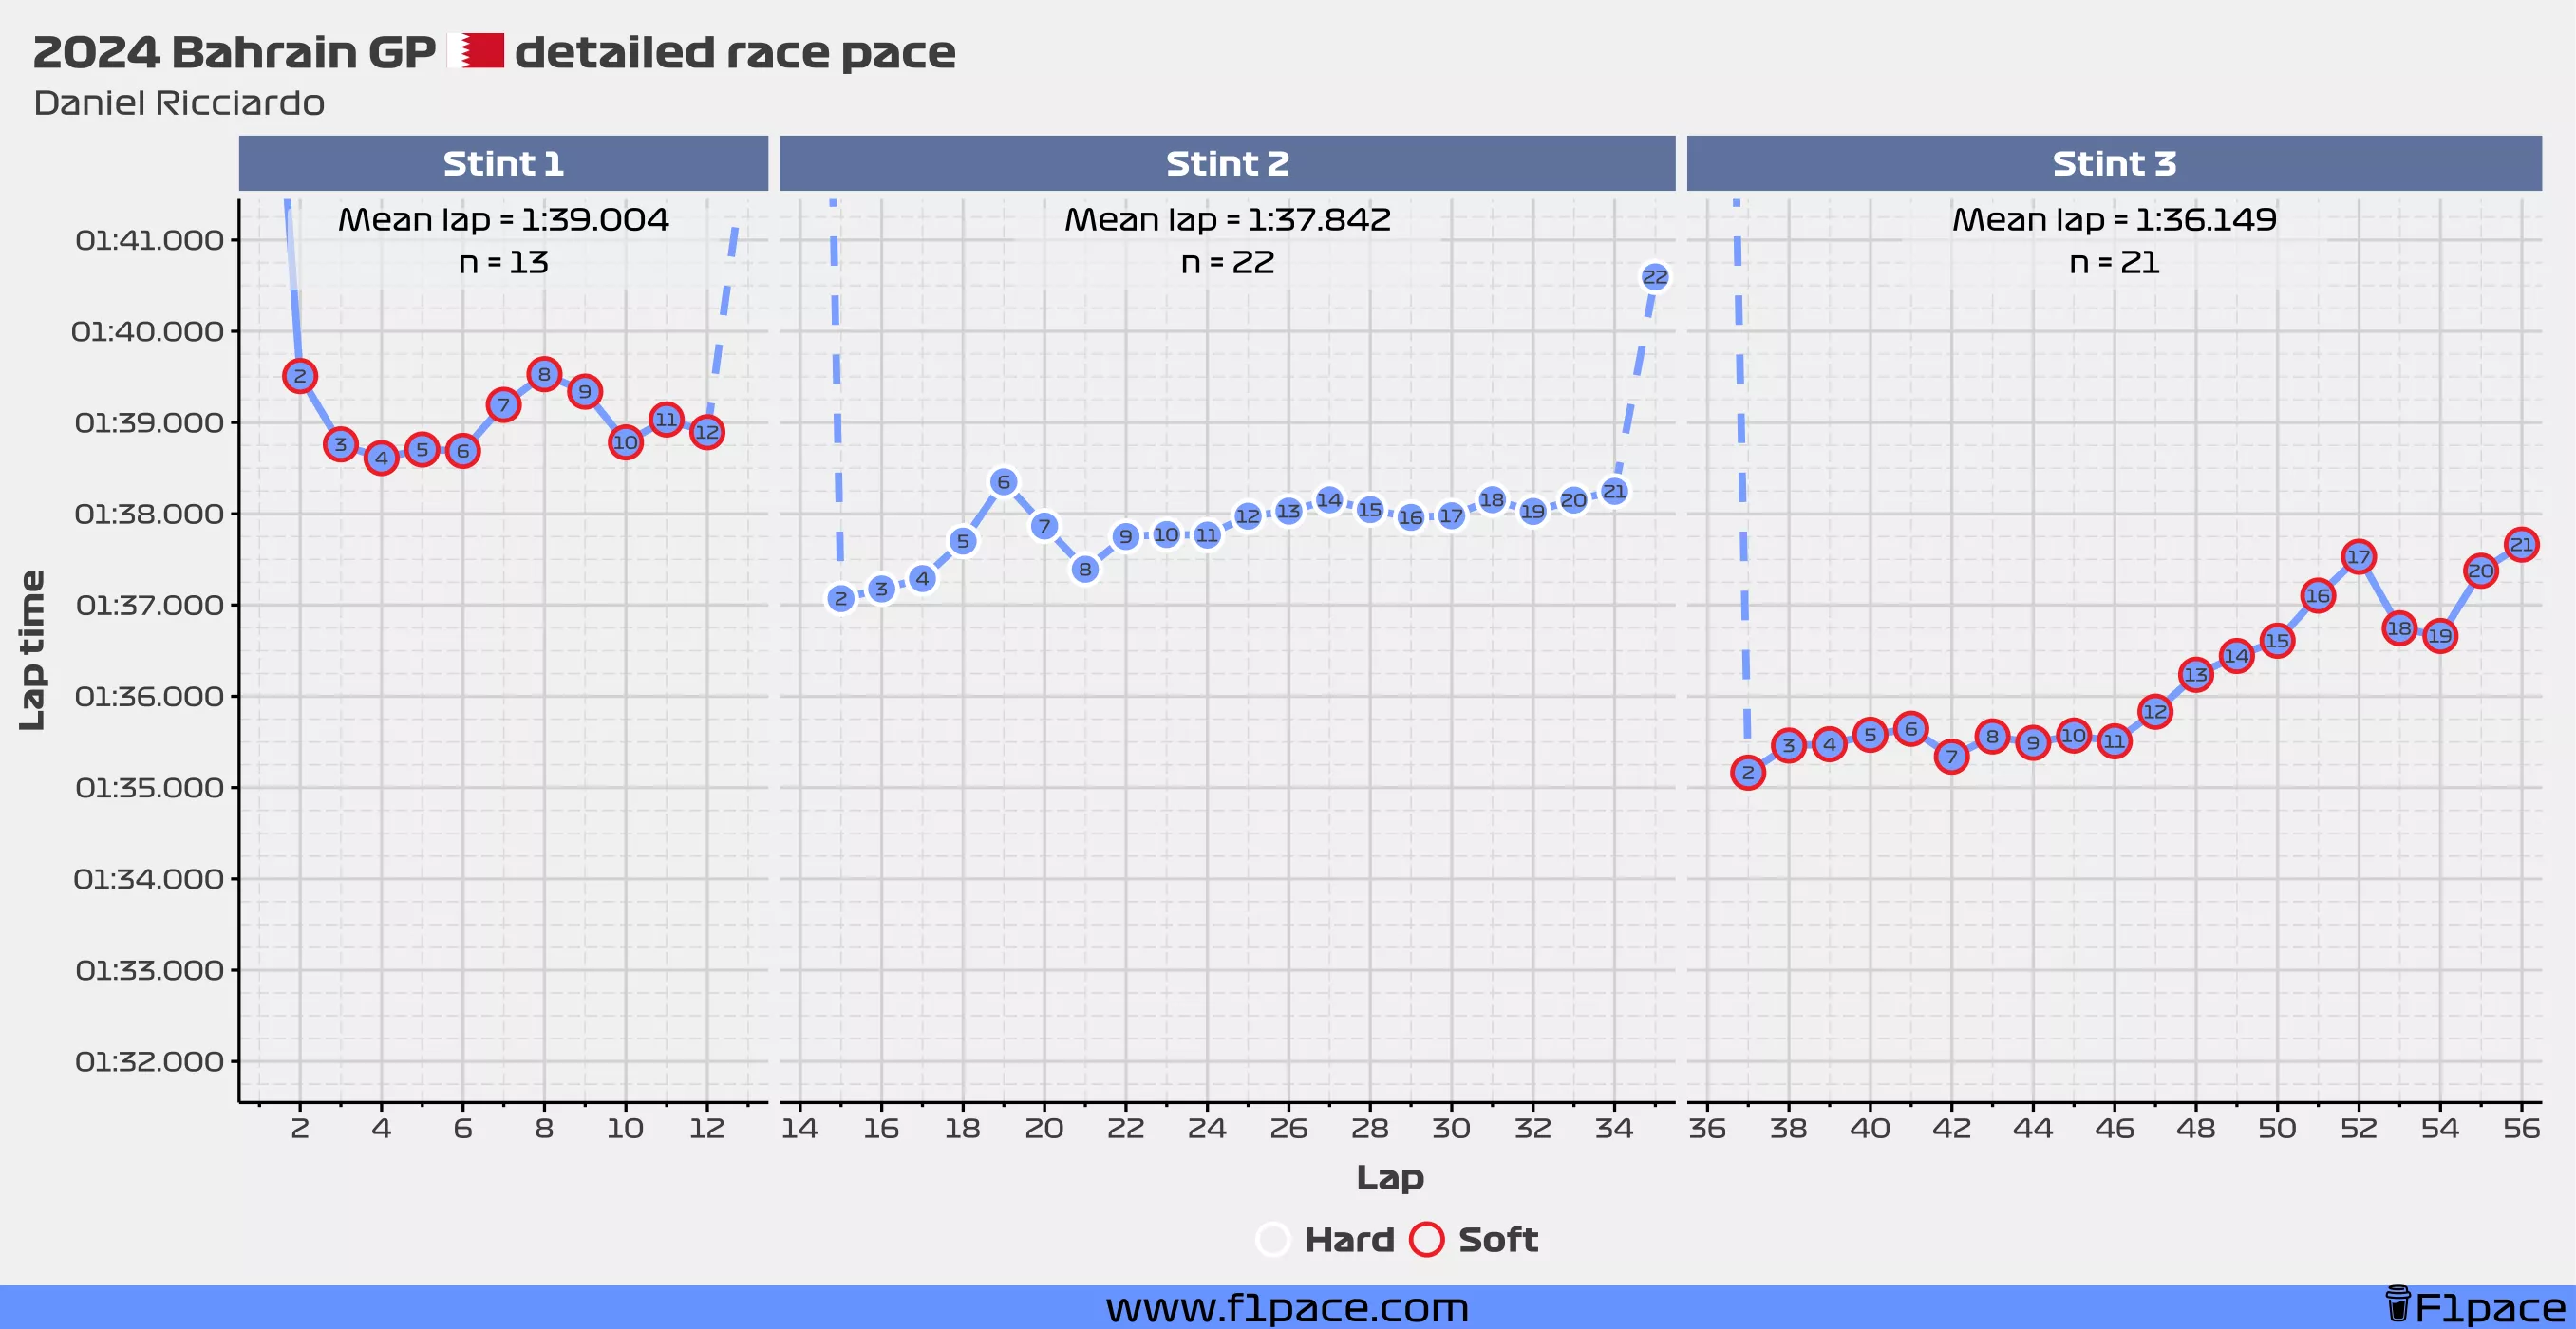
These are like the charts that I created for the pre-season testing and the FP2 sessions in 2024. Unlike the FP2 charts, for the time being these charts only show the actual data and don’t have any predicted data from a statistical model. Still, I think the charts are quite informative. Hopefully you guys will like them.
For these particular plots I decided to show laps with a maximum time of 1:41.000. While this may be a problem for drivers with very slow lap times, I believe it’s a good compromise between showing all of the data and having a readable chart.
Red Bull
Mercedes
Ferrari
McLaren
Aston Martin
Alpine
Williams
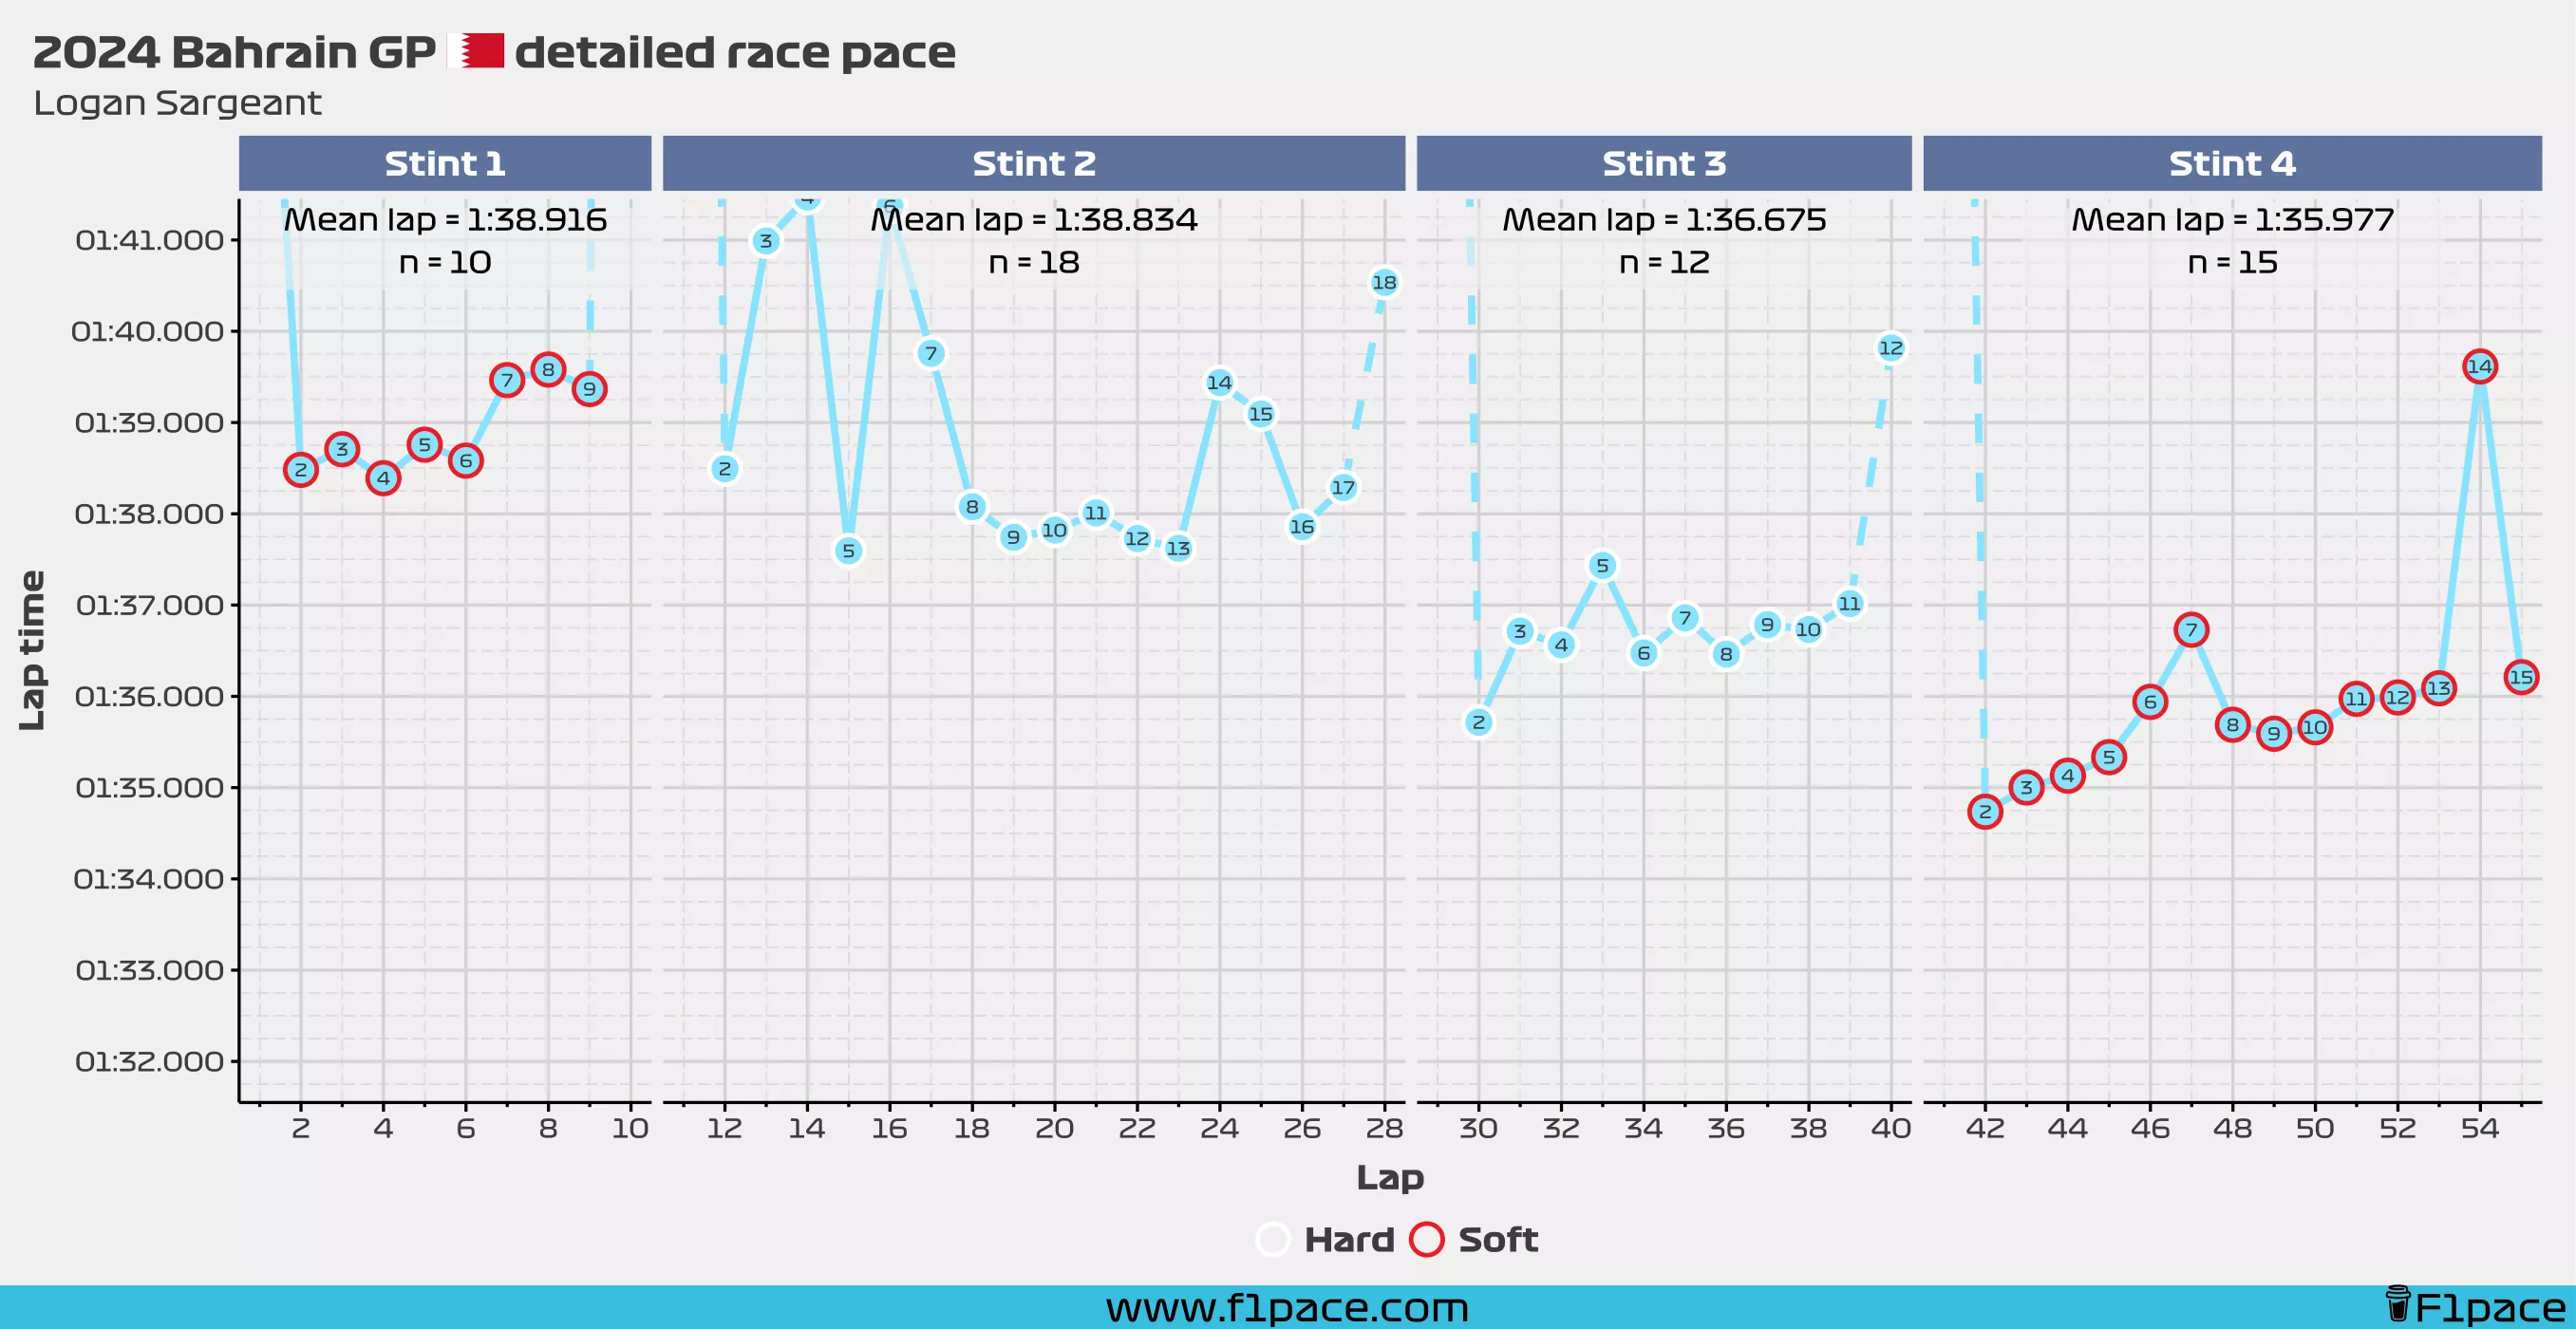
Sauber
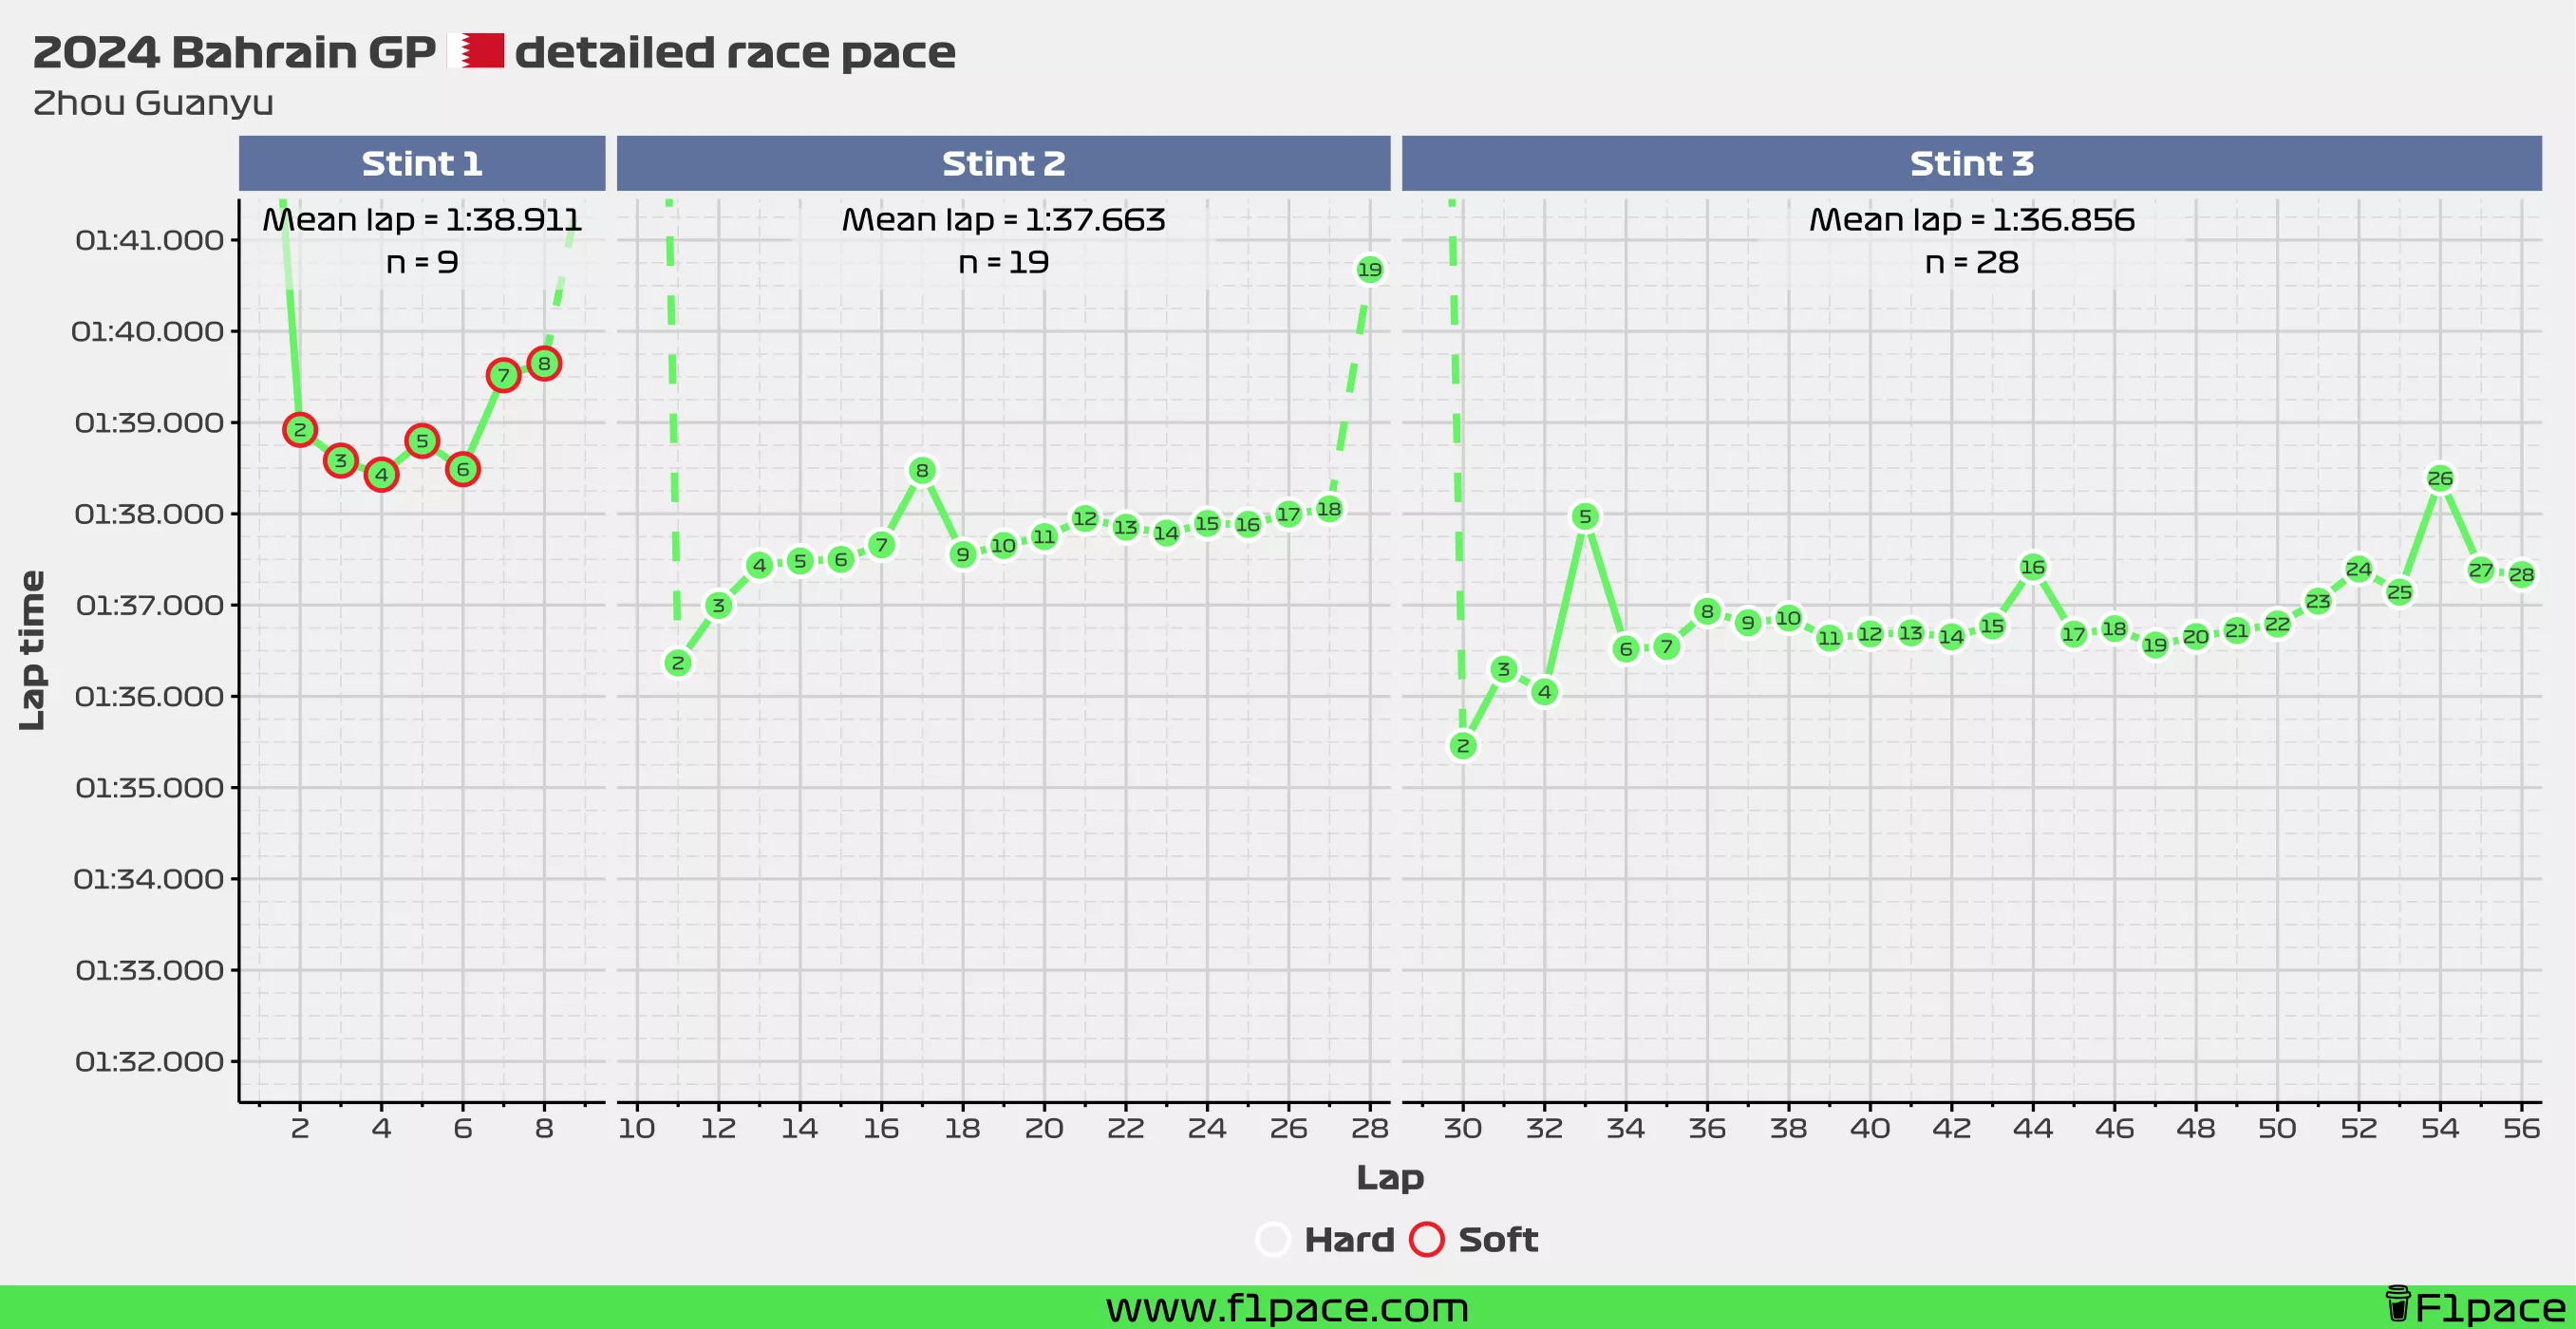
RB F1 Team
Haas
