One of the reasons I rarely write about qualifying is because, well, it’s harder to analyze than it looks. Sure, you can do a simple head-to-head comparison in a table, but getting meaningful insights takes a lot more work. In 2024, we had 30 qualifying sessions, including sprint qualifying (SQ) events — that’s a lot to keep track of! Still, I decided to take on the challenge this time, so I hope you’ll enjoy this piece.
I do my best to get accurate data, but mistakes can happen. Analyzing data from the entire season is never easy! I’m hoping nothing is wrong here, but if there is, then … oops?
Quali delta between teammates (symmetric percent difference)
As with race pace, we can’t directly compare qualifying pace between races. Different tracks, lengths, and deltas make it tricky. To handle this, I standardized the data using a metric called symmetric percent difference. Without getting too technical, it’s a more robust way of calculating percent differences — hence why I chose it.
I calculated the symmetric percent difference for all qualifying sessions between teammates, keeping only the maximum session where both drivers participated. For example, if George Russell made it to Q3 but his teammate only reached Q2, I used the Q2 data for the comparison. If a driver couldn’t set a lap time in Q1 while their teammate did, I removed that session entirely. While this isn’t ideal, using equally comparable data points is crucial for a fair performance comparison.
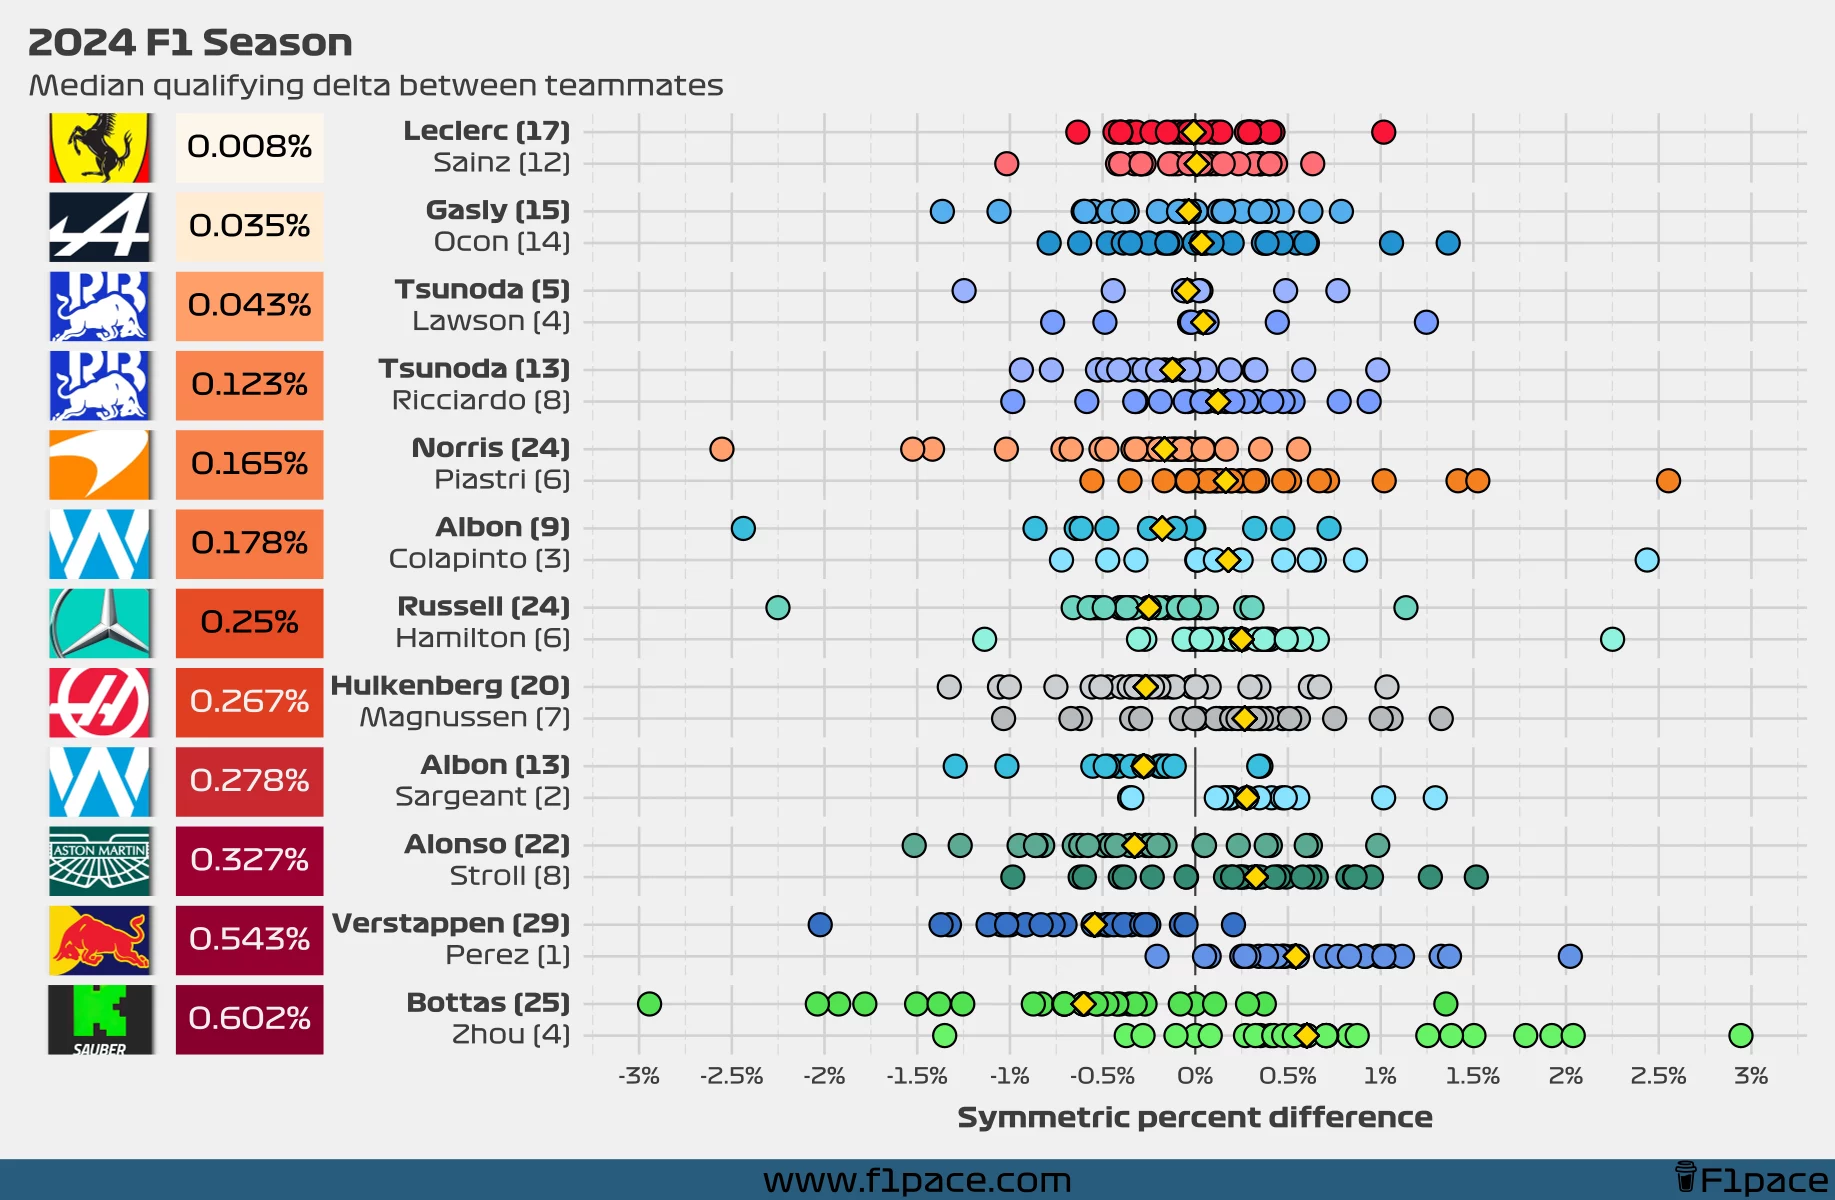
The closest qualifying battle of the season came at Ferrari, where Charles Leclerc outpaced Carlos Sainz by just 0.008%. Alpine had the tightest head-to-head in terms of qualifying victories, with Gasly edging out Ocon 15-14.
RB F1 Team featured two of the next closest gaps: Tsunoda narrowly beat Lawson 5-4 with a median gap of 0.043%, while Ricciardo outqualified Lawson 13-8 with a median difference of 0.123%.
On the opposite end, Sauber saw the biggest performance gap, with Valtteri Bottas leading Zhou Guanyu 25-4, showing a median percent difference of 0.602%. Red Bull wasn’t far behind, with Verstappen defeating Perez 29-1, though with a slightly smaller gap of 0.543%.
Rolling median quali delta between teammates (symmetric percent difference)
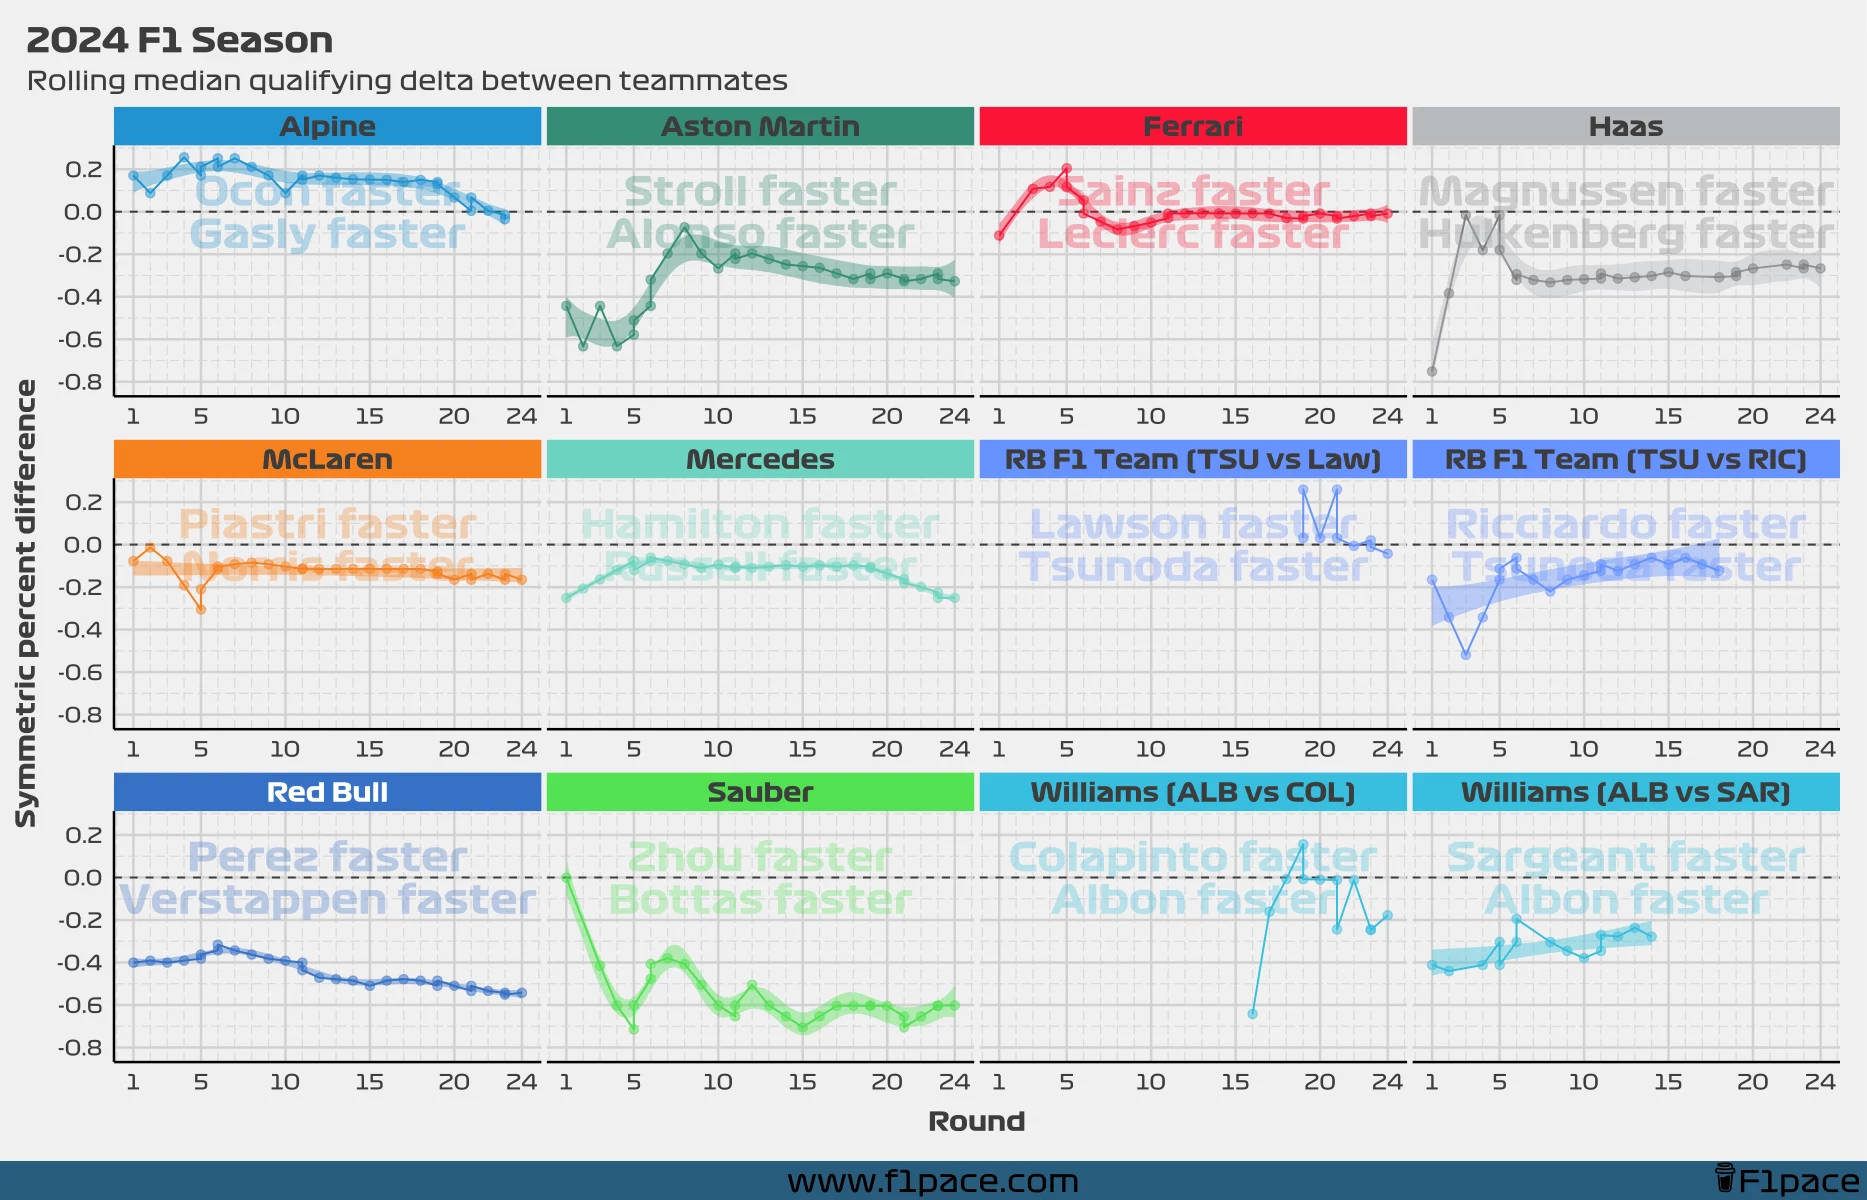
Another interesting perspective is how the qualifying delta evolved over the season. To track this, I used a rolling median, meaning I calculated the performance gap incrementally after each race. This helps visualize whether a driver got faster or slower compared to their teammate as the season progressed.
In most cases, the driver who started ahead in the qualifying battle maintained the lead through the season. However, there were notable exceptions. At Alpine, Ocon led the head-to-head battle for most of the year but lost the lead in the final race. Ferrari’s Sainz started the season strong, but Leclerc bounced back and held the lead until the end.
At RB F1 Team, Tsunoda dominated Ricciardo early on, but the gap narrowed as the season progressed. Against Lawson, Yuki initially trailed but turned things around by season’s end. At Williams, Albon struggled in the first few races against rookie Colapinto but eventually found his pace and emerged as the stronger qualifier.
Qualifying Stage Appearances
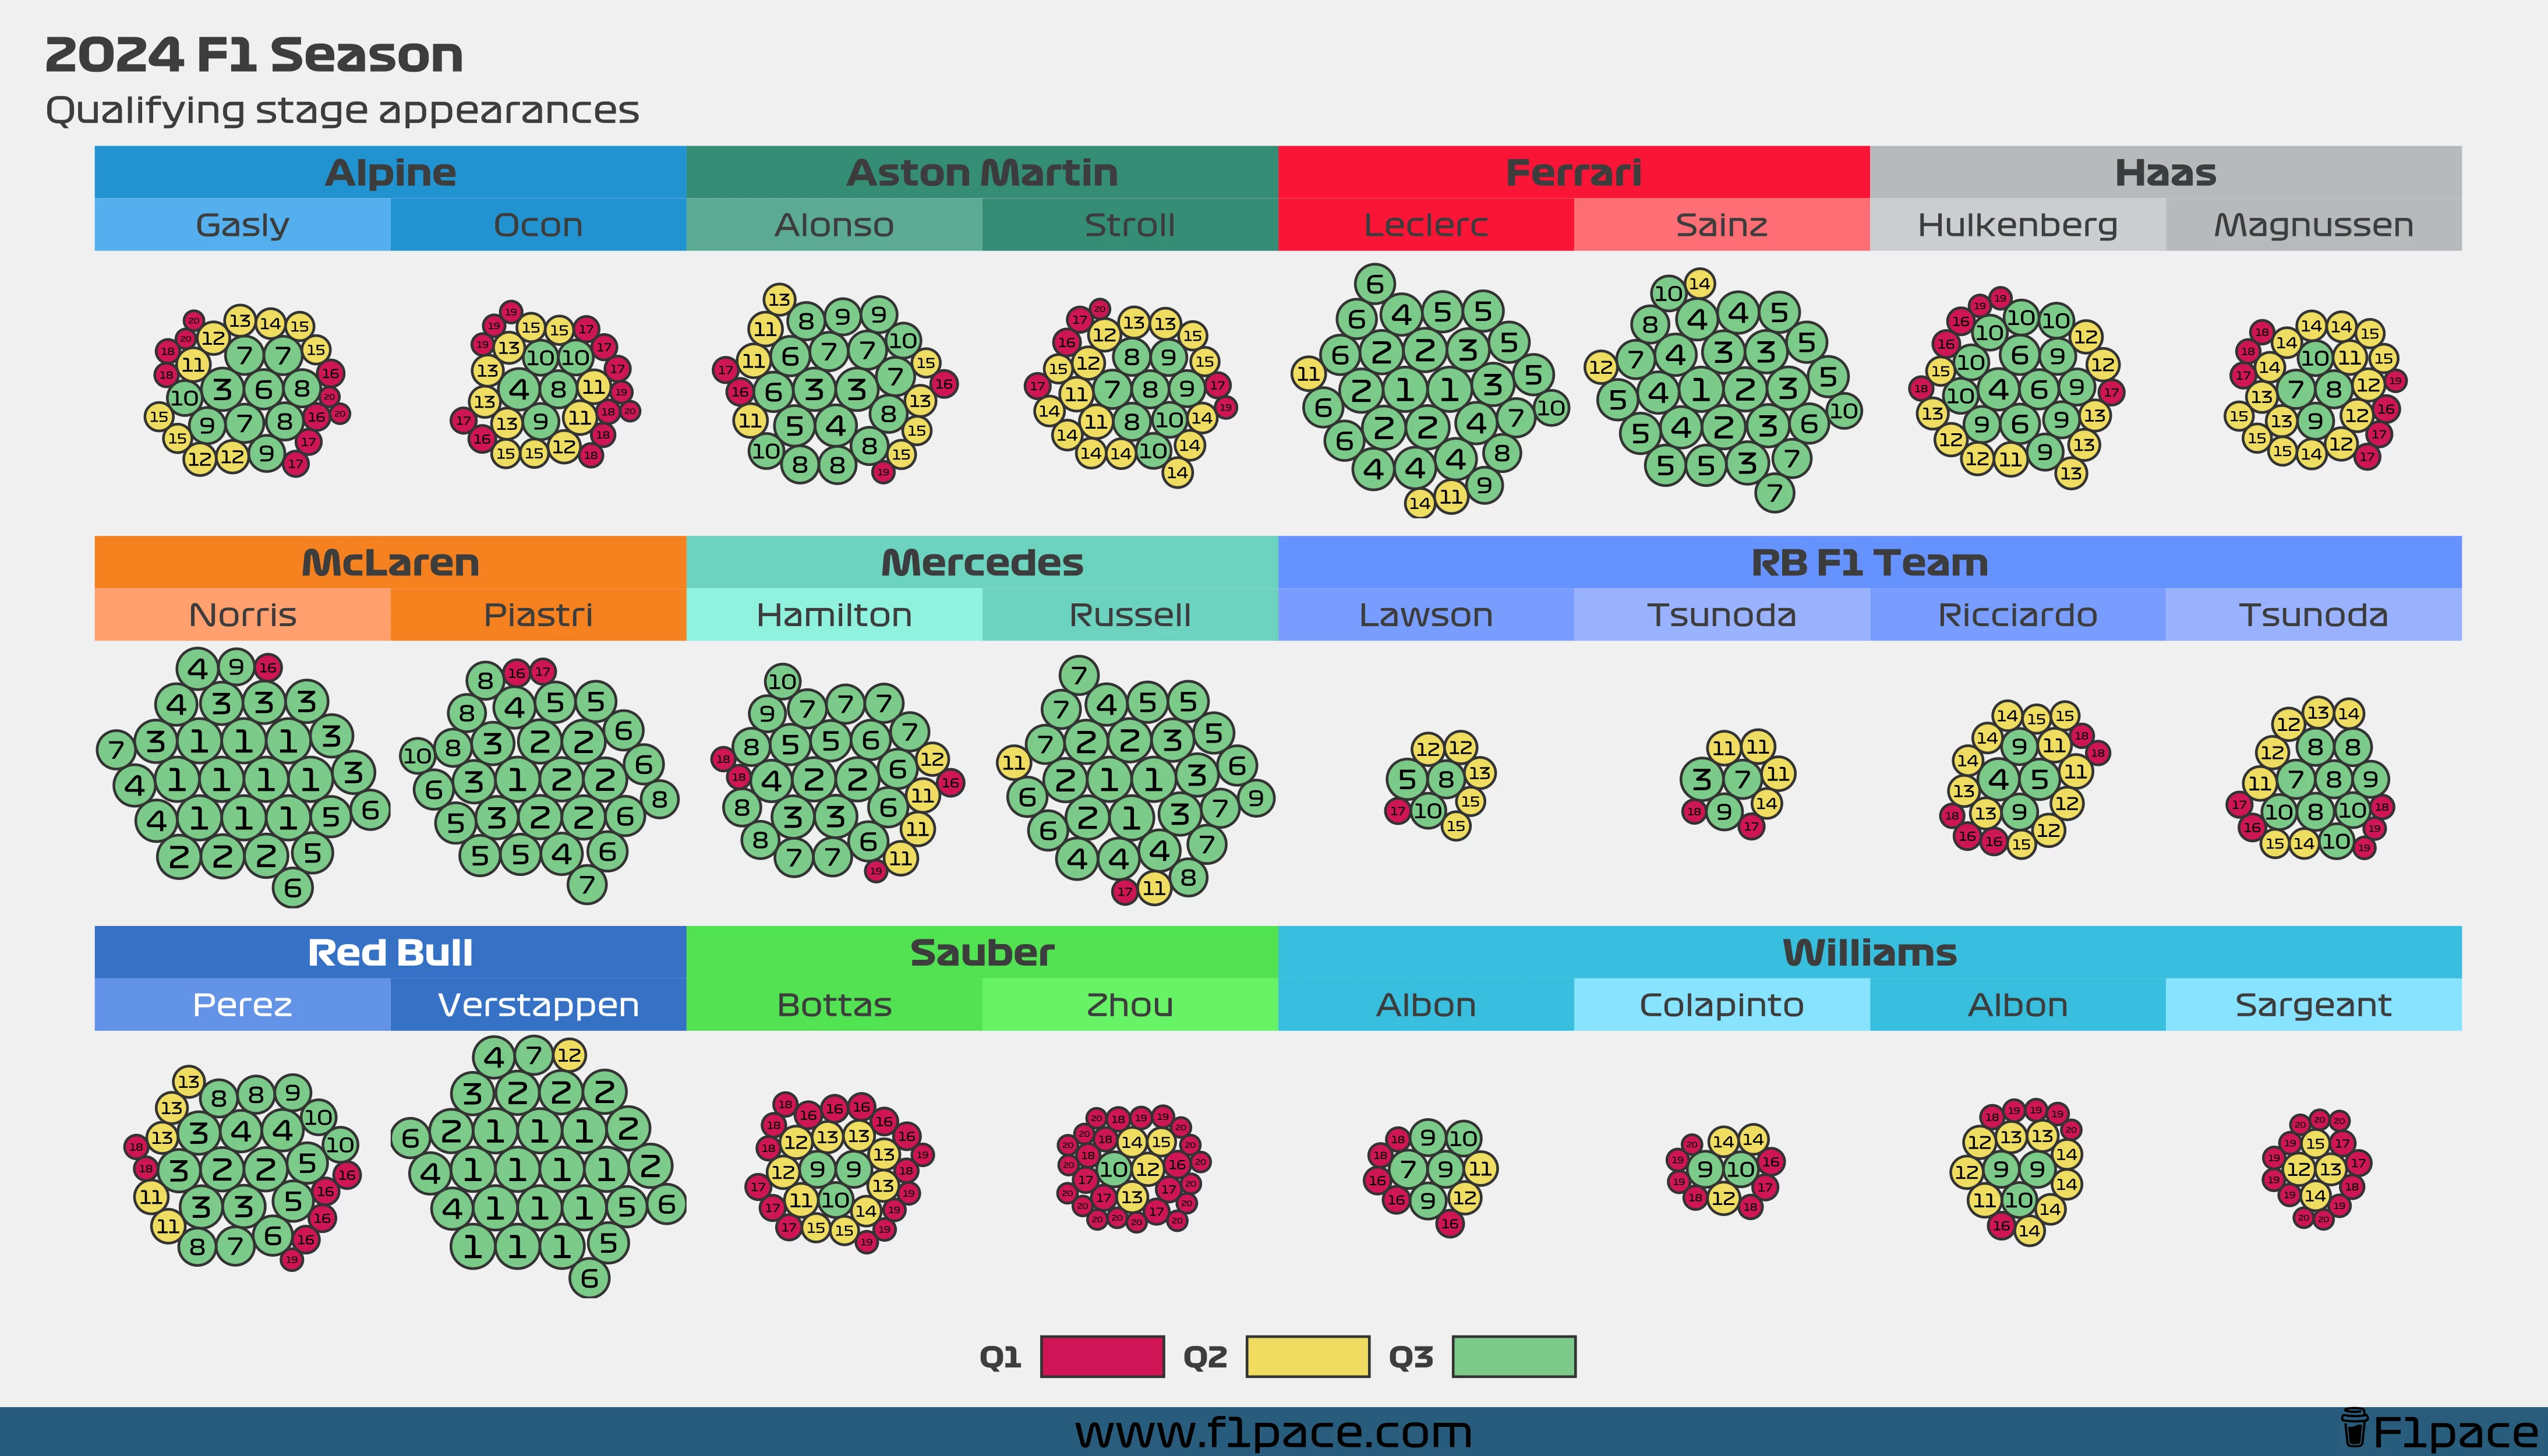
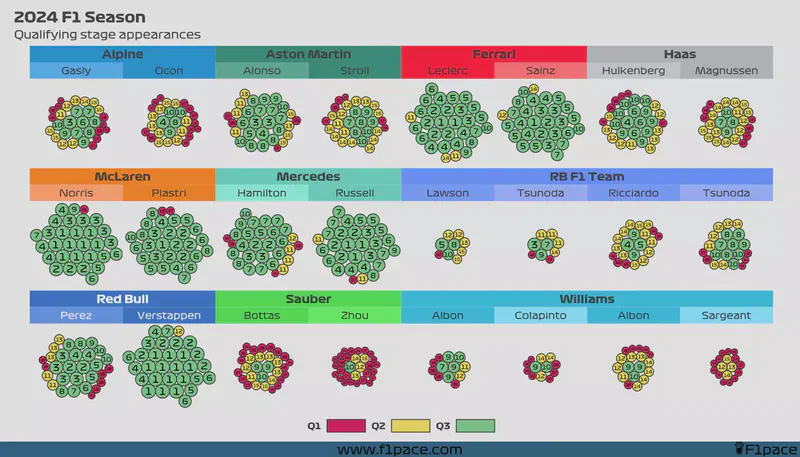
This chart was exported in very high resolution. If the text appears a bit too small, feel free to zoom in to see each individual bubble more clearly.
I’ve often seen tables showing how many times drivers reached Q1, Q2, and Q3, but I’ve never been fully satisfied with them. Tables tend to have too much text while still missing key insights. To address this, I created a bubble chart.
Each bubble represents a driver’s qualifying or sprint qualifying appearance throughout the 2024 F1 season. The bubble’s size reflects the driver’s final qualifying position, with larger bubbles indicating better results. The actual position is displayed as a big number inside the bubble, and the colors indicate the qualifying session reached.
No driver managed to qualify for all Q3 sessions this season. Max Verstappen came the closest, missing Q3 just once at the São Paulo GP. Similarly, Lando Norris missed Q3 only once, getting knocked out in Q1 at the Azerbaijan GP.
Only Verstappen and Ferrari’s Carlos Sainz and Charles Leclerc managed to escape Q1 every time. On the flip side, Logan Sargeant was the only driver never to reach Q3, while Zhou Guanyu managed it only once, at his home sprint qualifying during the Chinese GP.
Qualifying positions and distribution
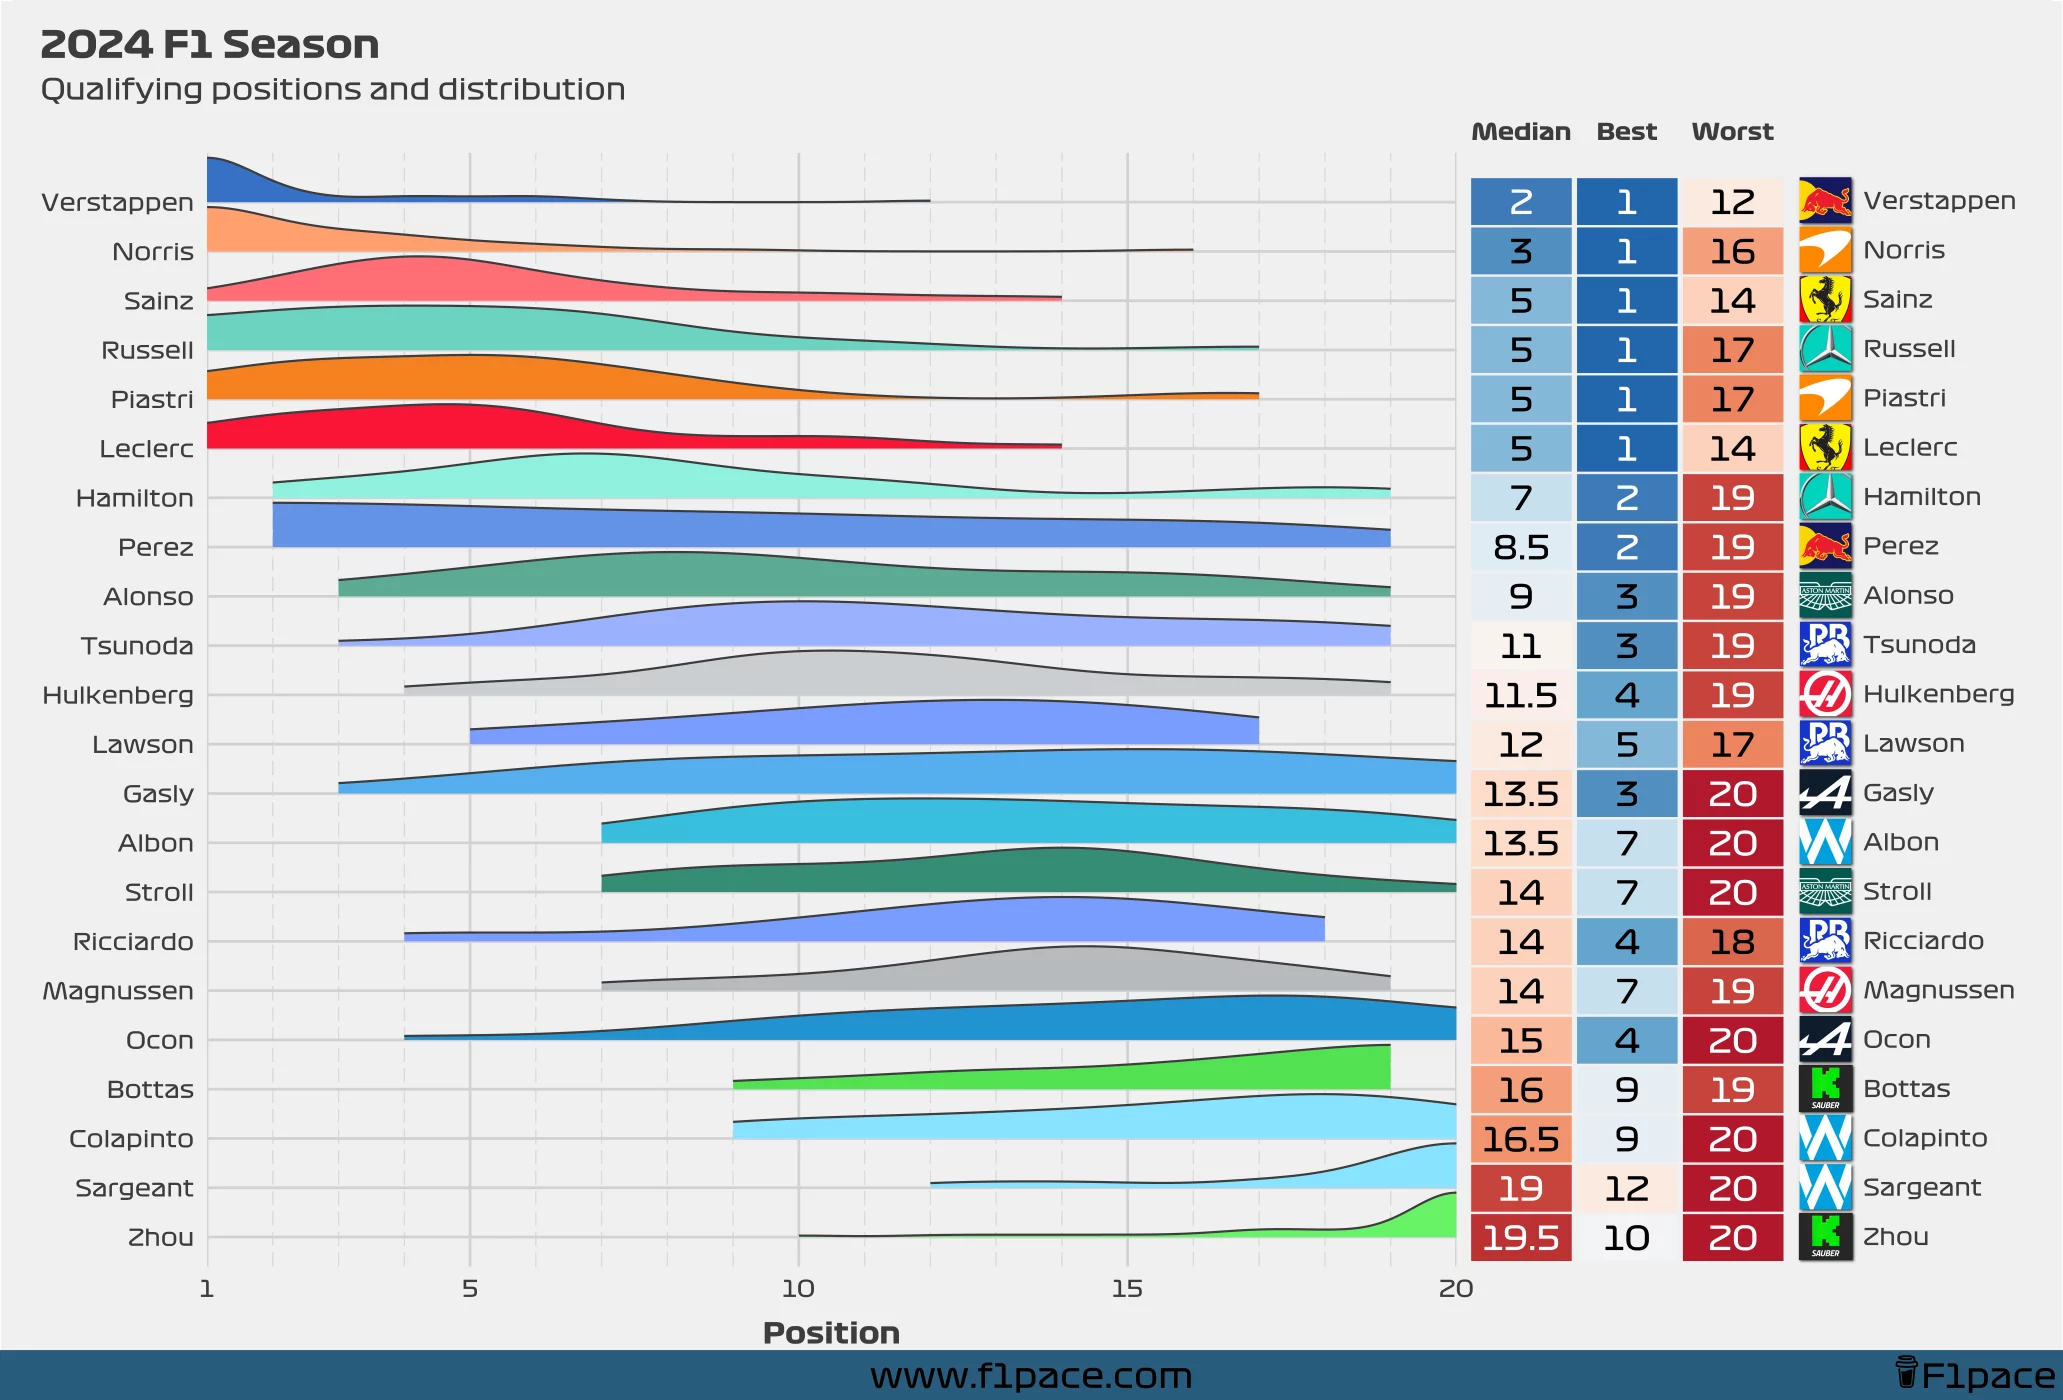
Let’s wrap things up by looking at overall qualifying positions and how they were distributed across drivers this season.
The density chart visualizes the distribution of a driver’s qualifying positions throughout the season. The chart shows how often a driver finished in each qualifying position, with thicker areas representing positions where they qualified more frequently. For example, Max Verstappen has a high density around 1st place, reflecting his multiple pole positions throughout the season. The chart also shows how often he qualified in positions like 2nd to 4th, with those areas having a slightly lower density.
Max Verstappen topped the qualifying leaderboard with a median qualifying position of 2nd place. Lando Norris followed closely with a median of 3rd, while Sainz, Russell, Piastri, and Leclerc all managed a median of 5th. However, Ferrari’s drivers had a slightly better worst position (14th) compared to Russell and Piastri (17th). Lewis Hamilton and Sergio Perez rounded out the top eight, with median positions of 7th and 8.5, respectively.
Yuki Tsunoda edged out his newly promoted teammate Liam Lawson with a median qualifying position of 11th versus 12th, though Lawson only completed part of the season. Among rookies, Franco Colapinto had a challenging year. He showed promise when he joined the team but struggled as the season progressed, finishing with a median of 16.5—just ahead of Logan Sargeant and Zhou Guanyu.
Final remarks
As with most analyses, the conclusion is clear: Max Verstappen emerged victorious in 2024. He had the best race pace, the best quali pace, and is undeniably the rightful champion.
The rest of the field also showed strong competition, with the battle in quali sessions being tight this year. Six drivers managed to take pole position, with Hamilton and Perez coming close, securing their best finish in 2nd place. Fernando Alonso and Yuki Tsunoda also came close to the top spot, both achieving a season-best result of 3rd place.
I hope you’ve enjoyed this detailed end-of-season quali analysis. If you liked what you read, feel free to share it on social media. And if you’d like to support me, you can click the “Buy Me A Coffee” button below to leave a donation. Anything is greatly appreciated!
