The pit stop crew plays a crucial role in modern F1. With the current regulations making on-track overtakes tough, strategy-driven overtakes—like the undercut or overcut—have become key to gaining positions during a race. The pit stop crews work incredibly hard, race after race, to make each pit stop as fast as possible. So, how did the crews perform this year? Let’s take a look at the numbers.
Which stops should we analyze?
One of the main challenges when analyzing pit stops is distinguishing between botched pit stops and slow stops caused by penalties or damage. What I’m really interested in is understanding which crews were the most efficient during “typical” pit stops, not the ones affected by unusual circumstances. So, how do we filter out these “atypical” pit stops for our analysis?
A few years ago, I tackled a similar analysis by using a few different anomaly detection algorithms to remove outliers. The problem with that approach is that each algorithm could give different results, and there’s no clear way to know which one is right. To me, that felt like the wrong approach.
This year, I took a different route. I looked at the cumulative distribution, which means ordering all the pit stops from fastest to slowest and then seeing where the majority of them fall.
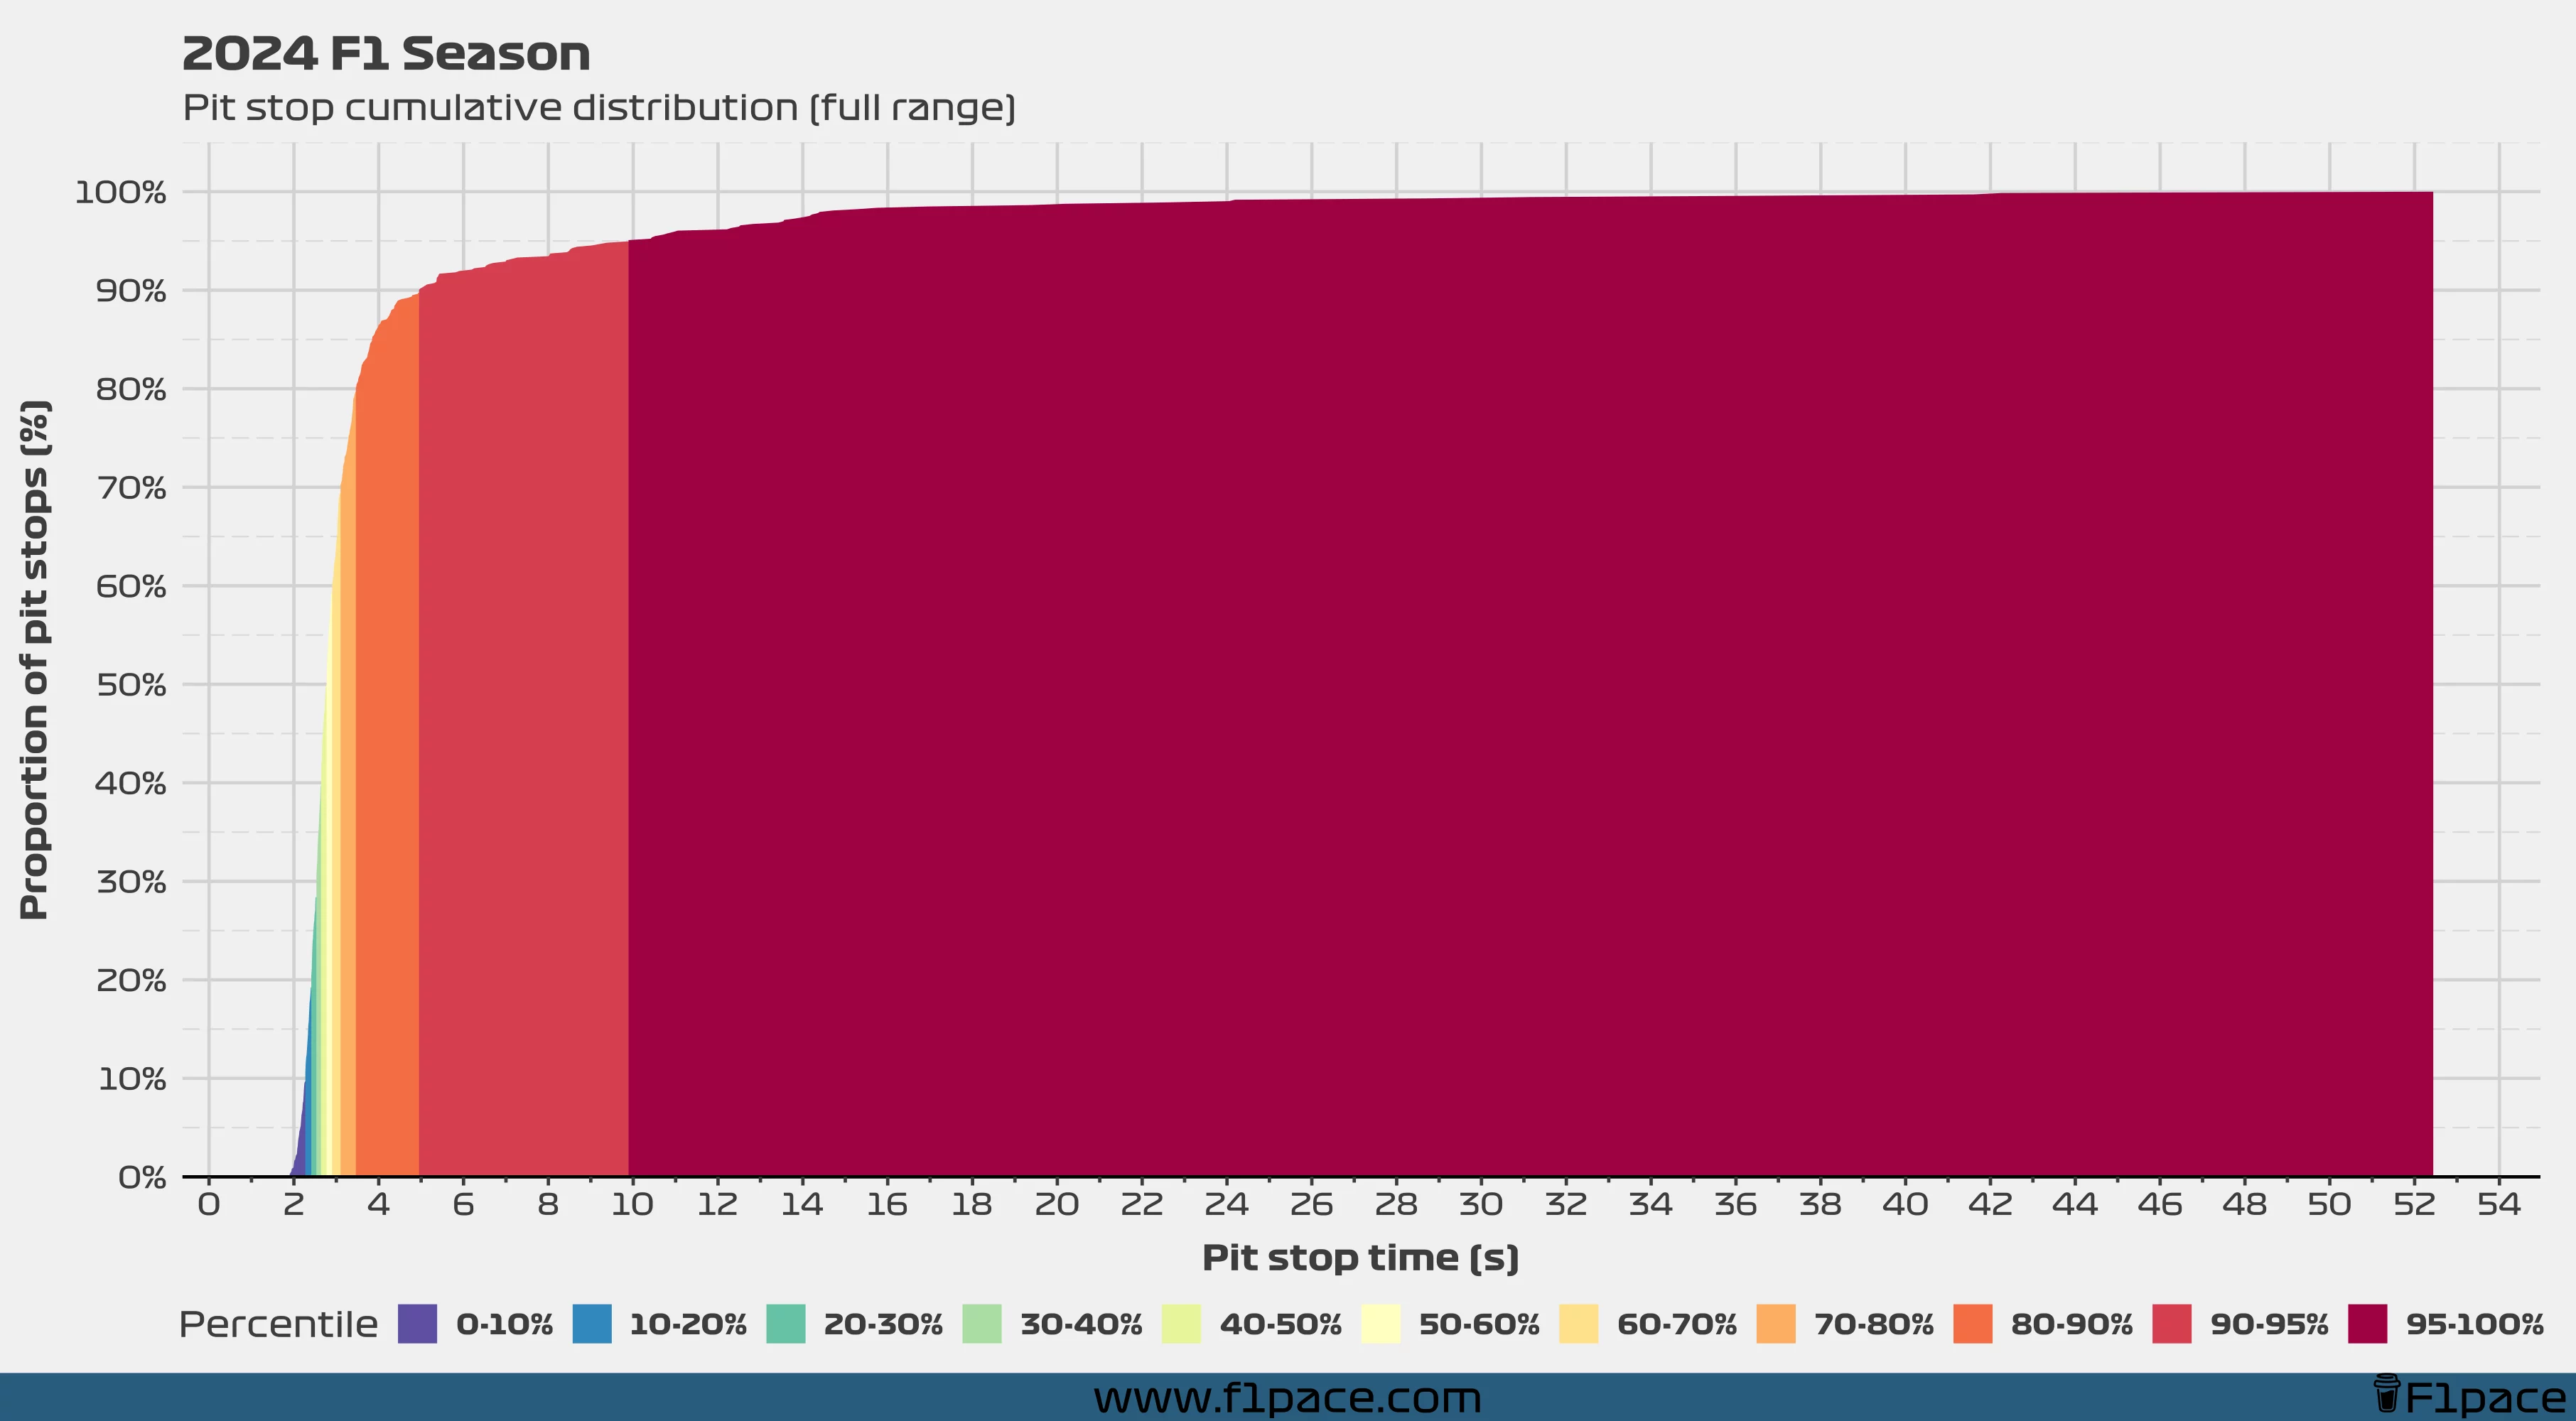
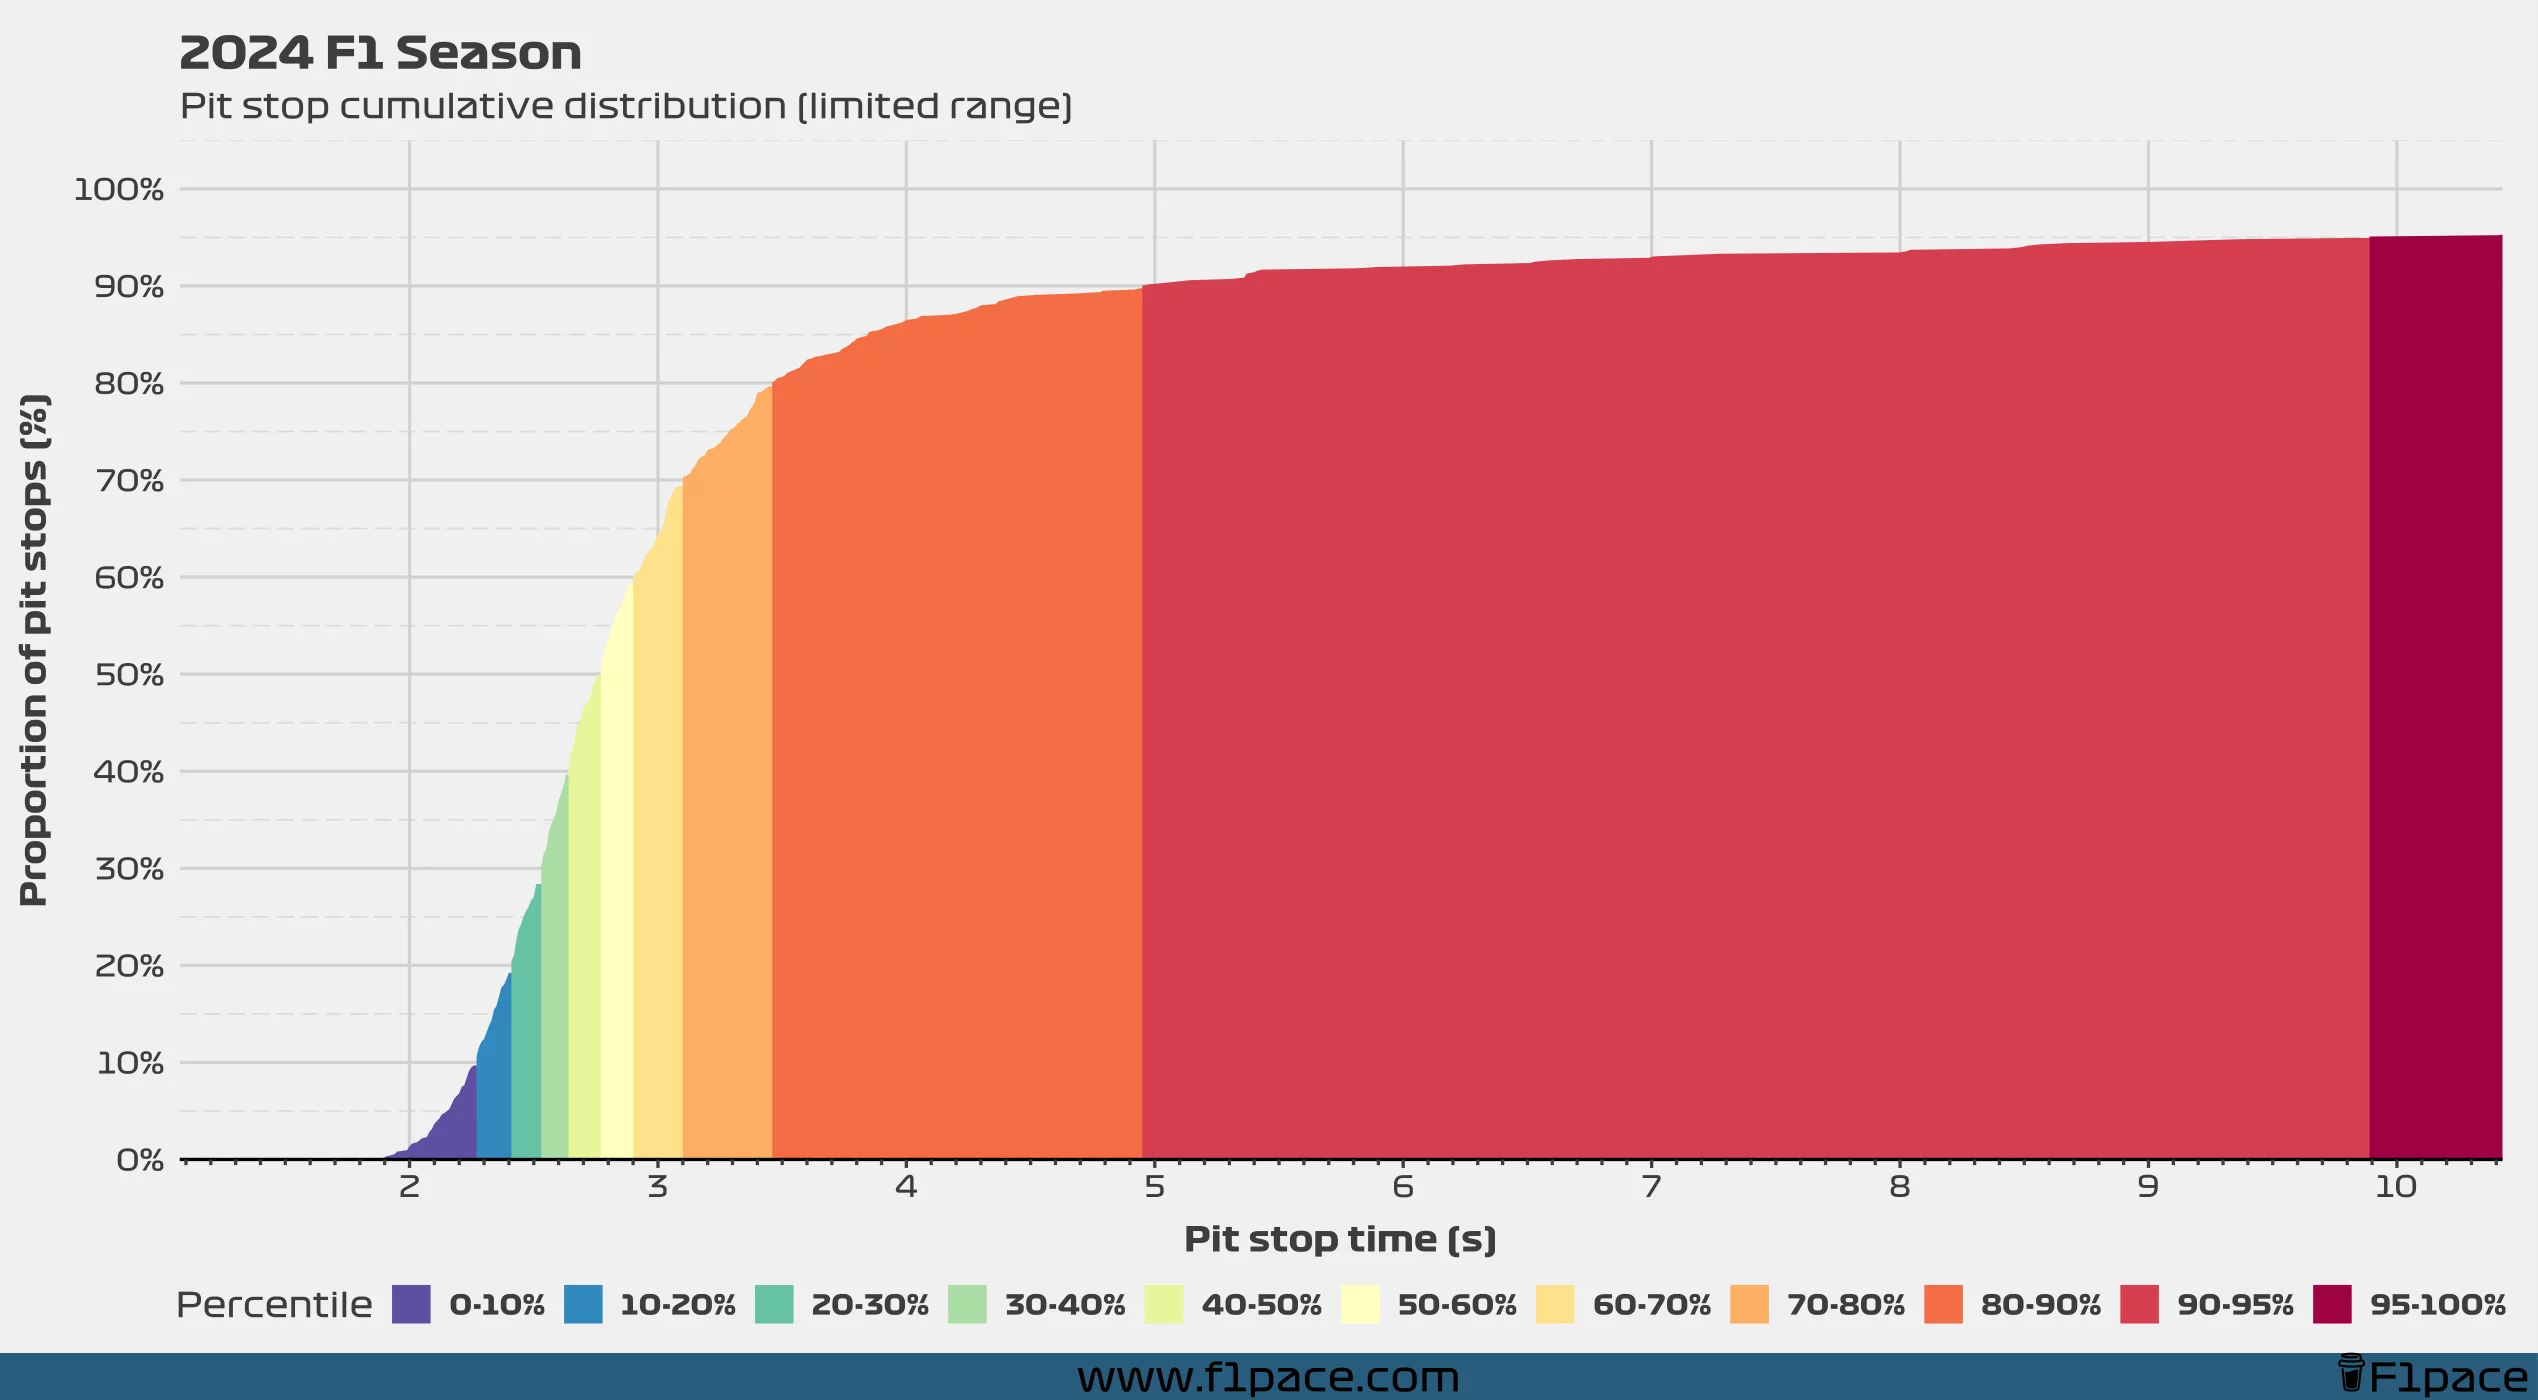
First, I looked at all the pit stops from the 2024 season, including the really slow ones. Then, I calculated percentile ranges—things like 0-10%, 10-20%, and so on. The 0-10% range represents the fastest 10% of pit stops, while the higher ranges, closer to 100%, contain the slowest stops of the season.
If we take a look at the first chart (full range), we can see that most pit stops are completed in 10 seconds or less. The final 5% of the slowest pit stops may take anywhere from 10 to 52 seconds, but these are likely due to penalties or damage.
To get a clearer view, I used a limited range chart that only shows pit stops up to around 10 seconds. Here, we can see that 90% of pit stops happen in 5 seconds or less (specifically 4.94 seconds). I decided to focus on the data up to the 90th percentile, so anything over 4.94 seconds was excluded from the following analyses.
Pit stop distribution
Percentile range
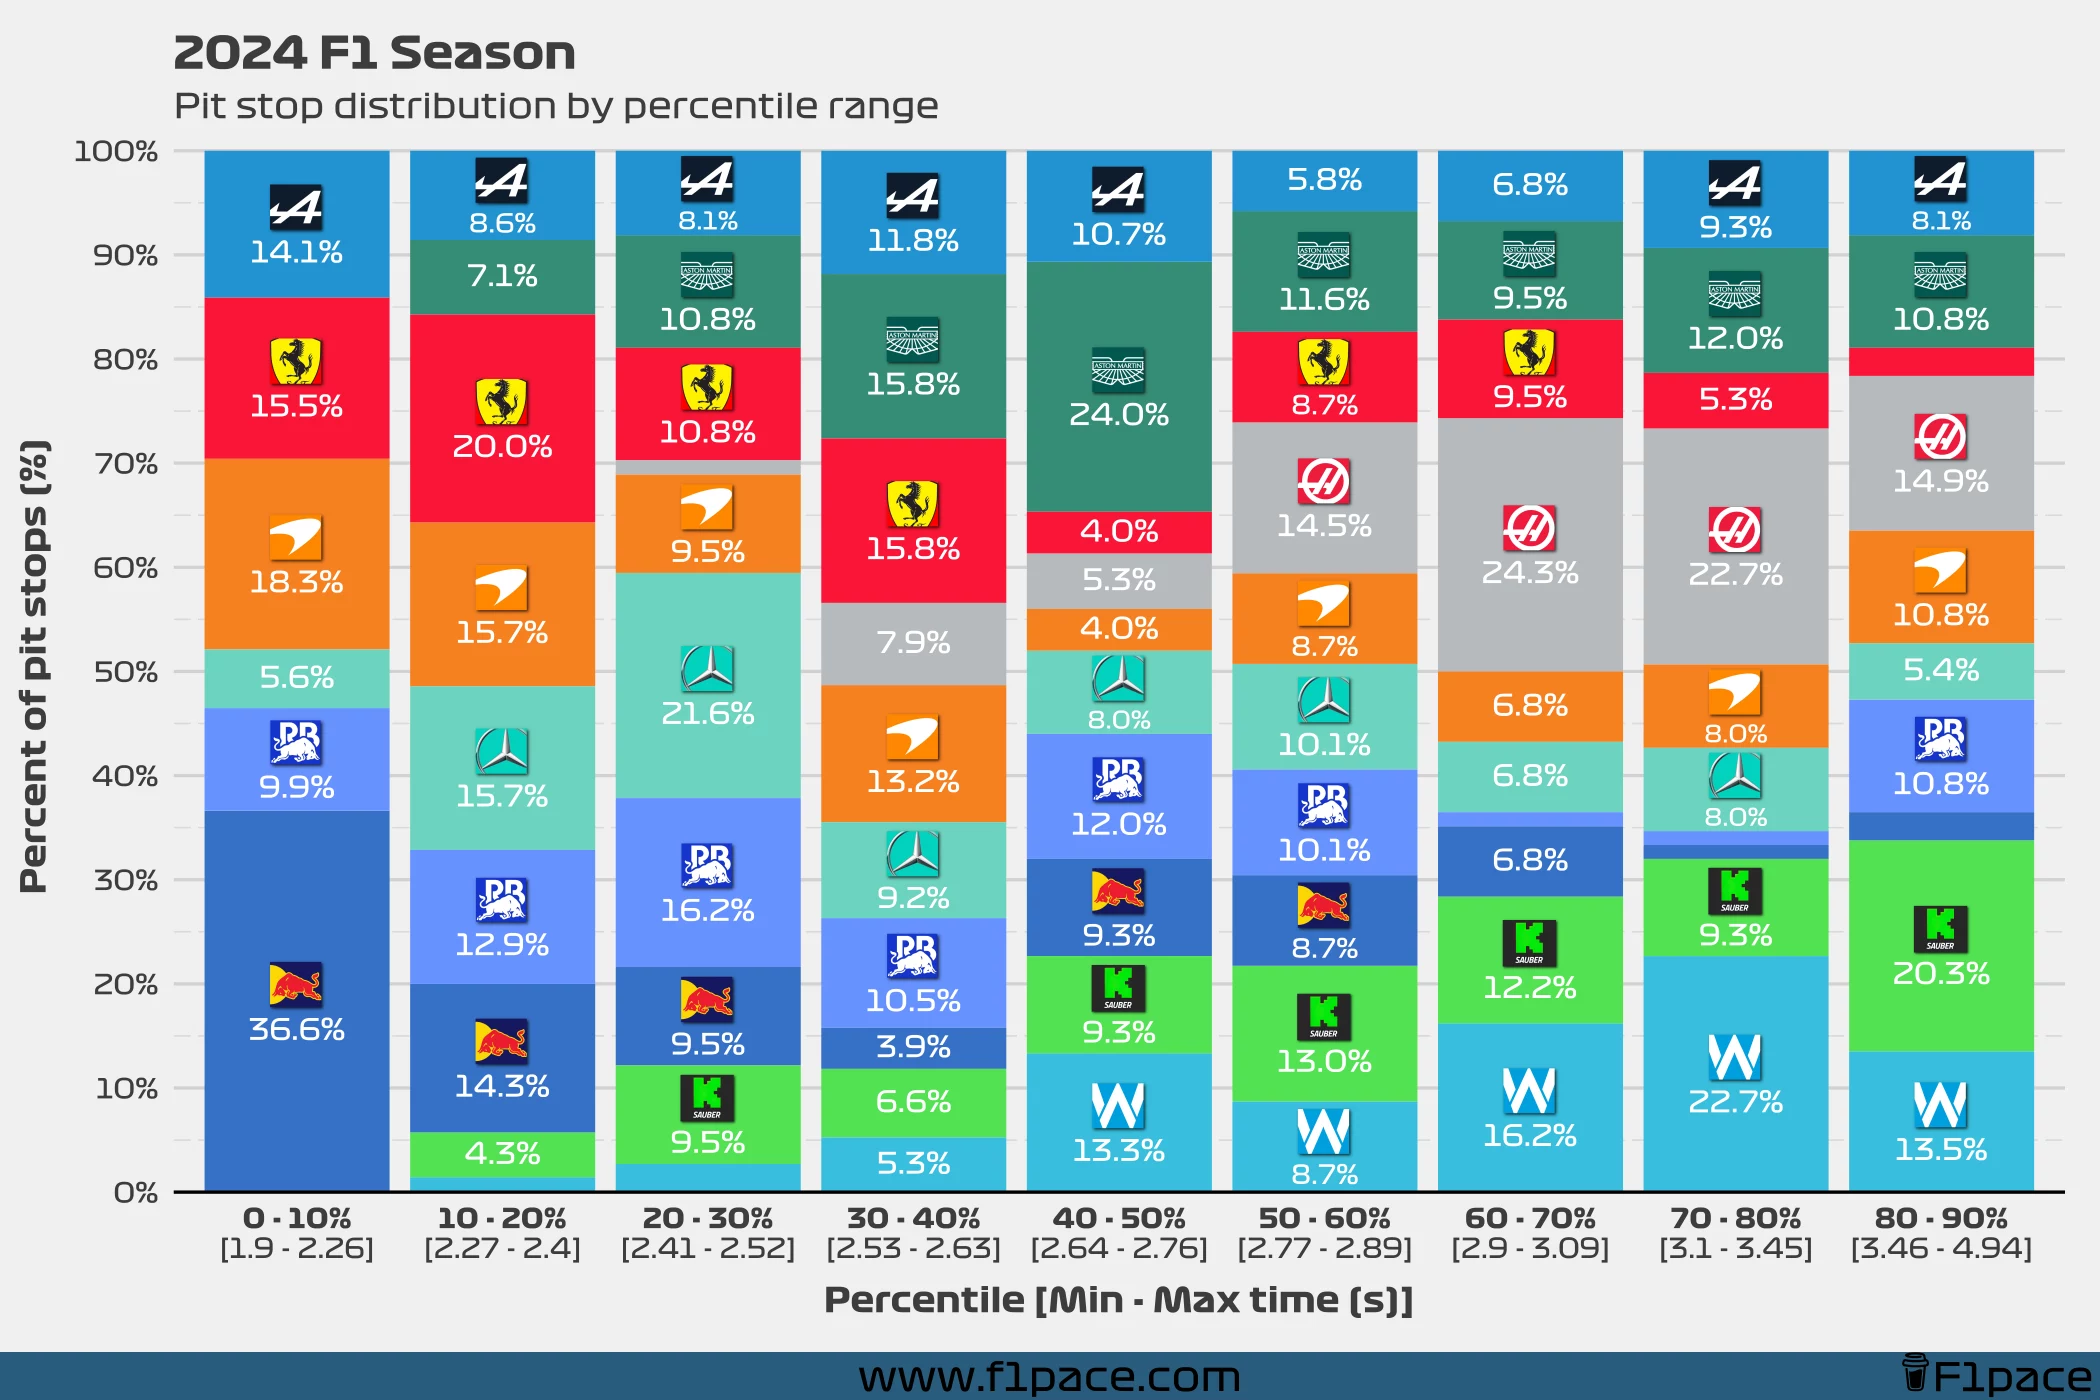
I decided to start by visualizing the data, dividing it into percentile ranges of 10%. The goal was to see which teams were more or less represented in each range, giving us a good idea of how efficient the pit crews were on average.
The results are pretty interesting. We can see that the Red Bull pit crew handled 36.6% of the pit stops in the fastest percentile range (0-10%, between 1.9 and 2.26 seconds). McLaren, Ferrari, and Alpine made up most of the rest of these fast stops, with Red Bull and Mercedes covering the final 15.5%. Neither Aston Martin, Haas, Sauber, nor Williams had any pit stops in this range.
On the opposite end, in the slowest percentile range (80-90%, 3.46 to 4.94 seconds), most of the pit stops were made by Sauber, followed by Haas and Williams. This gives us a solid idea of which teams were quicker in the pits and which ones were slower.
By team
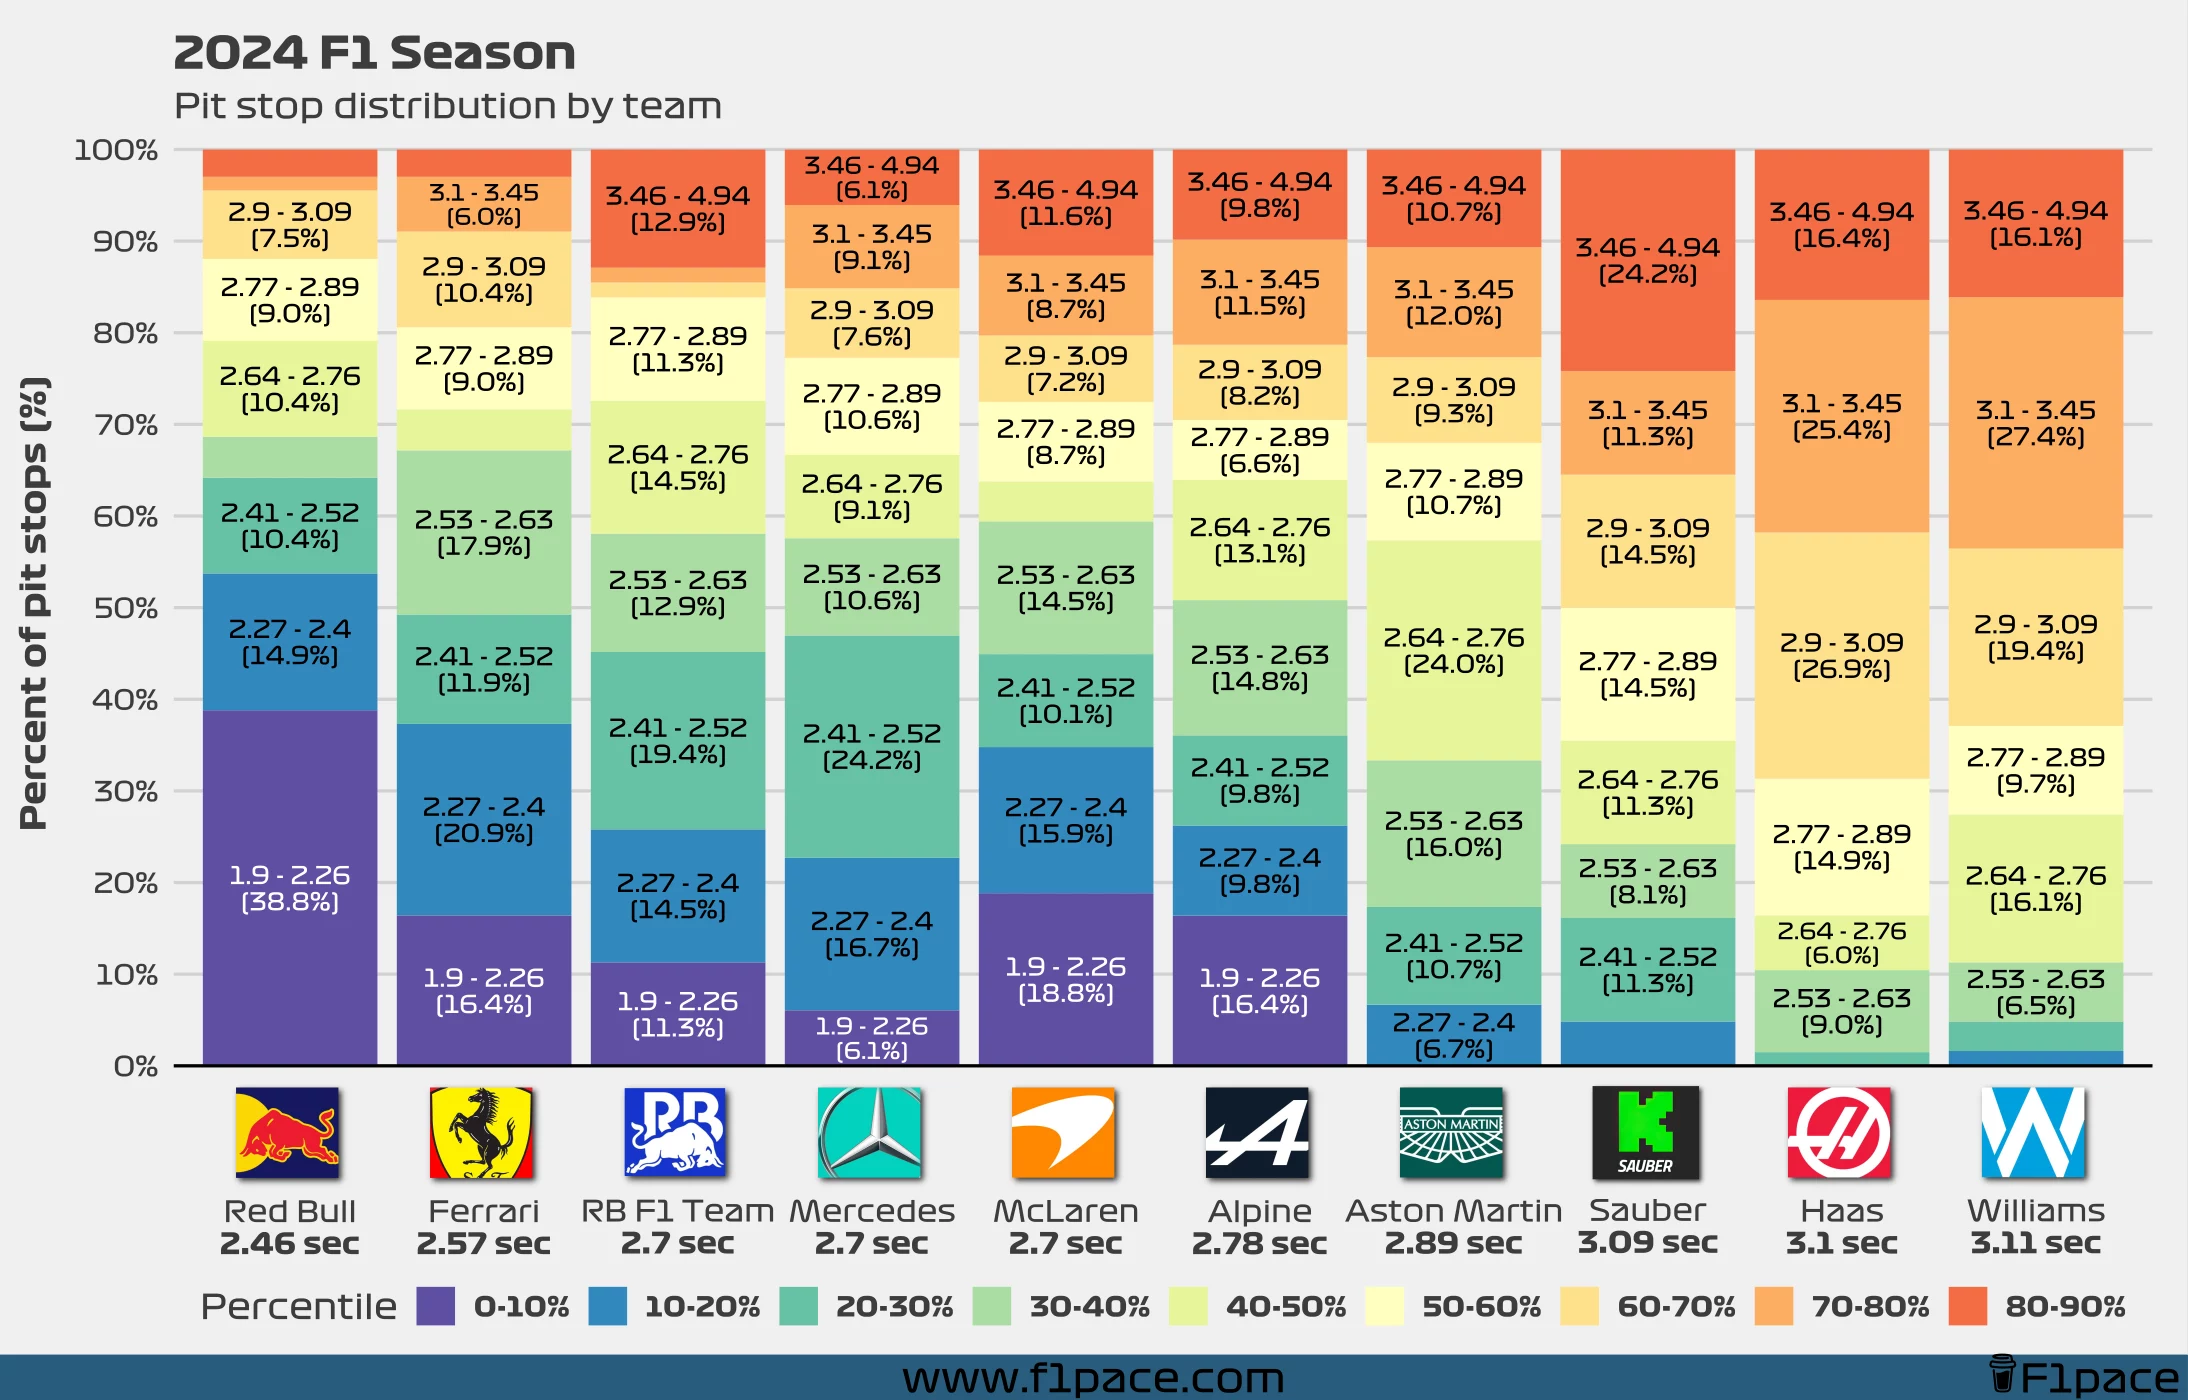
Another way to look at the same data is by grouping it by team rather than by percentile range. This chart helps us see where most of each team’s pit stops fall in terms of percentile ranges.
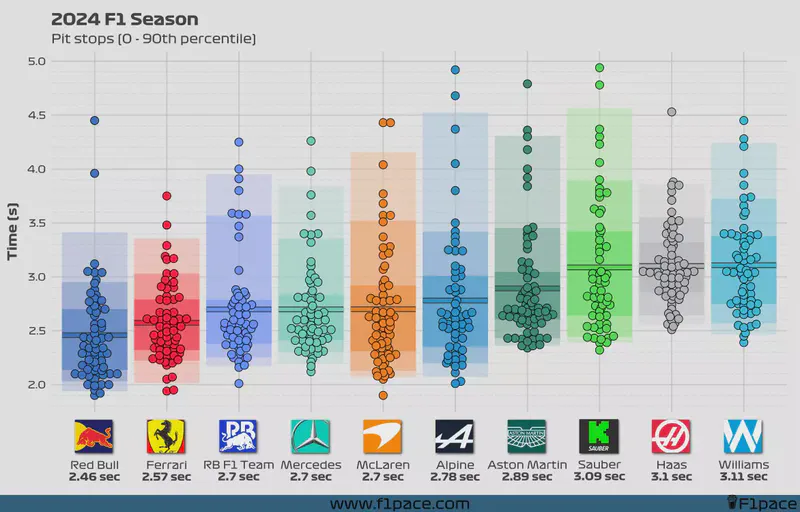
The Red Bull crew was the fastest overall, with an average pit stop time of 2.46 seconds. A massive 38.8% of their pit stops were in the fastest 10% of the season. If we add the 10-20% and 20-30% percentile ranges to the fastest 0-10% range, we see that 64.1% of Red Bull’s pit stops were under 2.52 seconds. It’s safe to say their performance this season was nothing short of outstanding.
Ferrari’s mechanics were the second fastest, with an average of 2.57 seconds per stop. The main difference from Red Bull was that Ferrari had more stops in the 2.27-2.4 second range, while Red Bull dominated the 1.9-2.26 second range.
There wasn’t much separating Red Bull, Mercedes, and McLaren, with all three teams averaging 2.7 seconds per stop. It was interesting to see that despite differences in their pit stop distributions—for instance, Mercedes had fewer “top” stops but also fewer slow stops—these three teams ended up with the same average time after 24 races.
Alpine and Aston Martin followed behind, with average pit stop times of 2.78 and 2.89 seconds, respectively. Sauber, Haas, and Williams were the only teams whose average pit stop times exceeded the 3-second mark.
Pit stops (0 - 90th percentile)
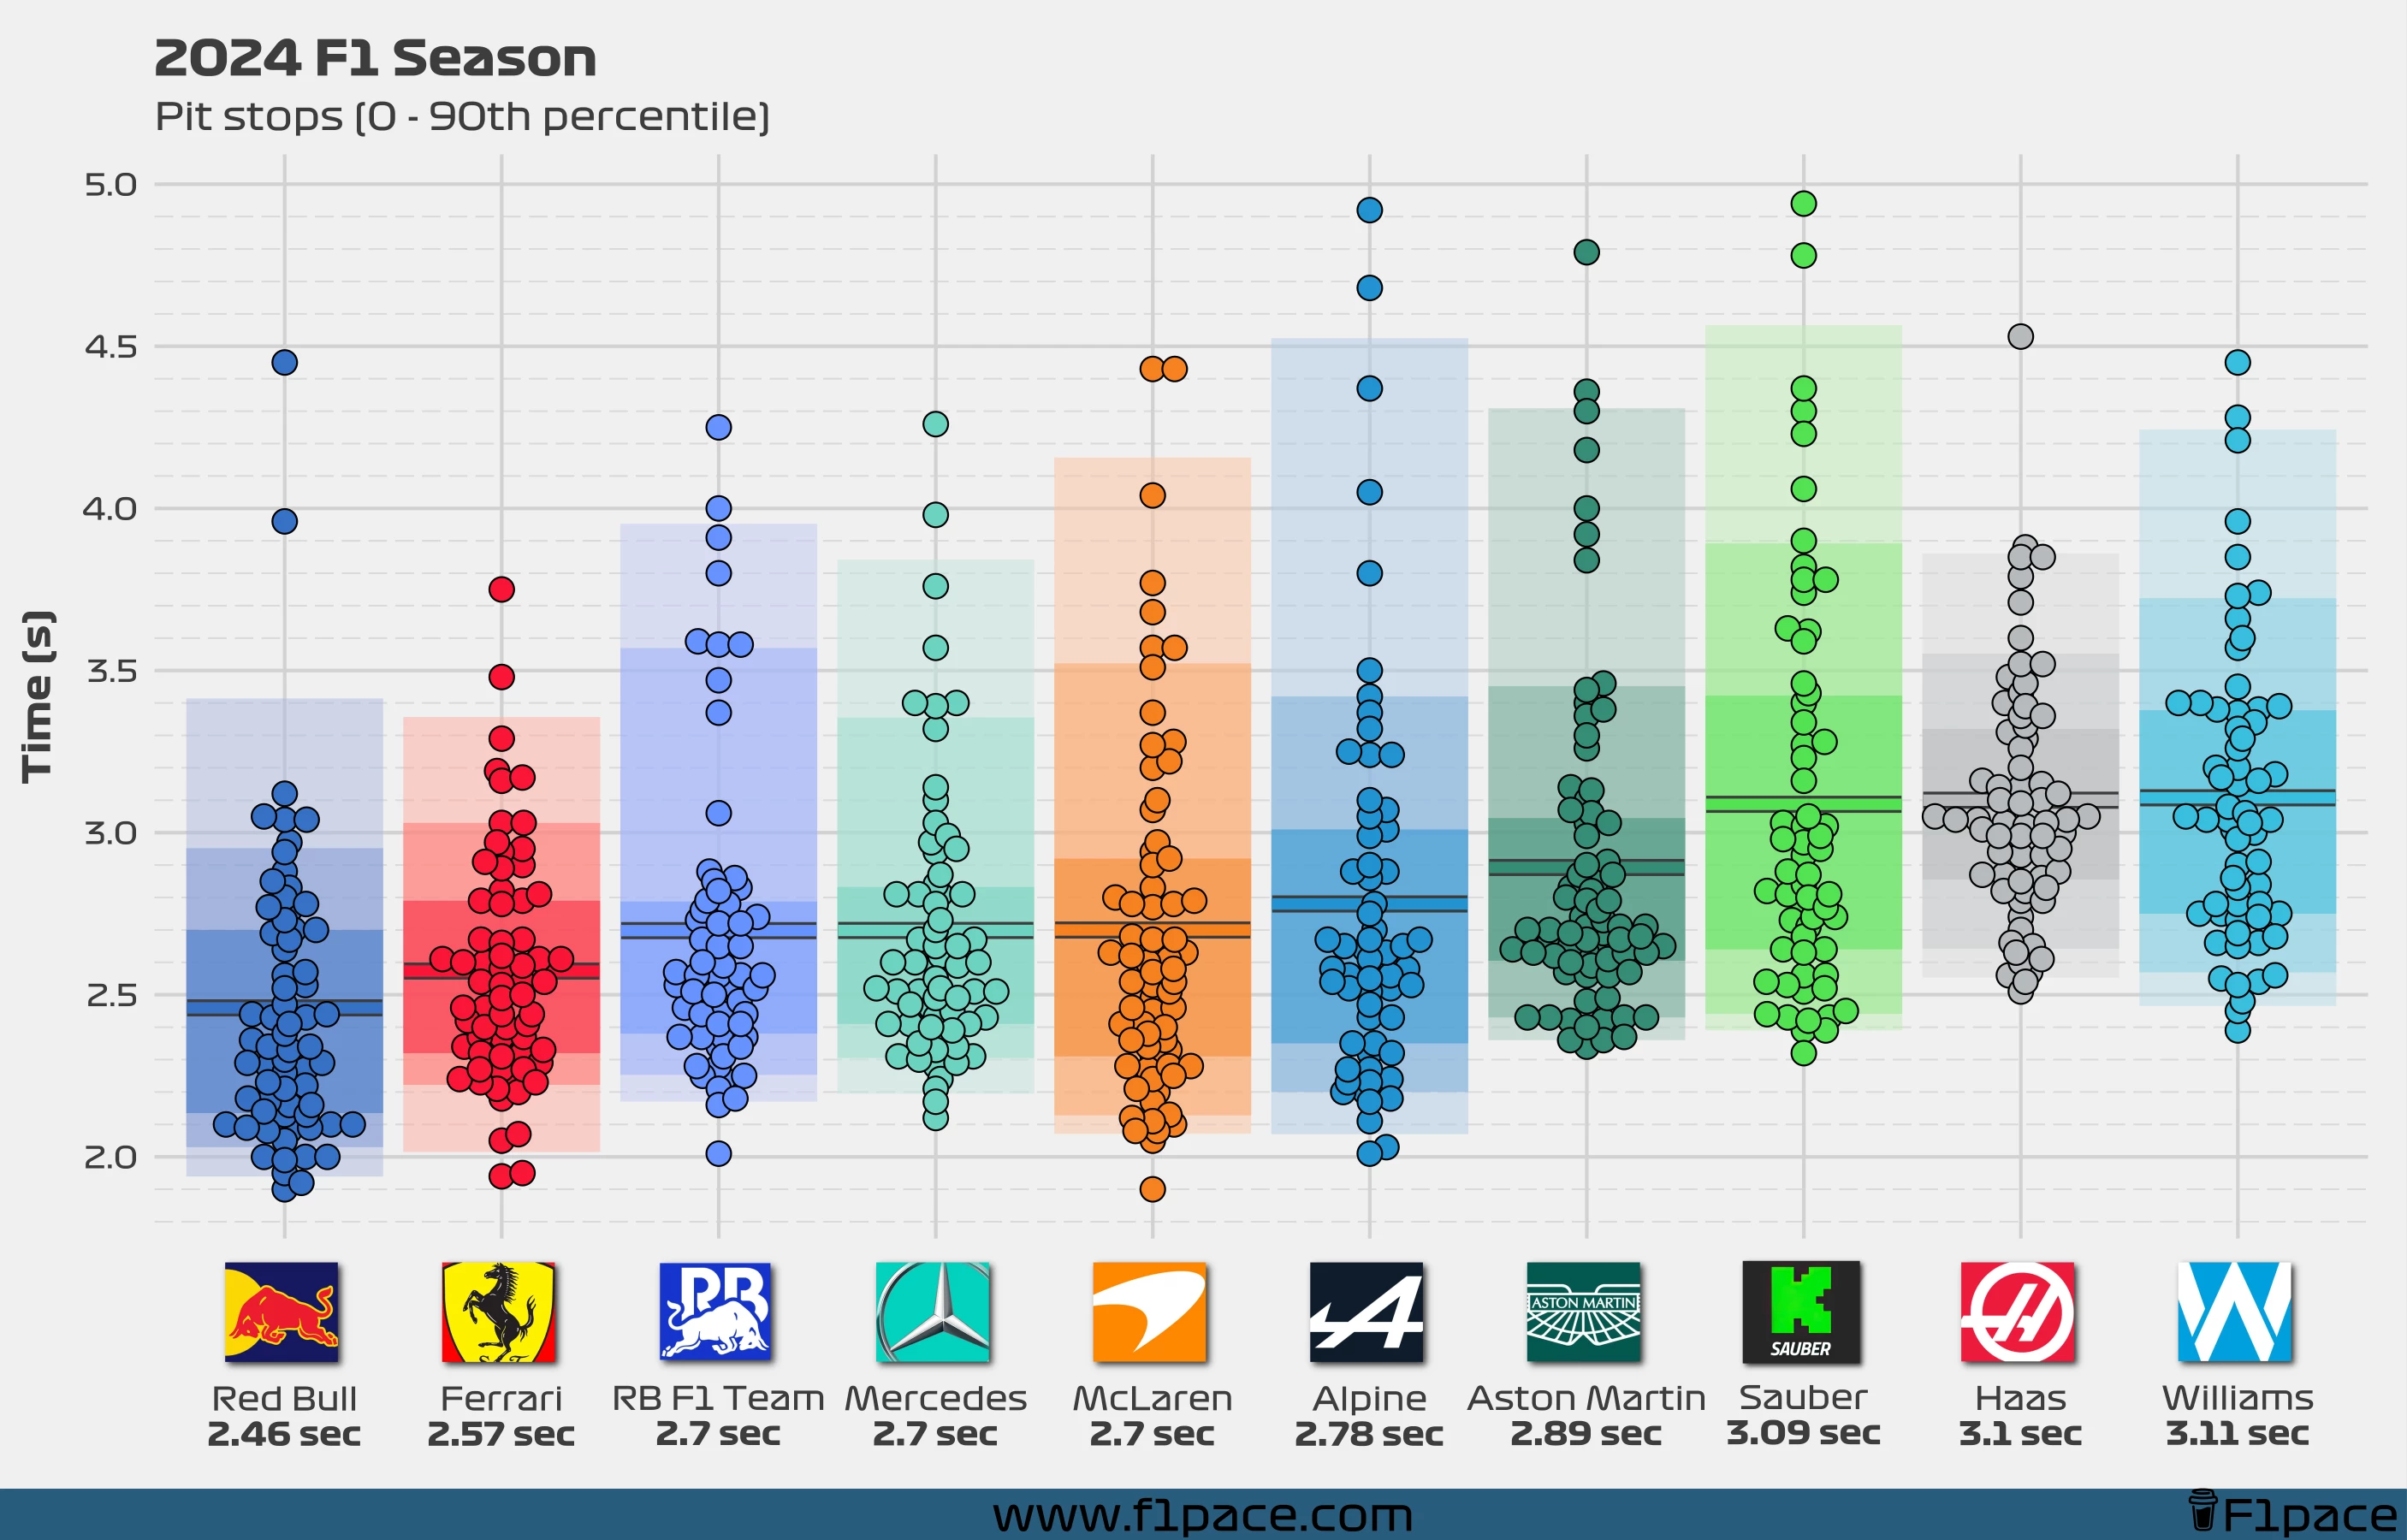
So far, we’ve discretized the data, meaning we’ve categorized it into intervals. But we can also look at the stops in continuous space to see how they’re distributed. This chart shows all the stops analyzed, with background bands representing the 50% (darkest), 80%, and 95% interval ranges for each team. The 50% range shows where 50% of the stops around the average fall, while the 80% and 95% ranges show the same thing but with broader coverage.
You can clearly see that Red Bull was the fastest, though they were slightly less consistent than Ferrari. Meanwhile, the Alpine crew seemed to have a wider spread in their pit stop times, which suggests they weren’t as consistent as the other teams.
Haas is an interesting case. They were among the slowest, but surprisingly consistent. I guess there’s a silver lining there.
I also want to point out that Williams is a bit of a strange case. A few years ago, they had one of the best pit crews in F1 and were second only to Red Bull. I’m not sure what’s happened to them since. It’s hard to say whether they’ve lost talent to other teams or if there’s a mechanical issue, but it’s surprising to see them now as the slowest pit crew in current Formula 1.
Fastest pit stop for each team
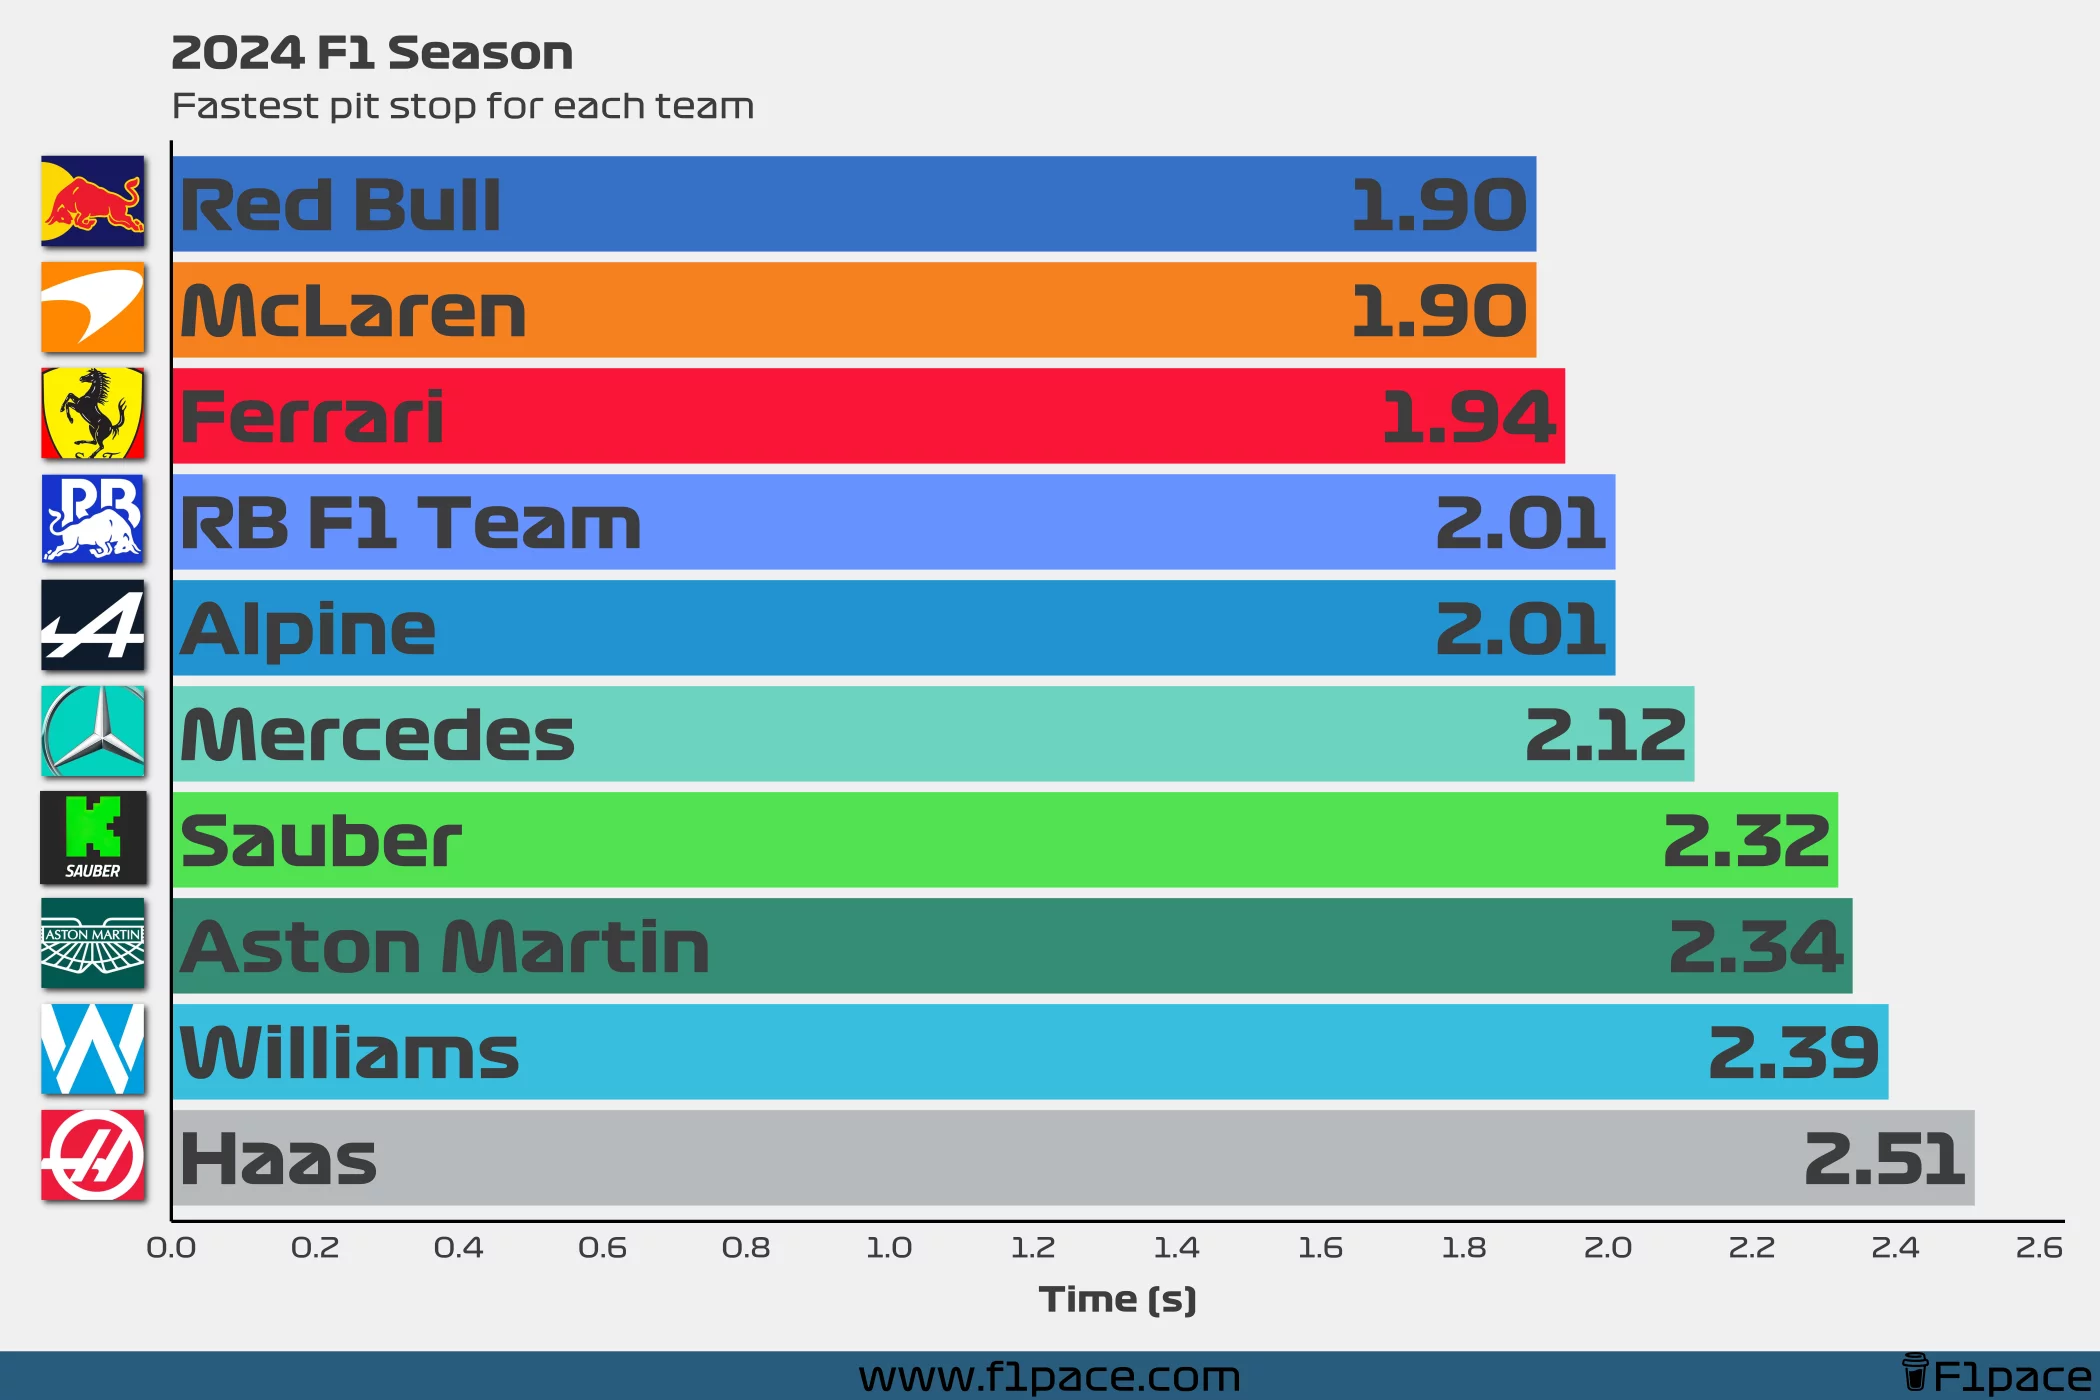
Many people have shared or will share the fastest pit stops of the year, but this usually means highlighting laps mainly from Red Bull, Ferrari, and McLaren, while overlooking the fastest stops from other teams.
If we plot these in a simple bar chart, we see that in terms of maximum speed, McLaren and Red Bull were neck and neck, both hitting a fastest pit stop time of 1.90 seconds. Ferrari wasn’t far behind, with a 1.94-second stop at the Miami Grand Prix. RB F1 Team and Alpine came very close to a sub-2 second stop this year, both achieving a fastest time of 2.01 seconds.
When we look at the slowest stops, we see that Sauber, Aston Martin, Williams, and Haas never had a pit stop faster than 2.30 seconds. Haas’ fastest stop came in at 2.51 seconds. To put this into perspective, 62.6% of the representative pit stops done by Red Bull took less than 2.51 seconds.
Rolling average pit stop trend
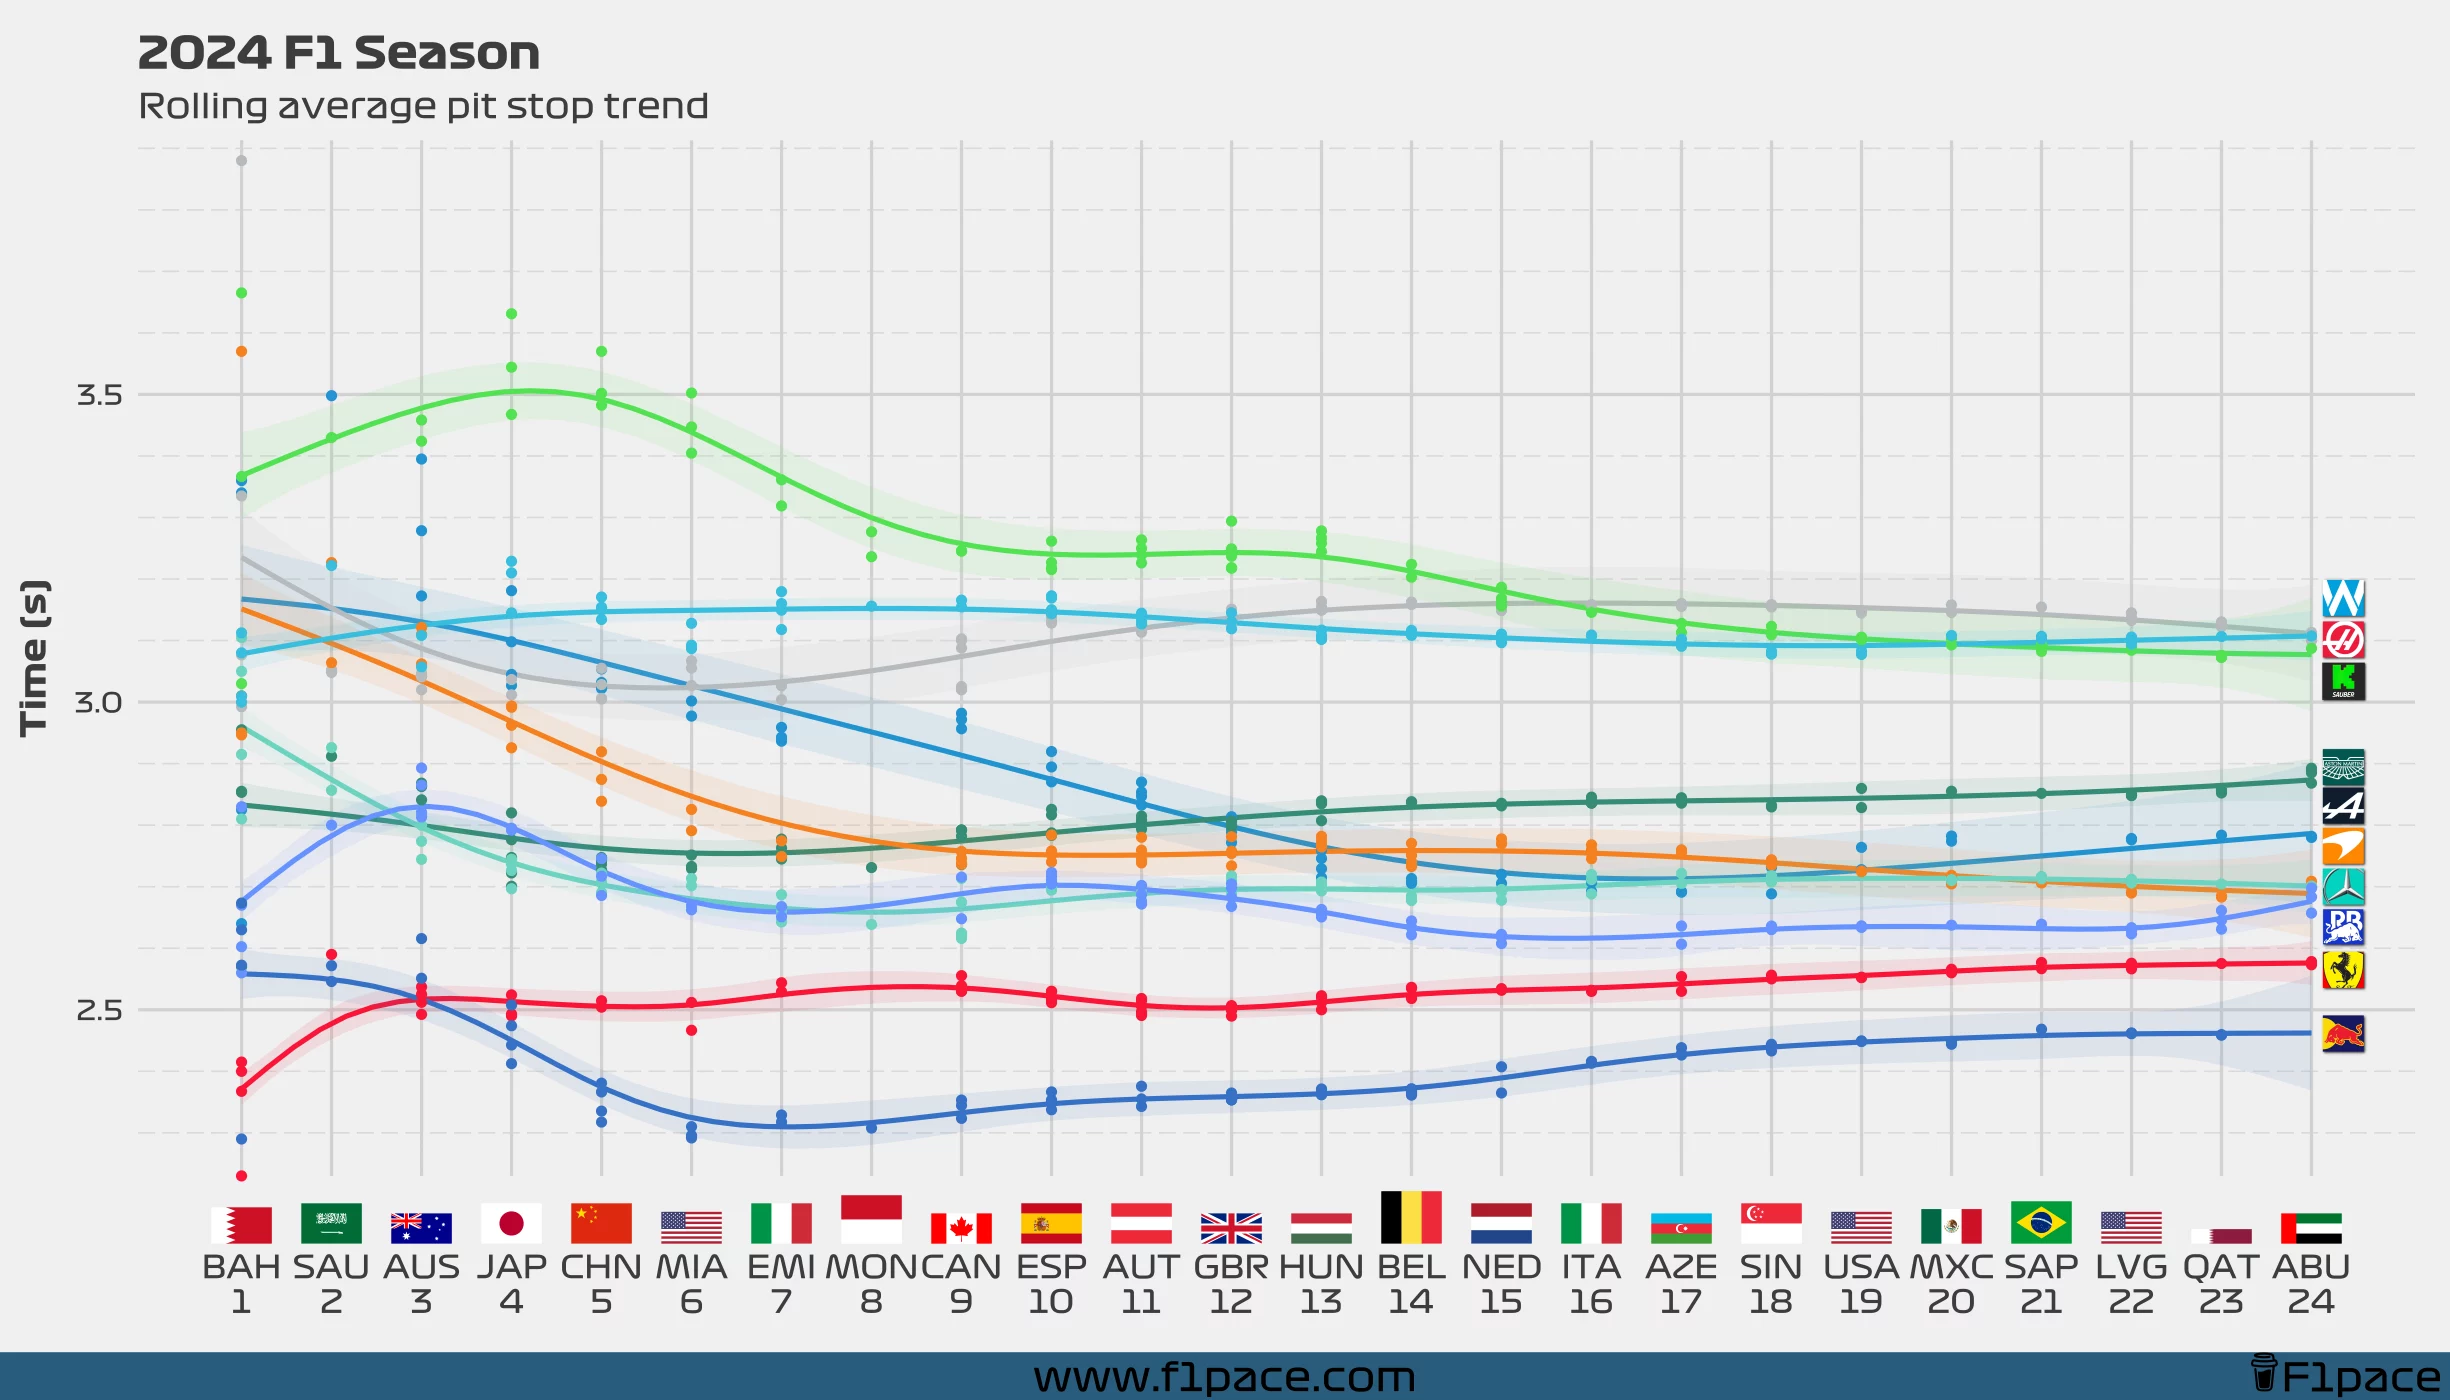
We already know which teams were the fastest and slowest in the pit stop department, but how did their times change throughout the season? One way to figure this out is by calculating a rolling average for all the stops made in 2024 (as long as they were in the 0-90th percentile). This approach keeps adding stops to the average as the season progresses, showing us whether the stops got faster, slower, or stayed the same.
I find these results pretty exciting. One notable case is Sauber. We know they’ve struggled with their wheel guns over the past few years, and while they’re still among the slowest, we can see a clear improvement starting at the Miami Grand Prix. This trend continued throughout the season, which could motivate them to push for even more progress in 2025.
Alpine and McLaren also deserve a shout-out, as both showed strong improvement as the season went on—something that bodes well for next year.
One trend that surprised me was how average pit stop times seemed to slow down in the final rounds of the season. Teams like Red Bull, Ferrari, RB F1 Team, Alpine, Aston Martin, and Williams all got slightly slower in the final races. I can’t say for sure why this happened, but it wouldn’t be surprising if exhaustion after such a long season had an impact.
Final remarks
I think most people visiting this blog already knew that Red Bull had the best pit crew in the game, but it’s exciting to see this fact backed up by data. McLaren made great progress throughout the season, so it’ll be interesting to see them compete with Red Bull and Ferrari next year.
Sauber and Haas have struggled for years. While Haas didn’t show much improvement this season, Sauber was definitely on an upward trend. It would be great to see them fully solve their wheel gun issues next year and potentially make a leap forward.
Williams is such a strange case. They have struggled with on-track speed for many seasons now, but pit stops were not something that they struggled with. This season, though, they were dead last. It would be interesting to understand why they’ve regressed so much. If anyone knows why, drop a comment below!
This was another detailed end-of-season analysis, and it definitely took me more time and energy than the usual FP2 or race pace articles. If you liked what you read, feel free to share it on social media, and if you want to support me, you can click the “buy me a coffee” button below to leave a donation. Anything is greatly appreciated!
