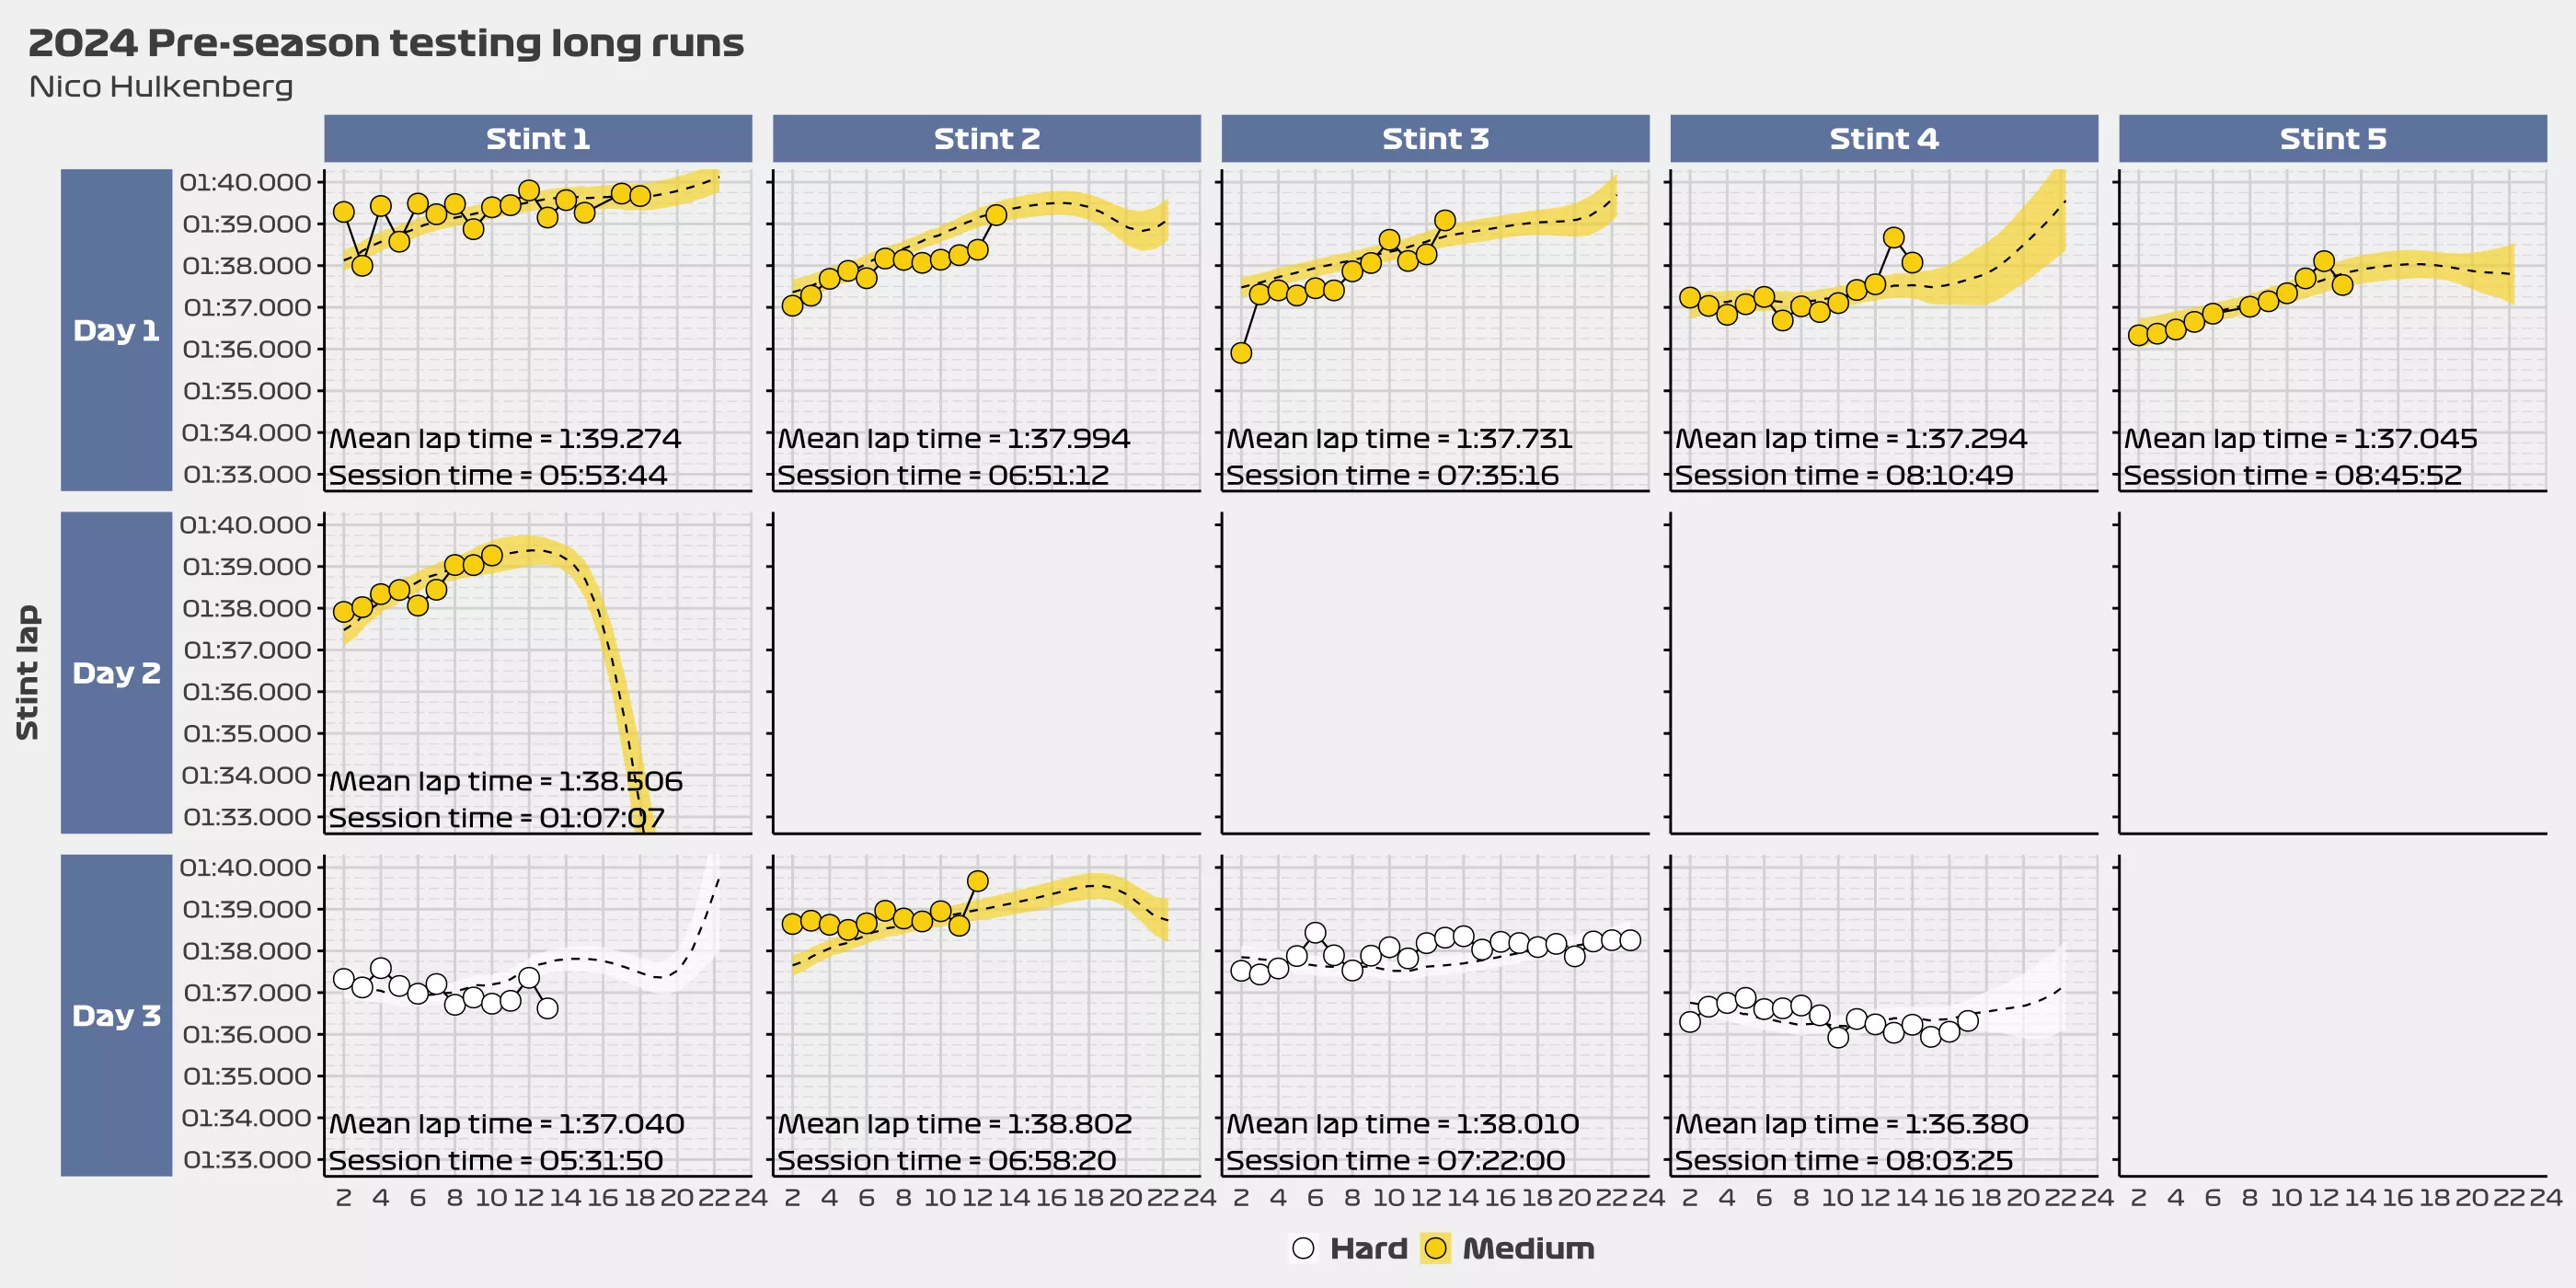
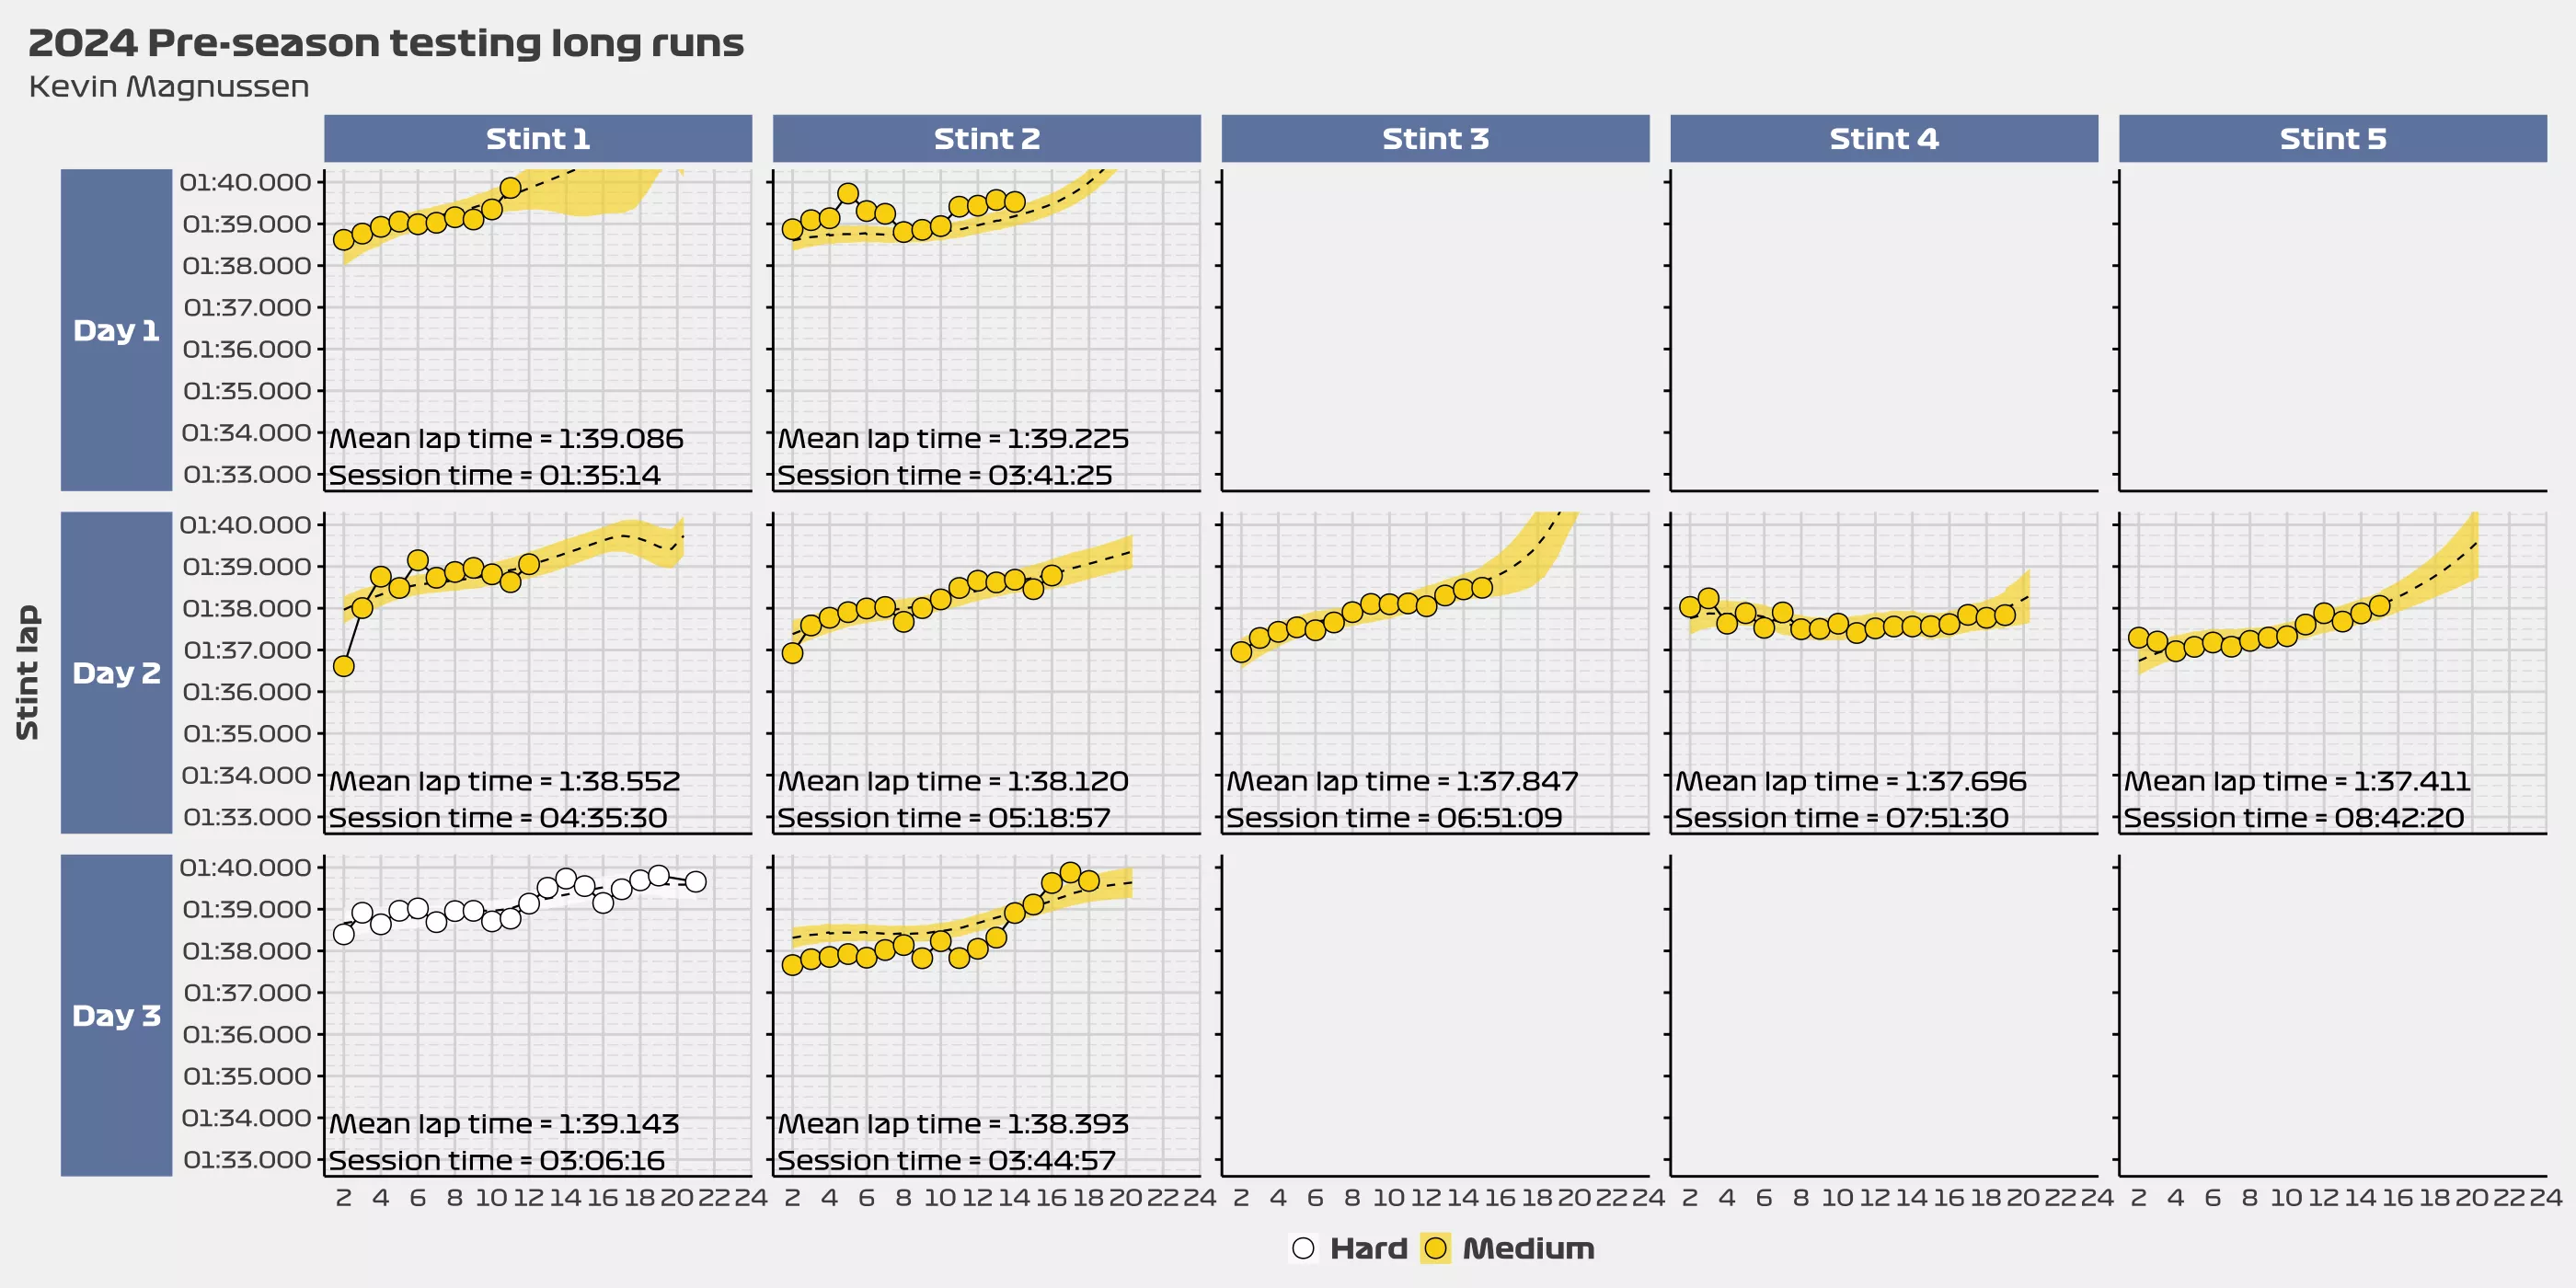
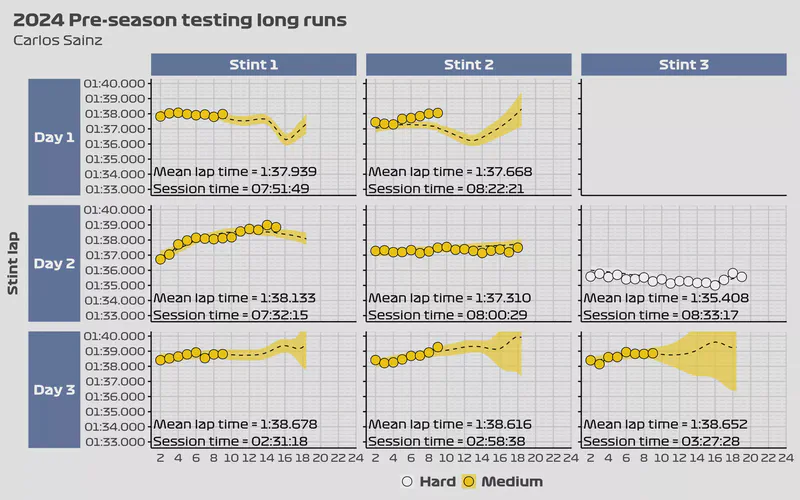
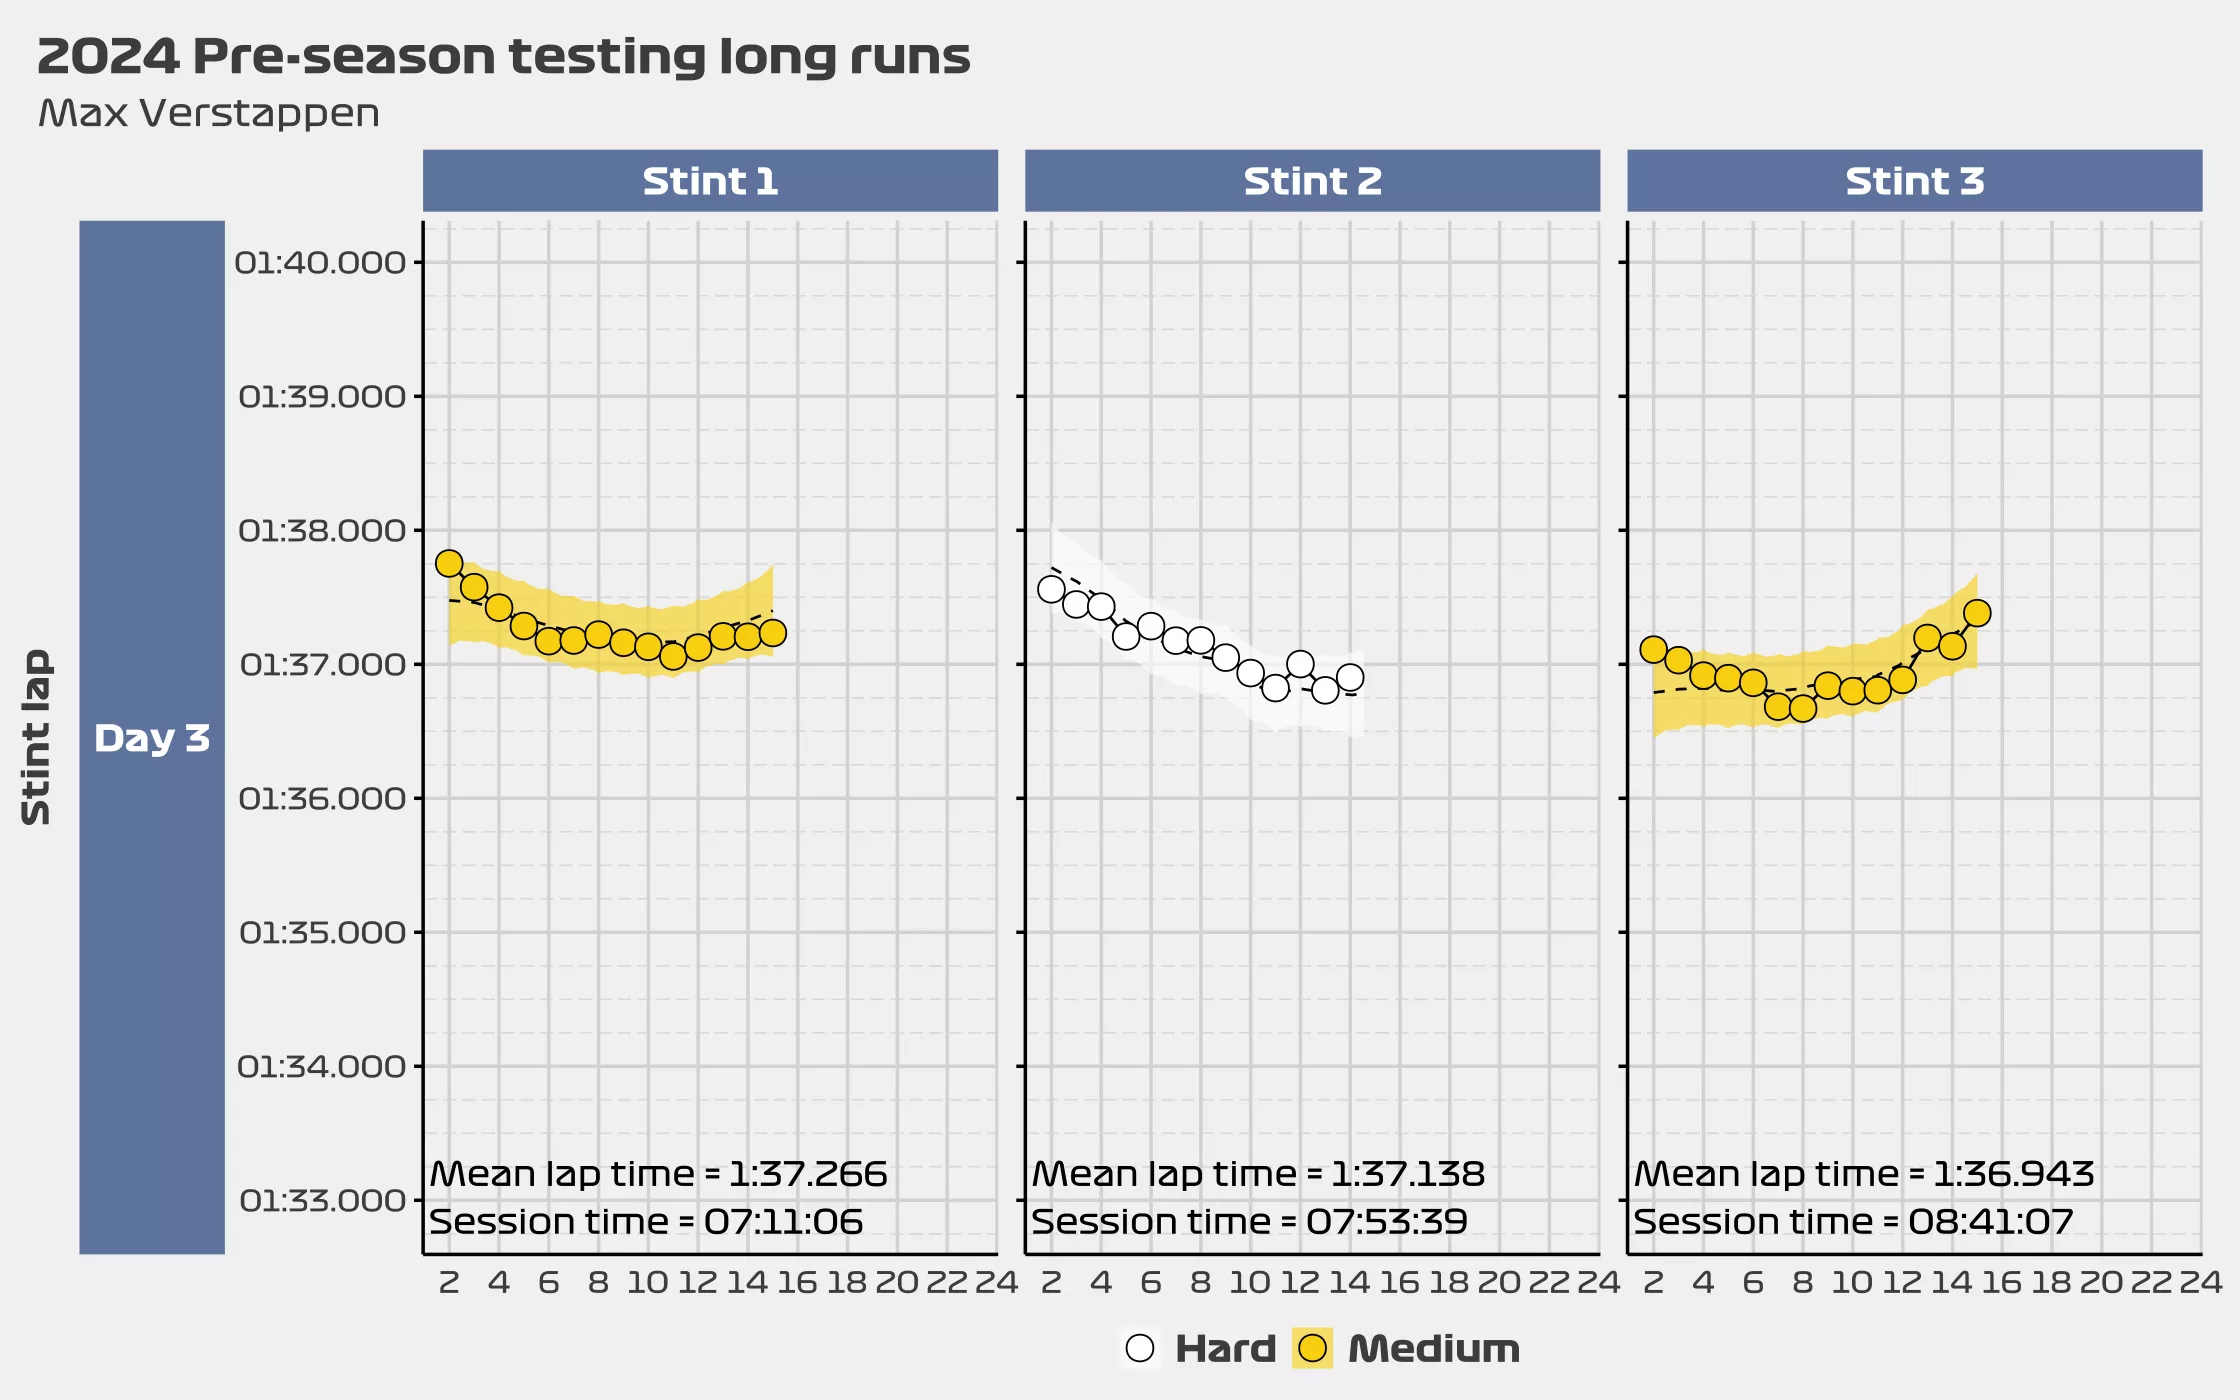
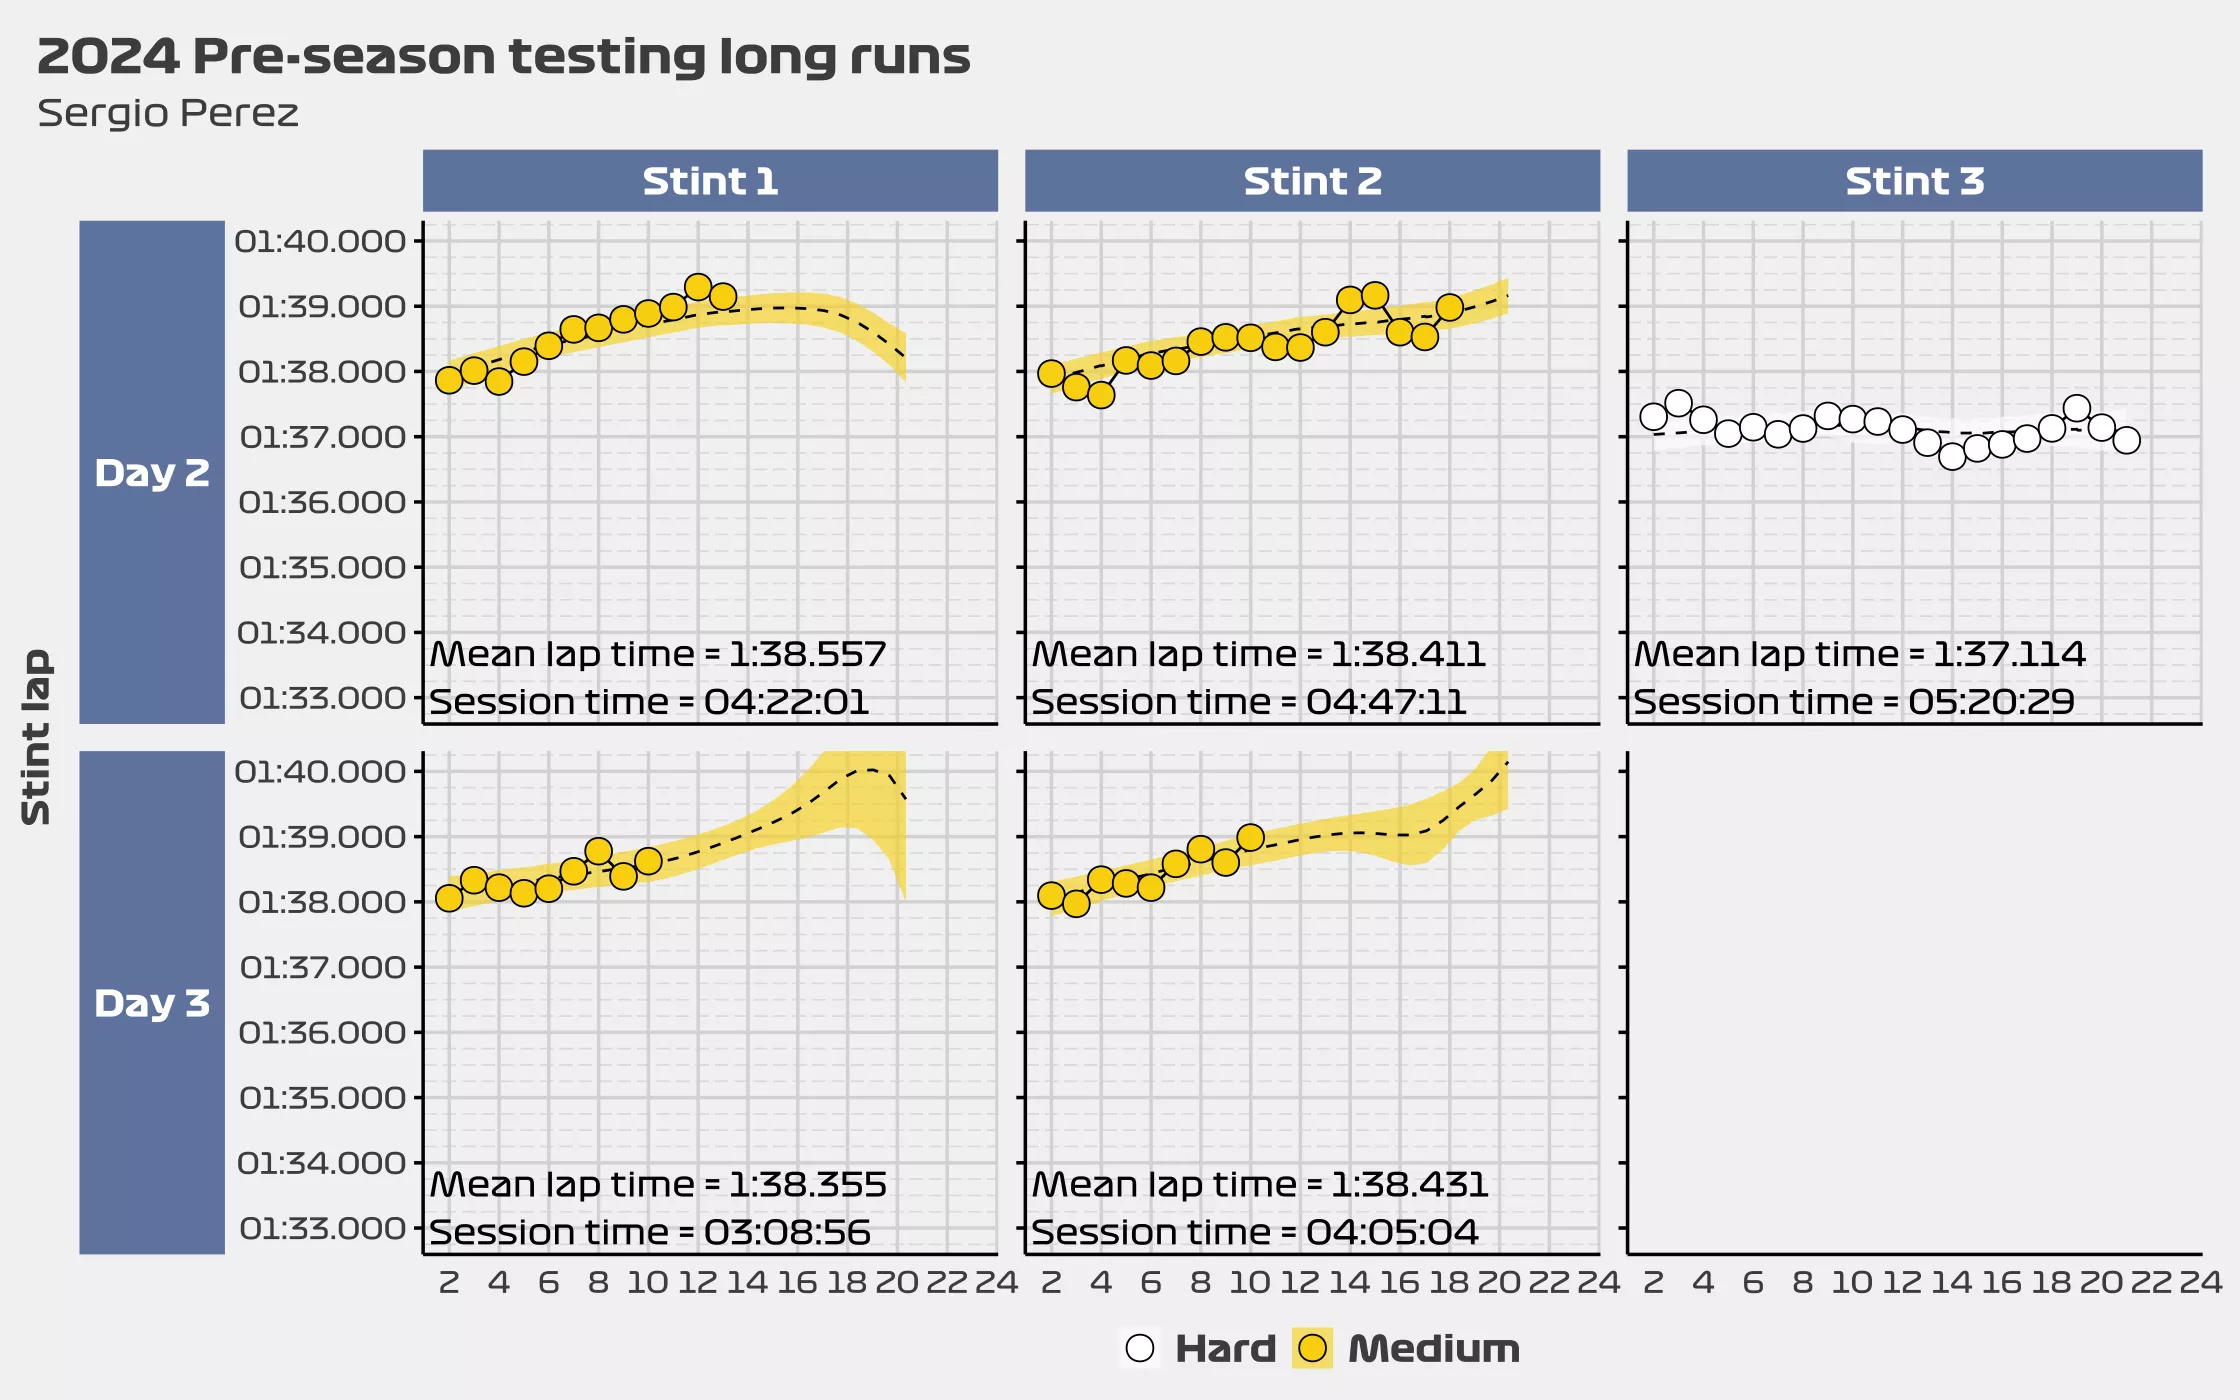
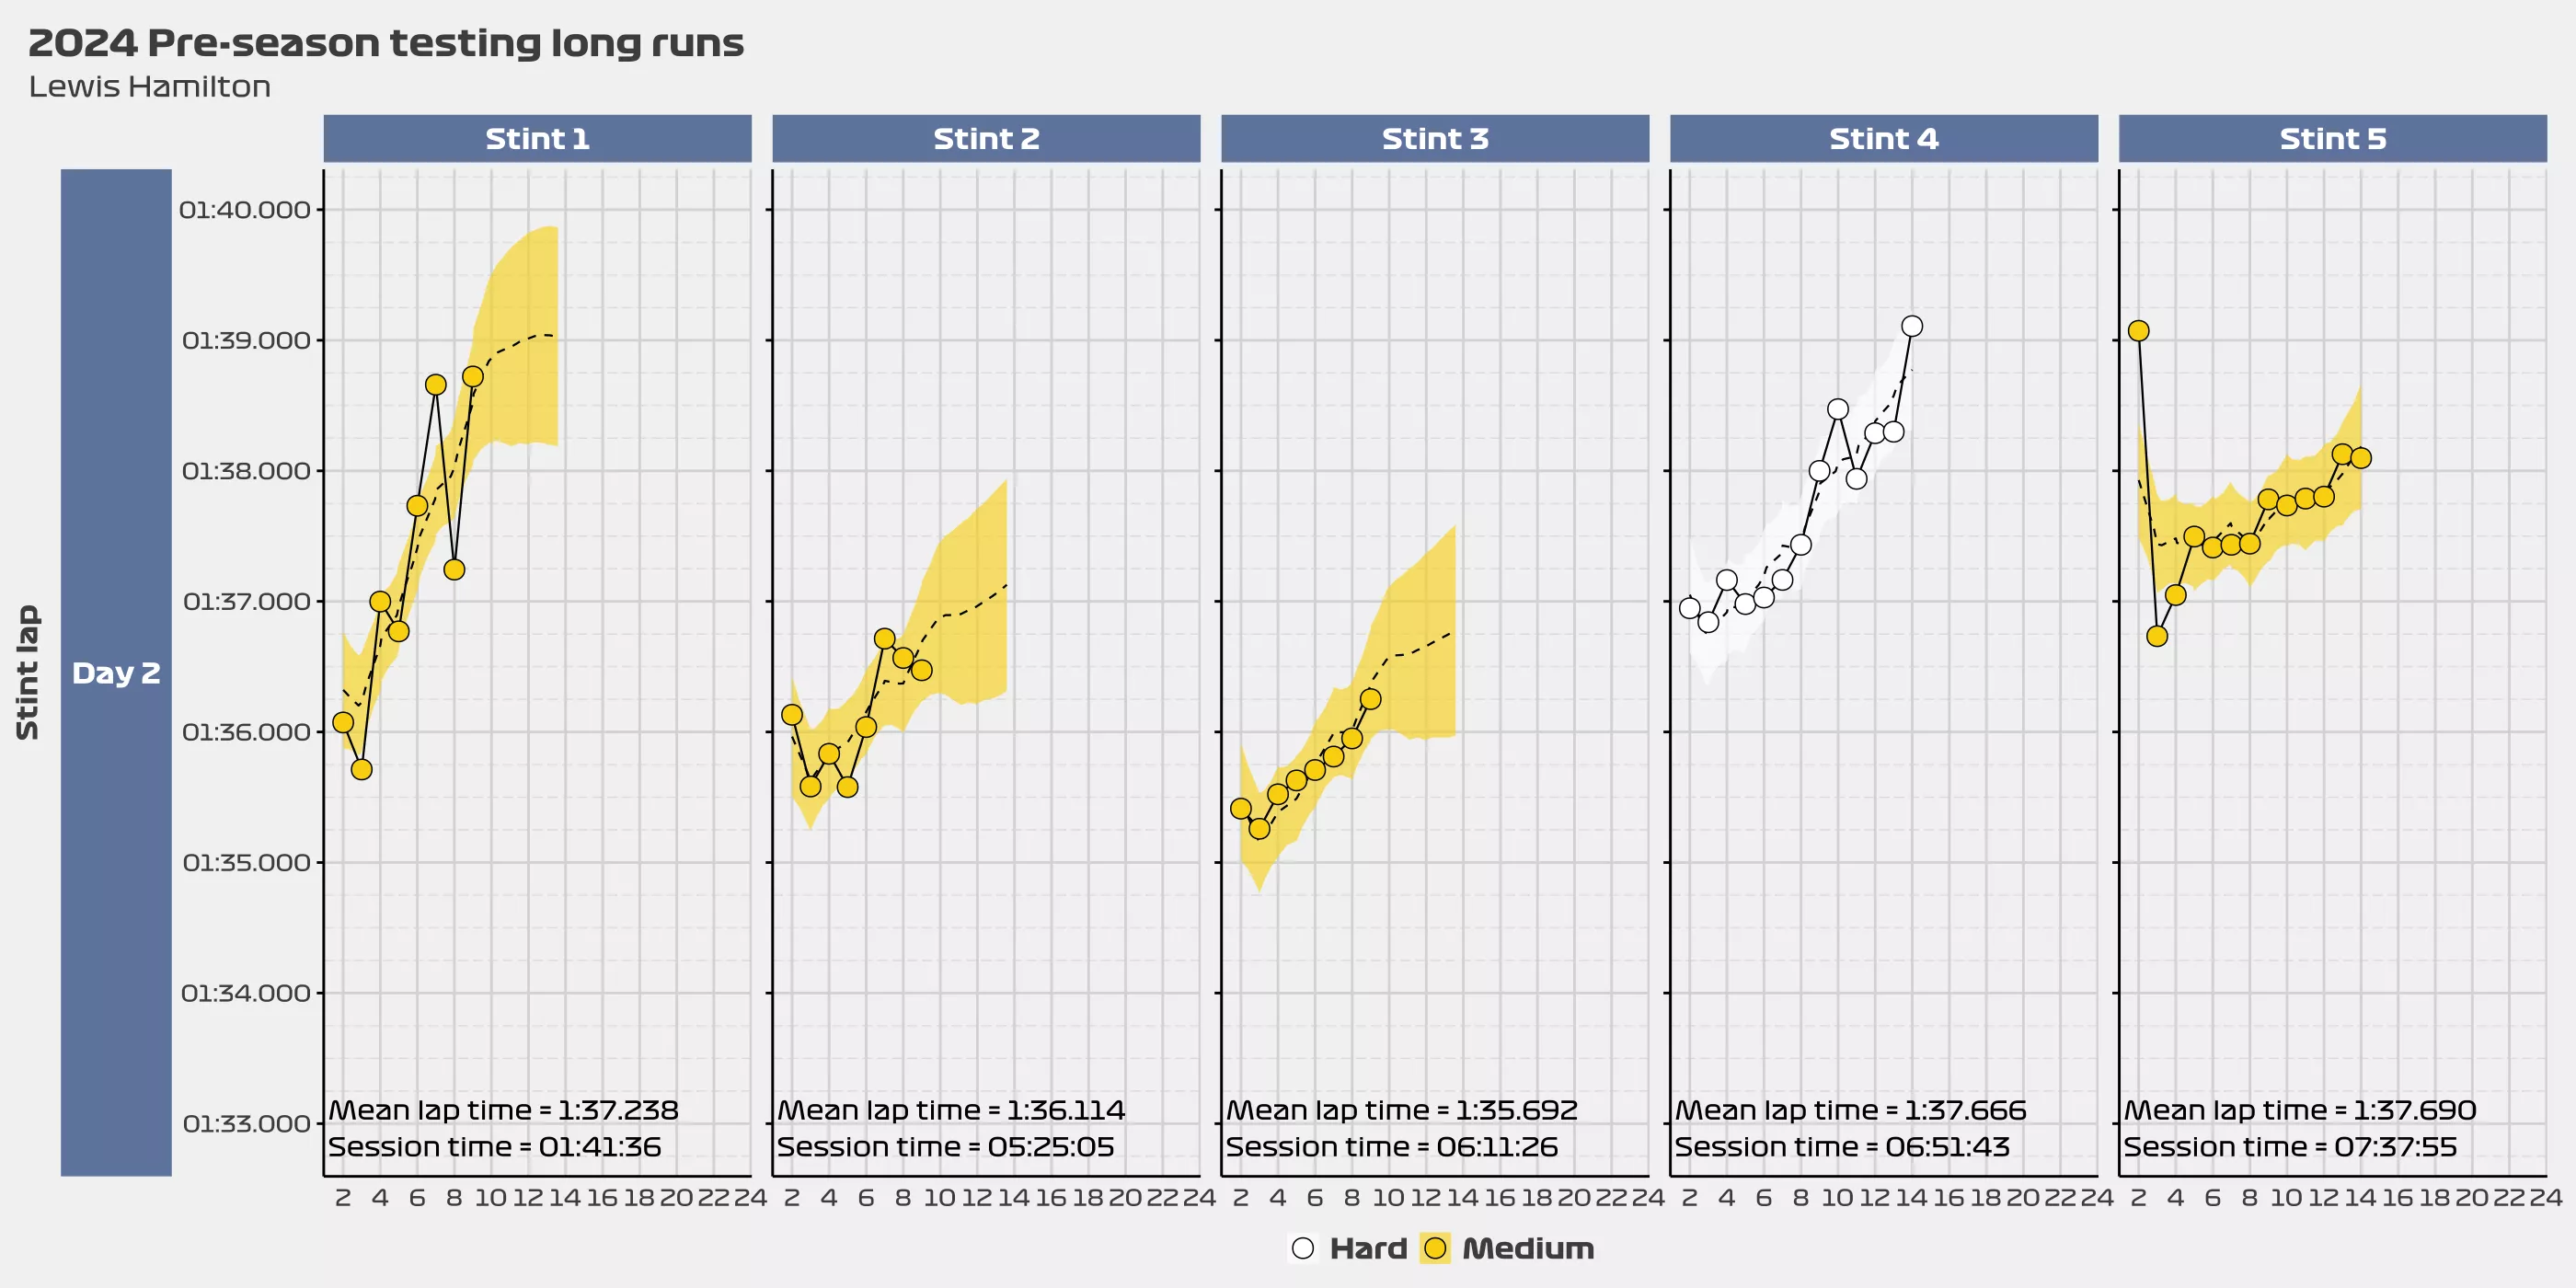
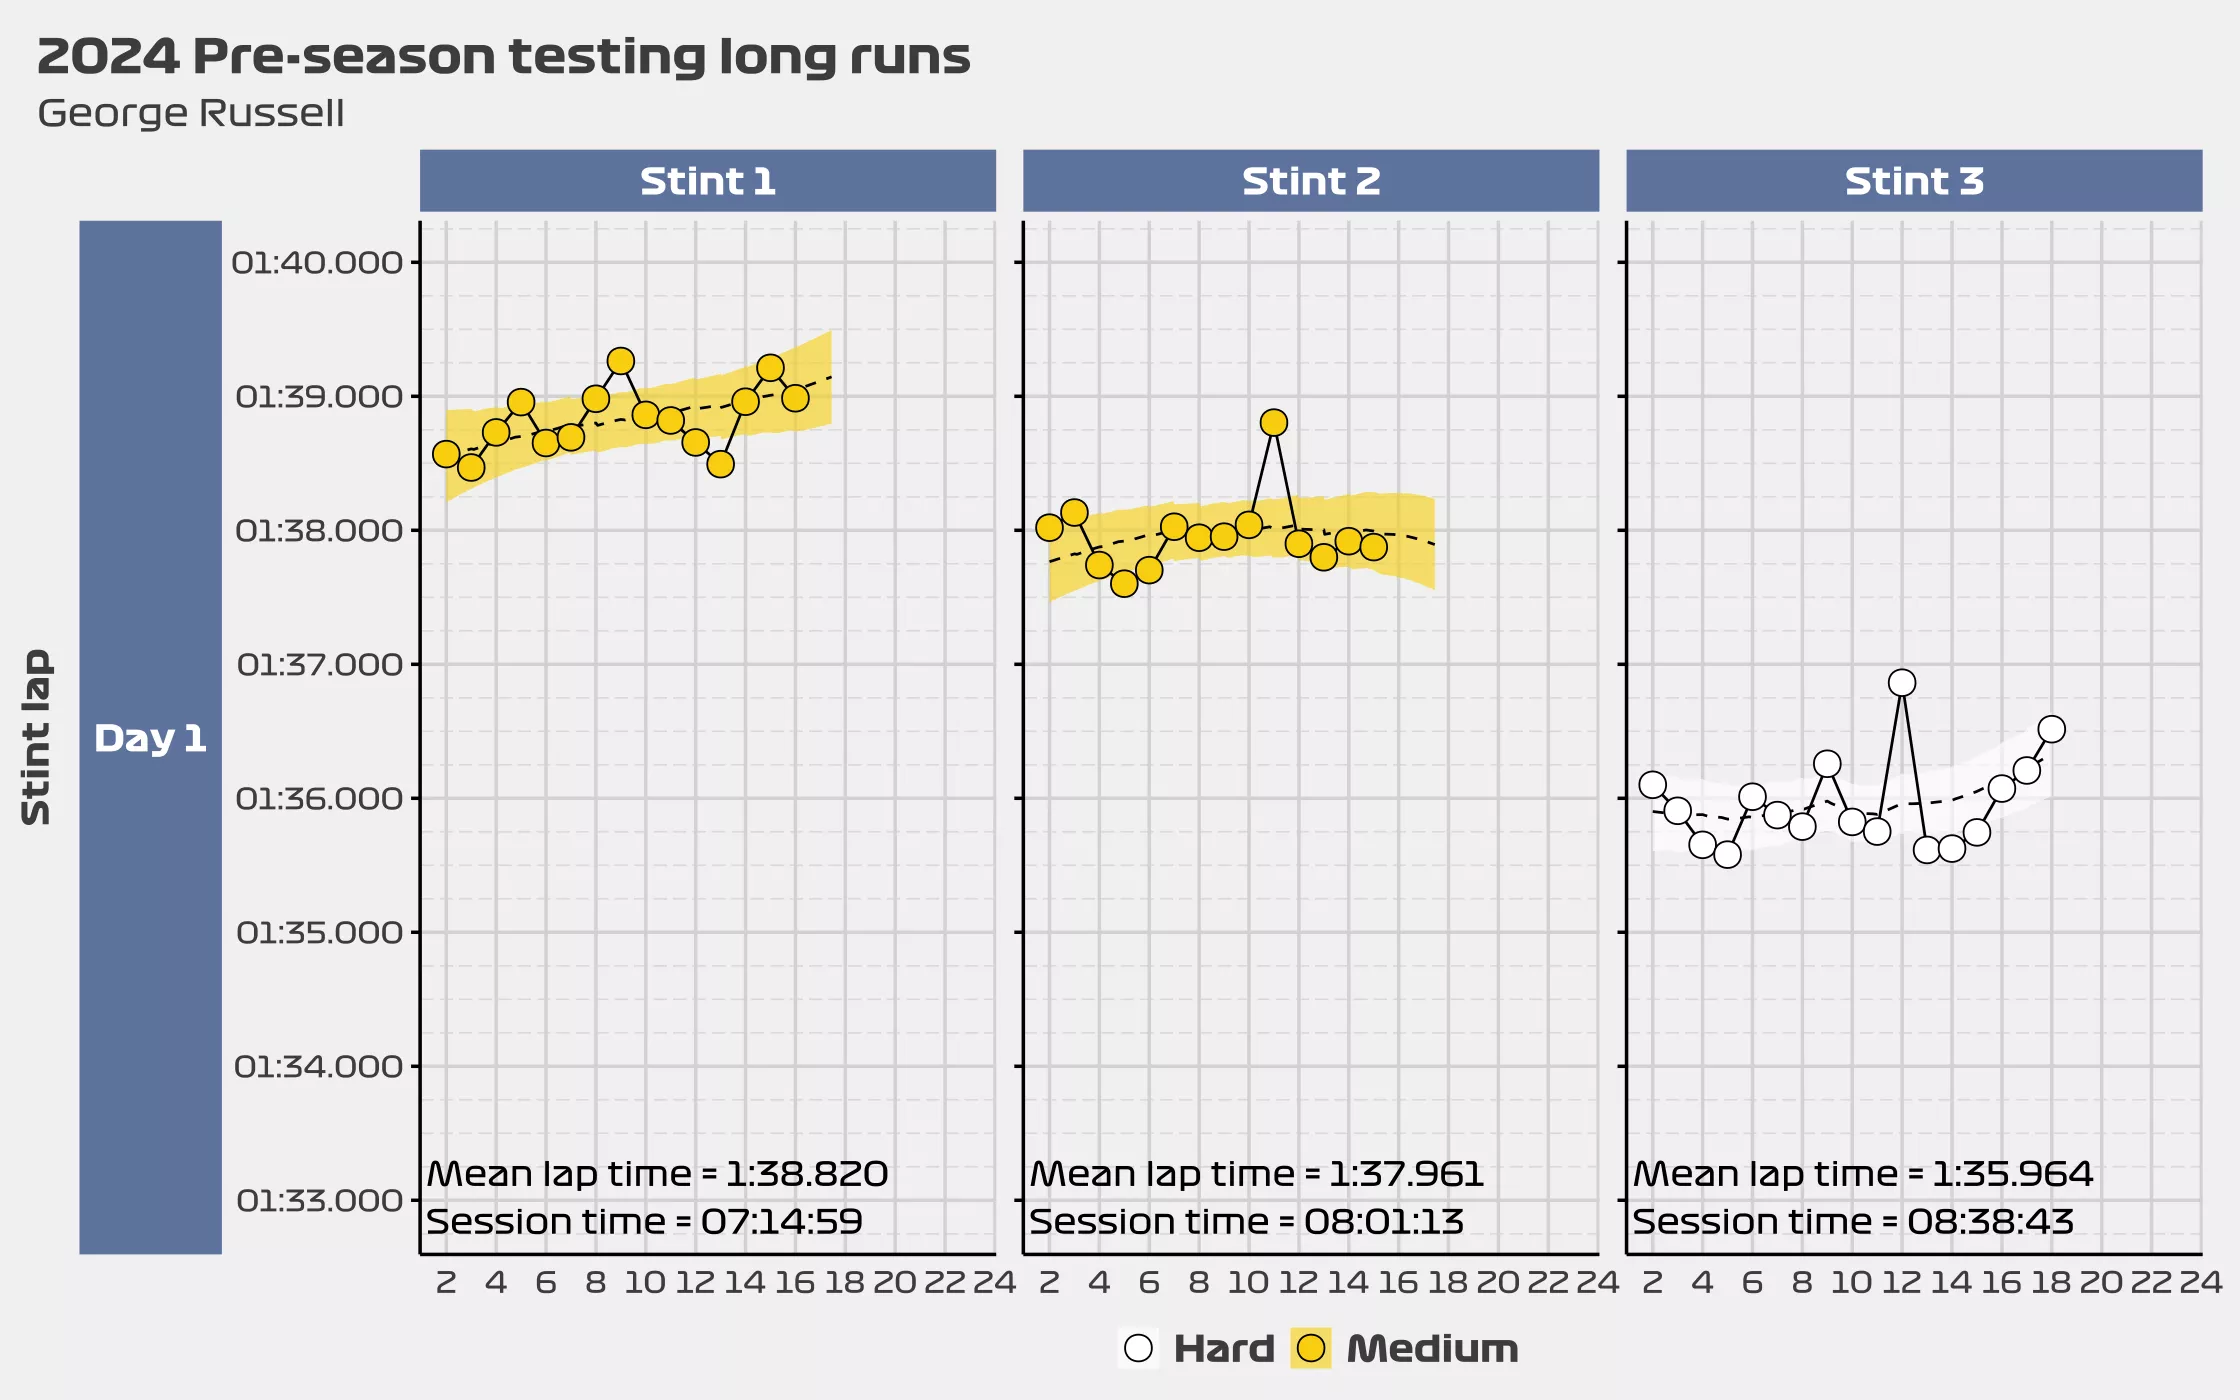
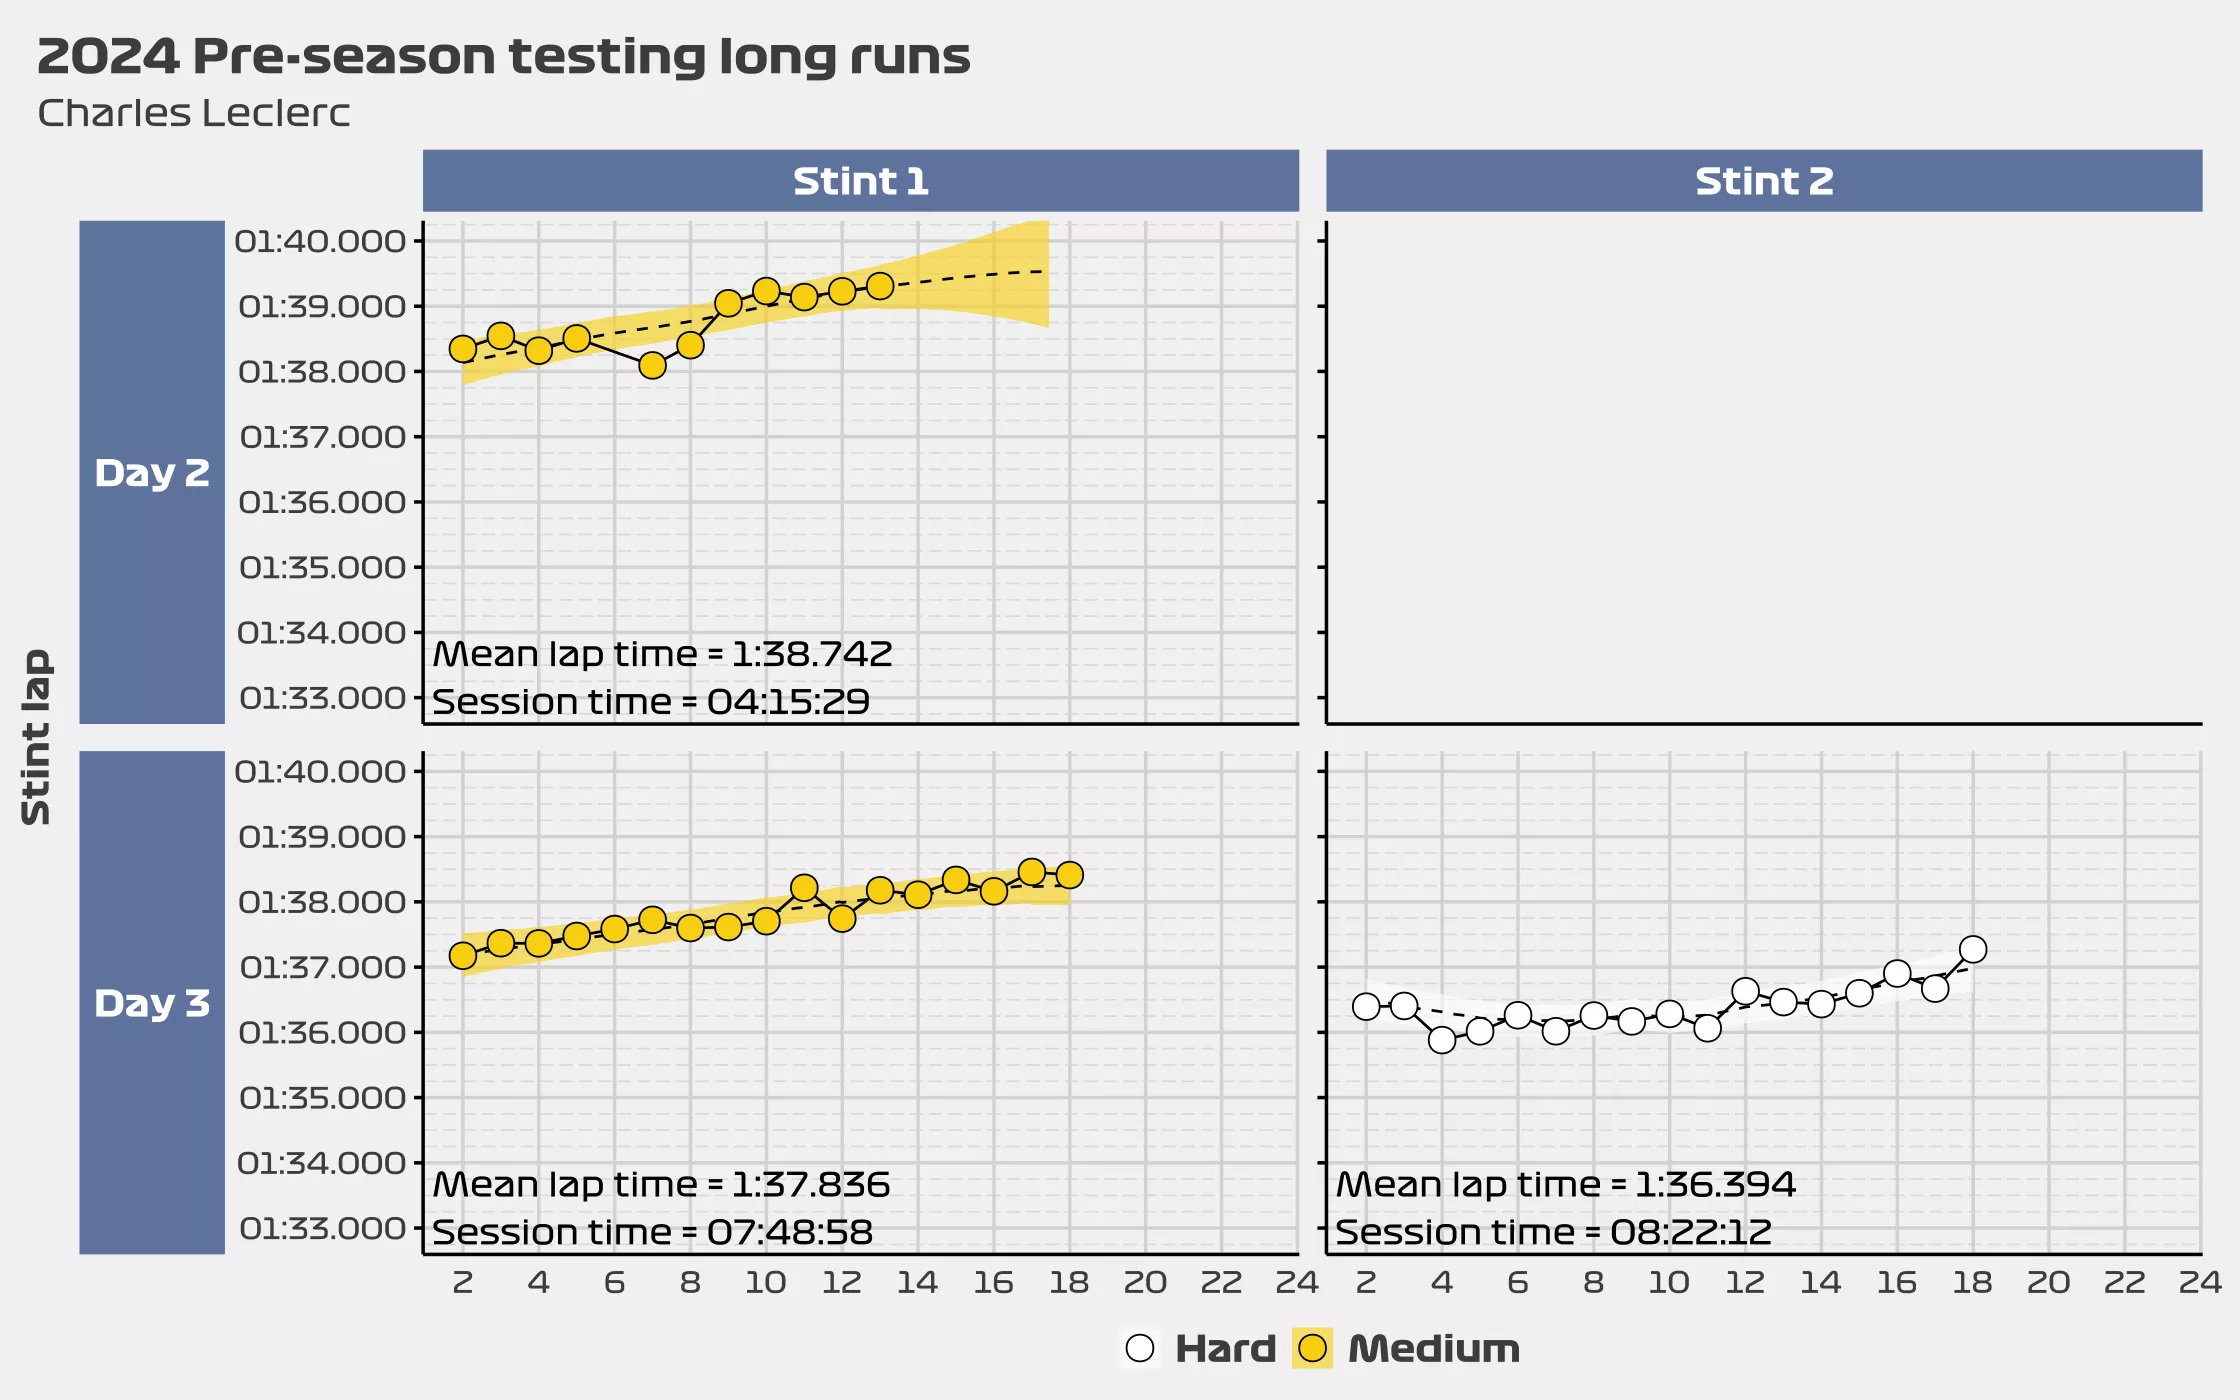
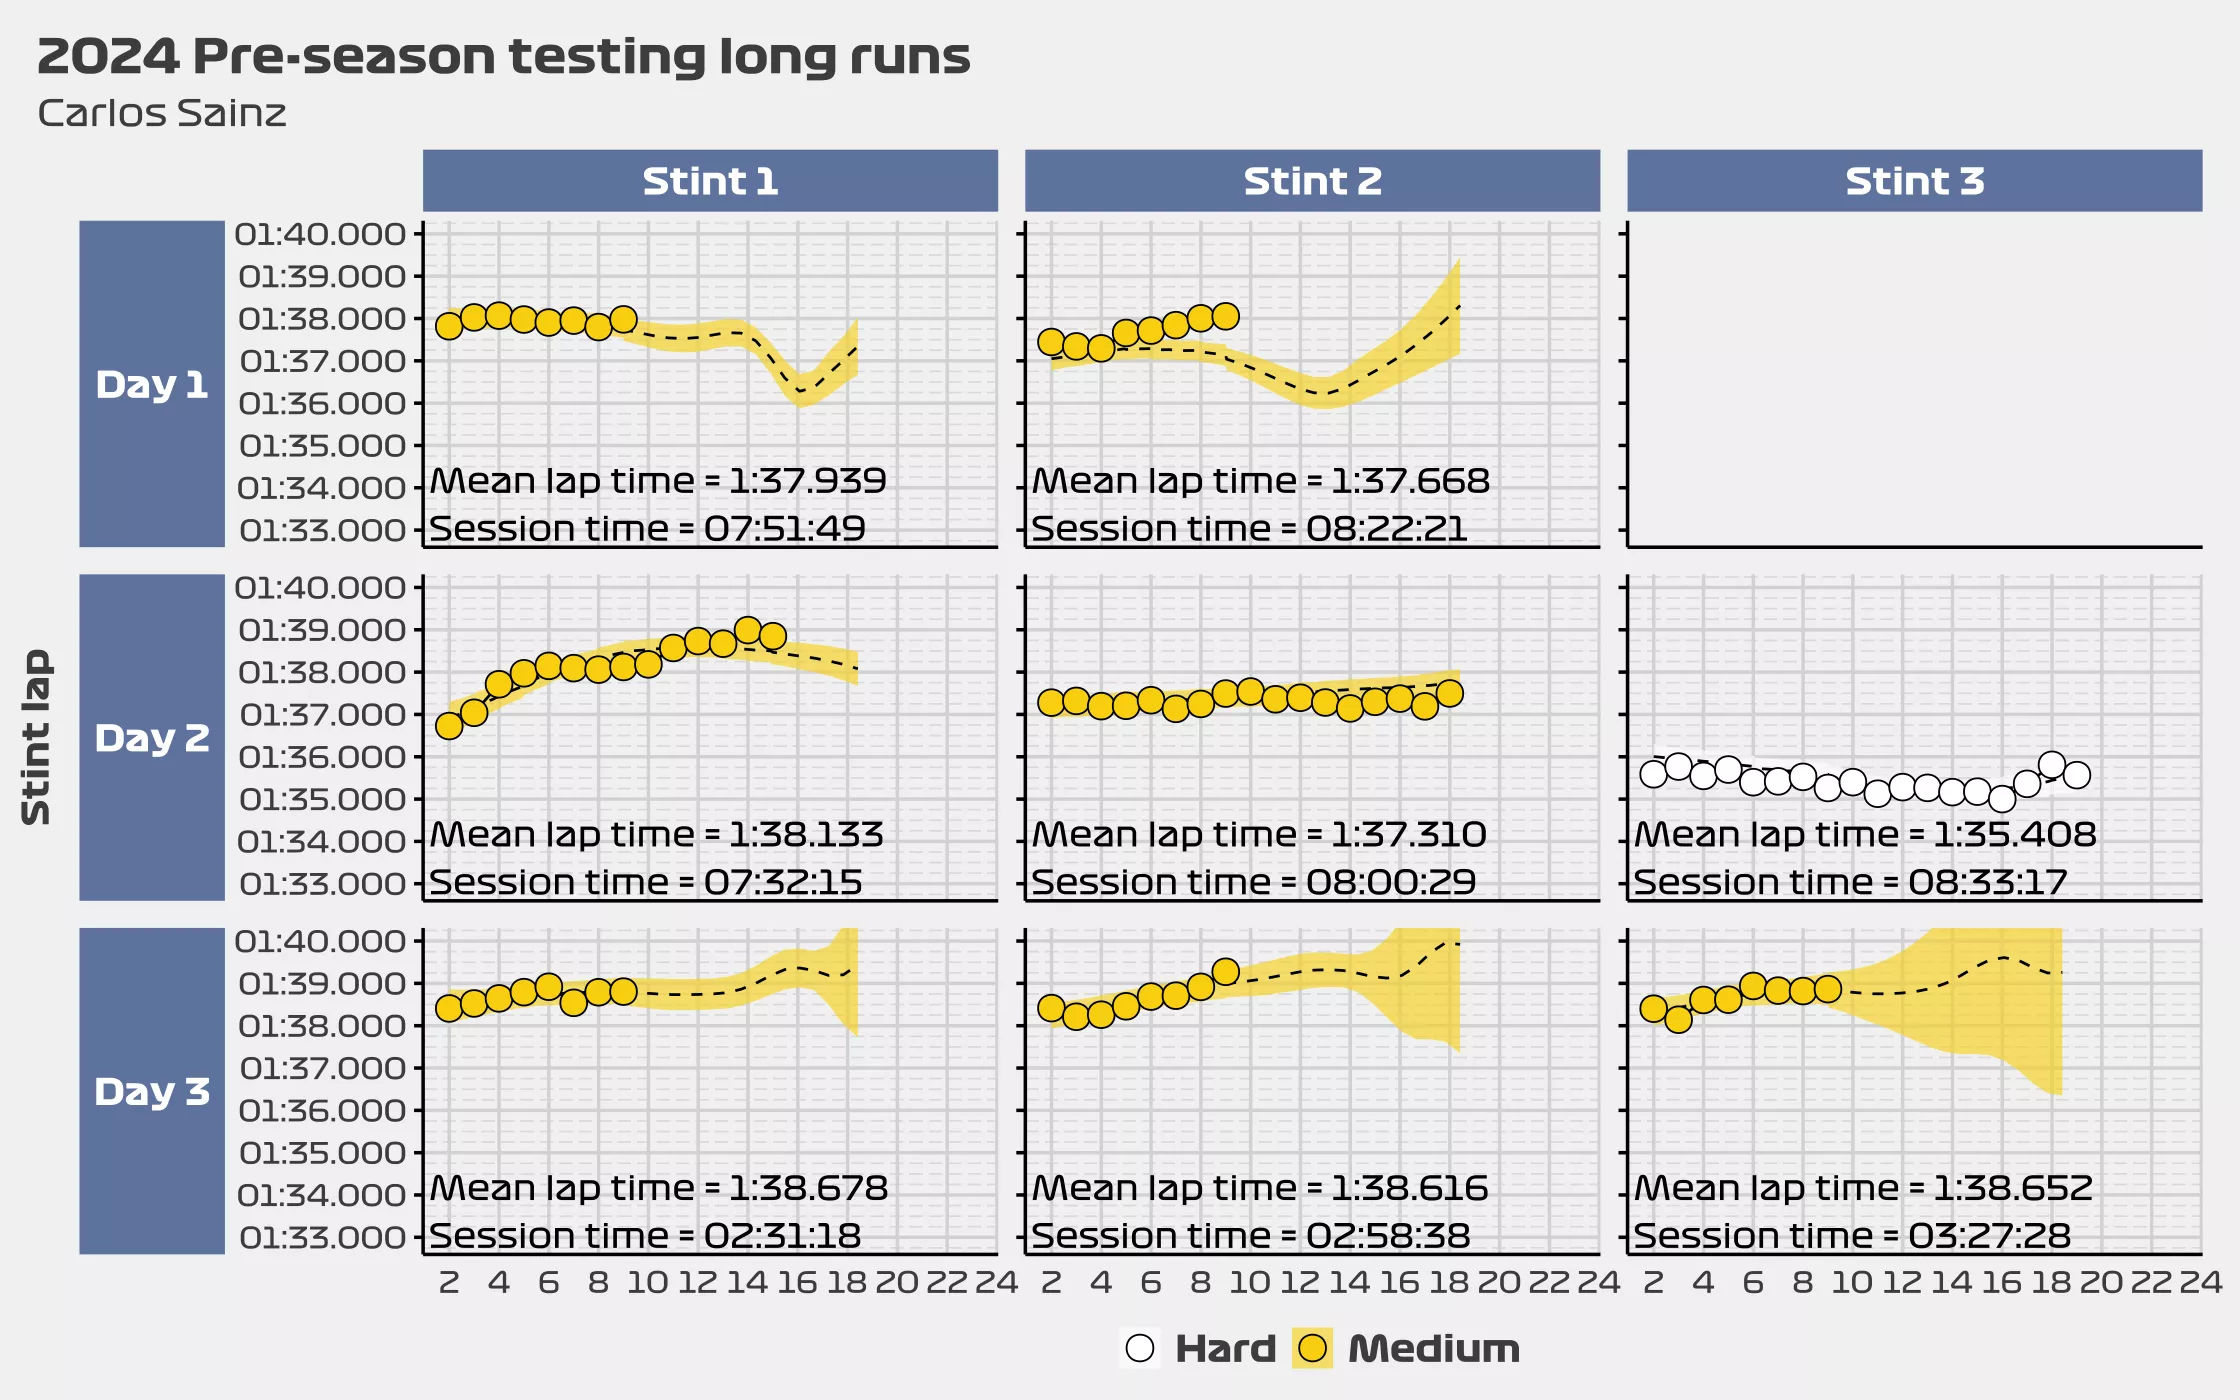
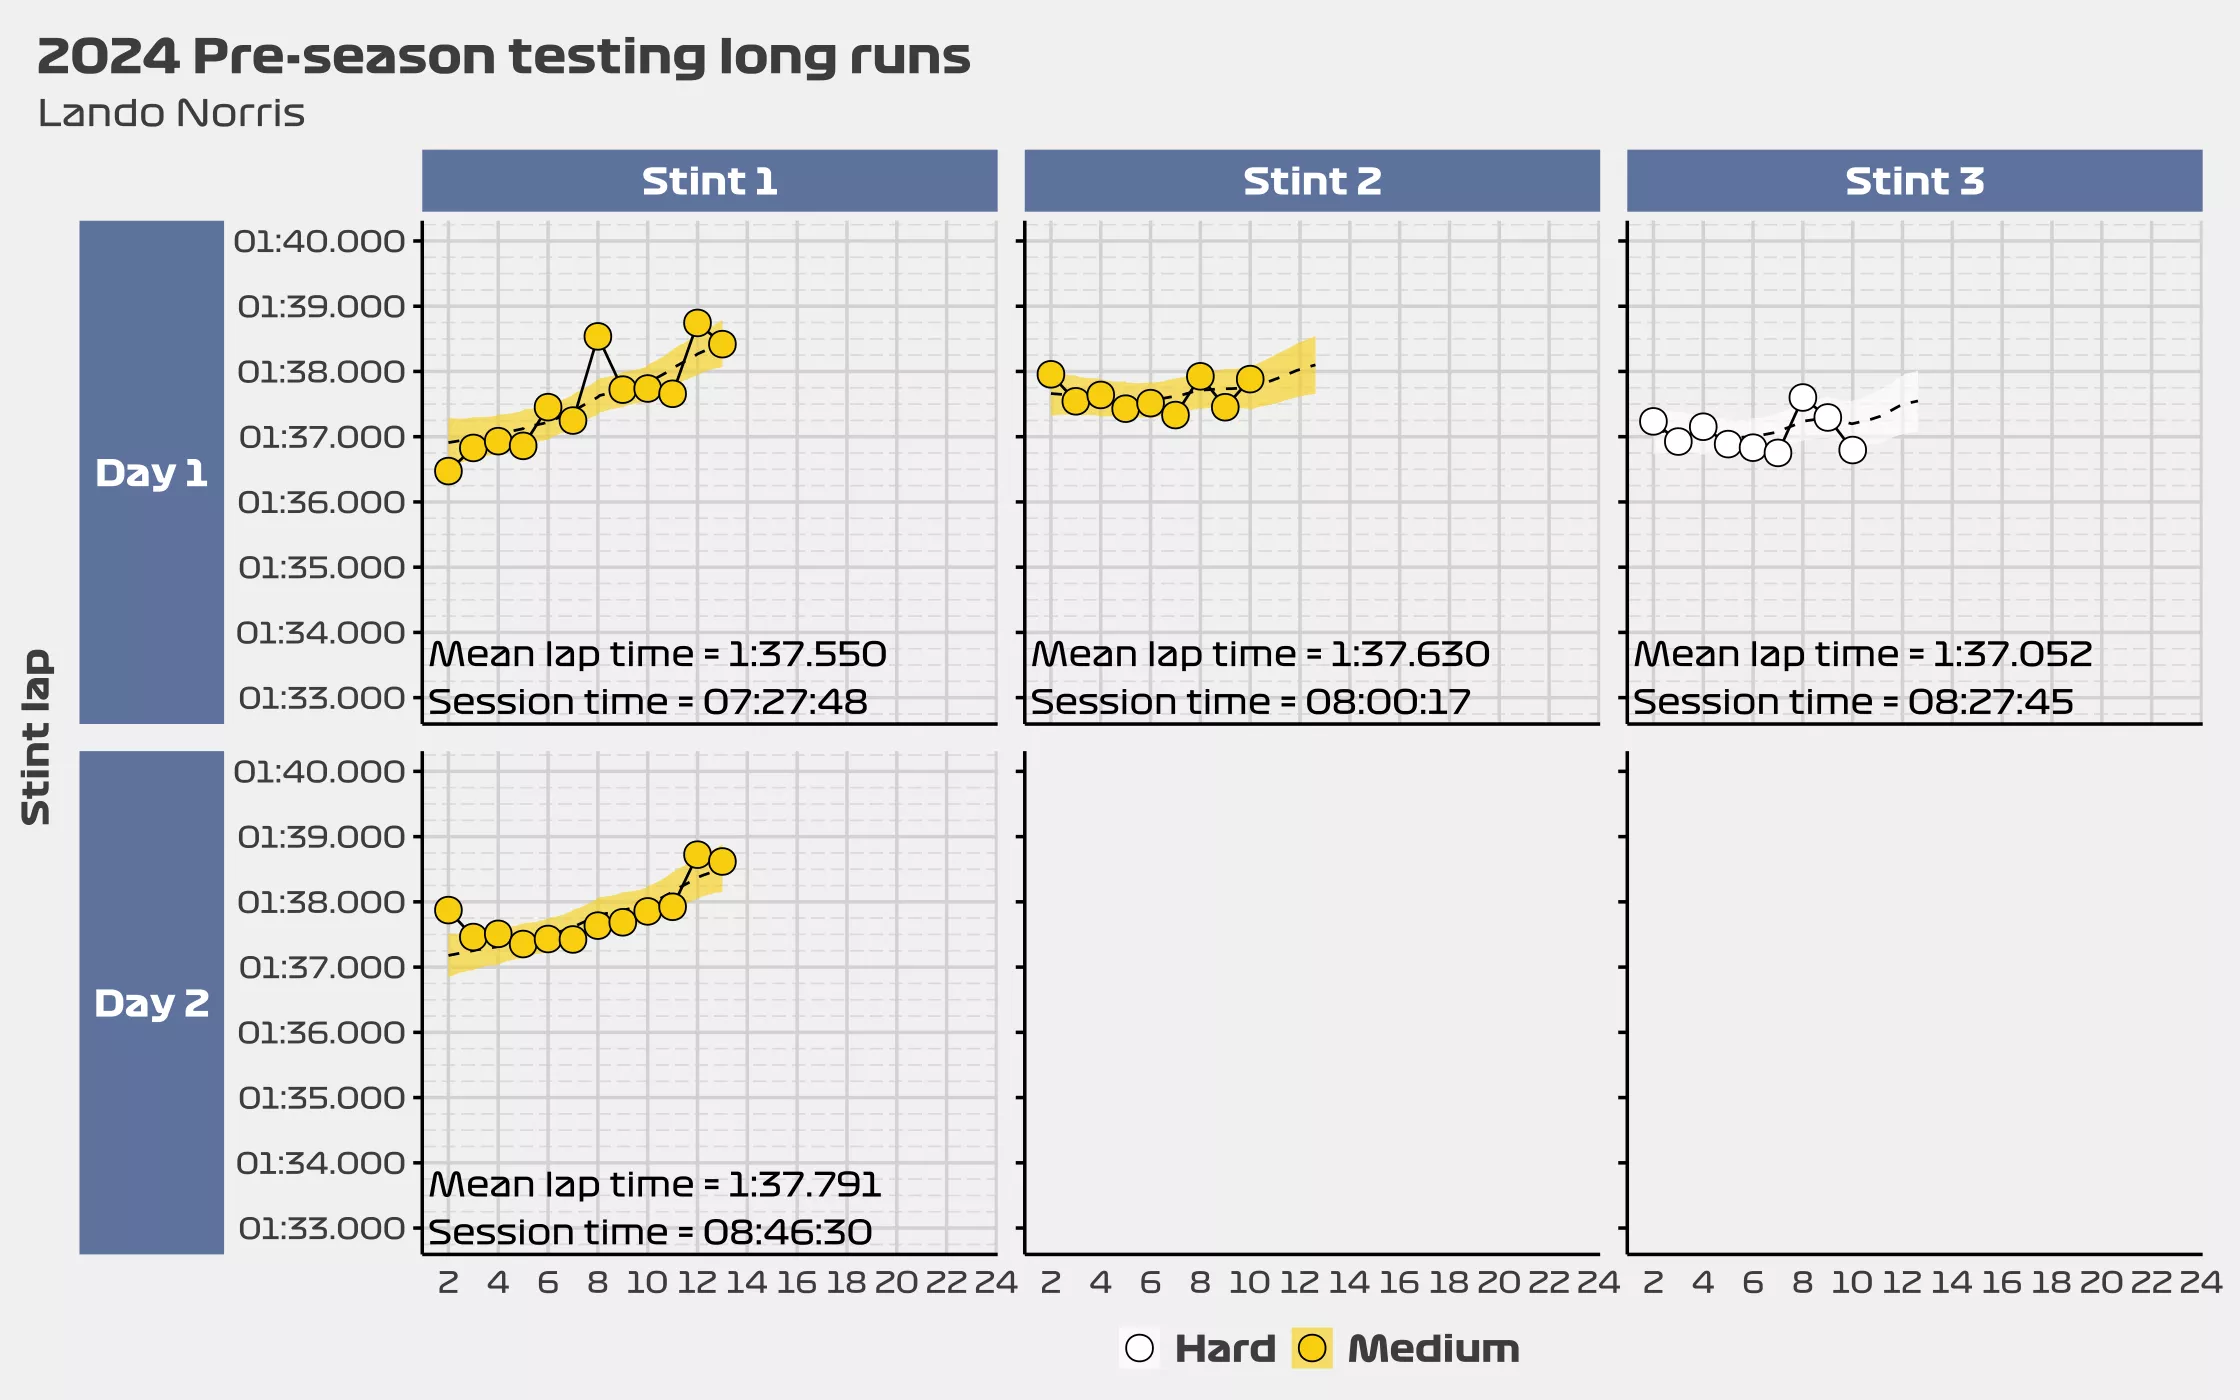
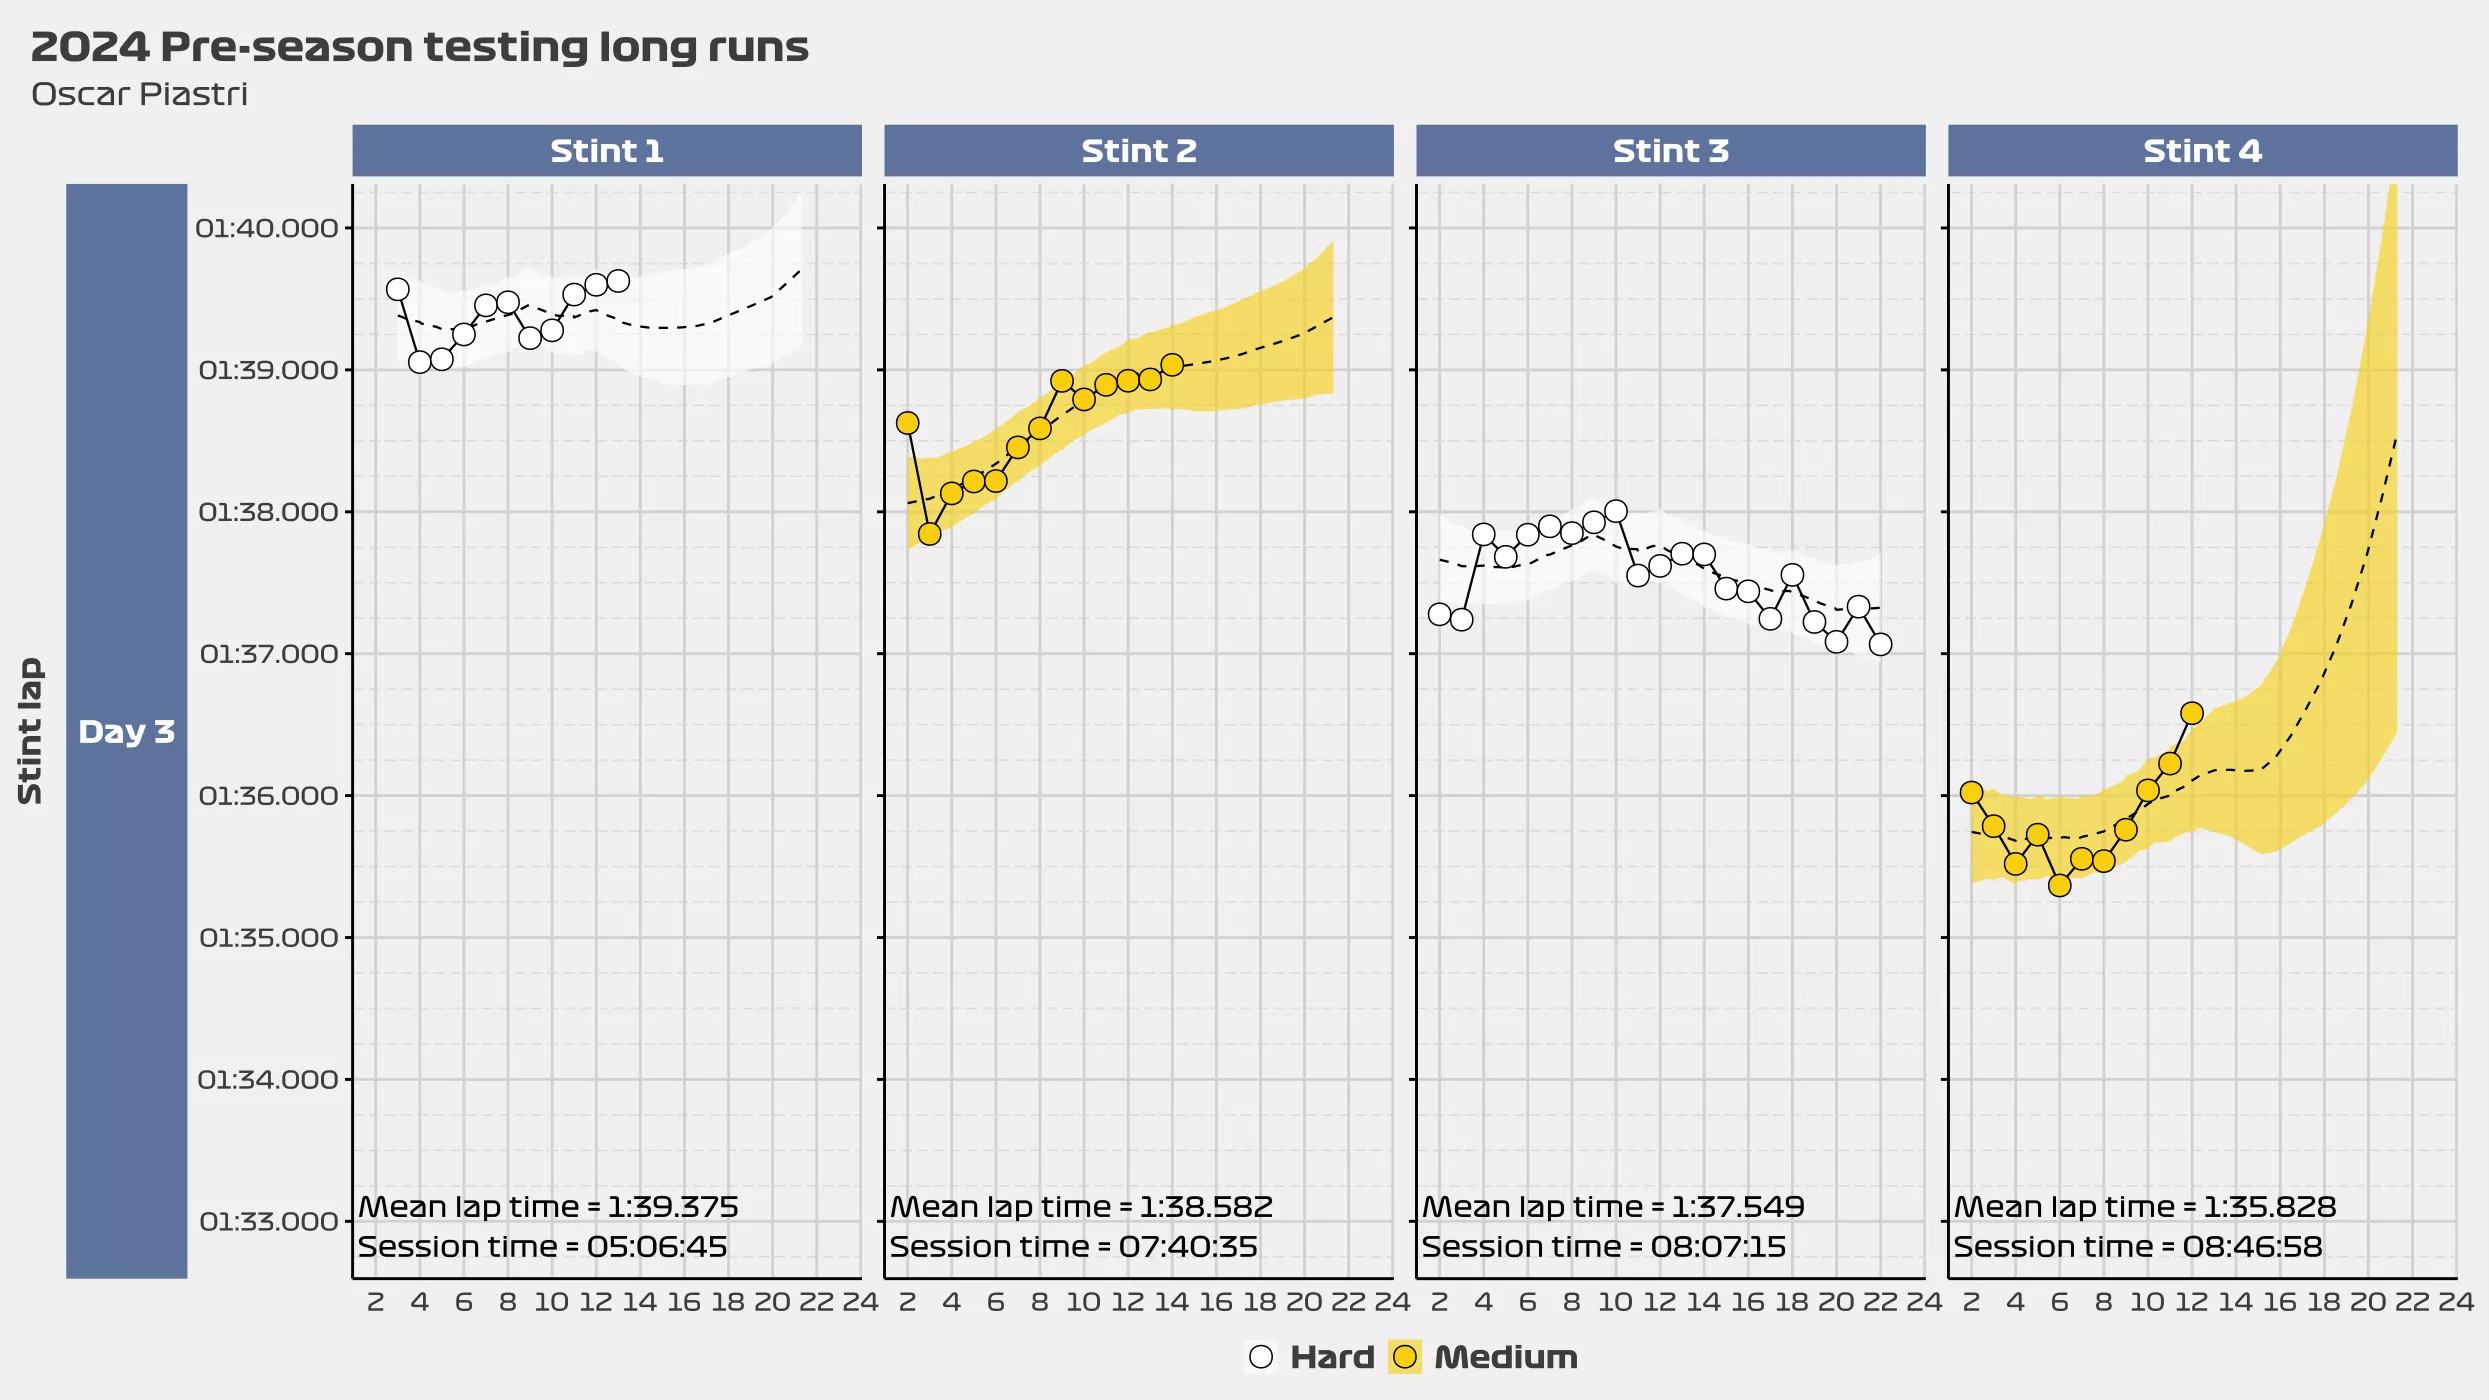
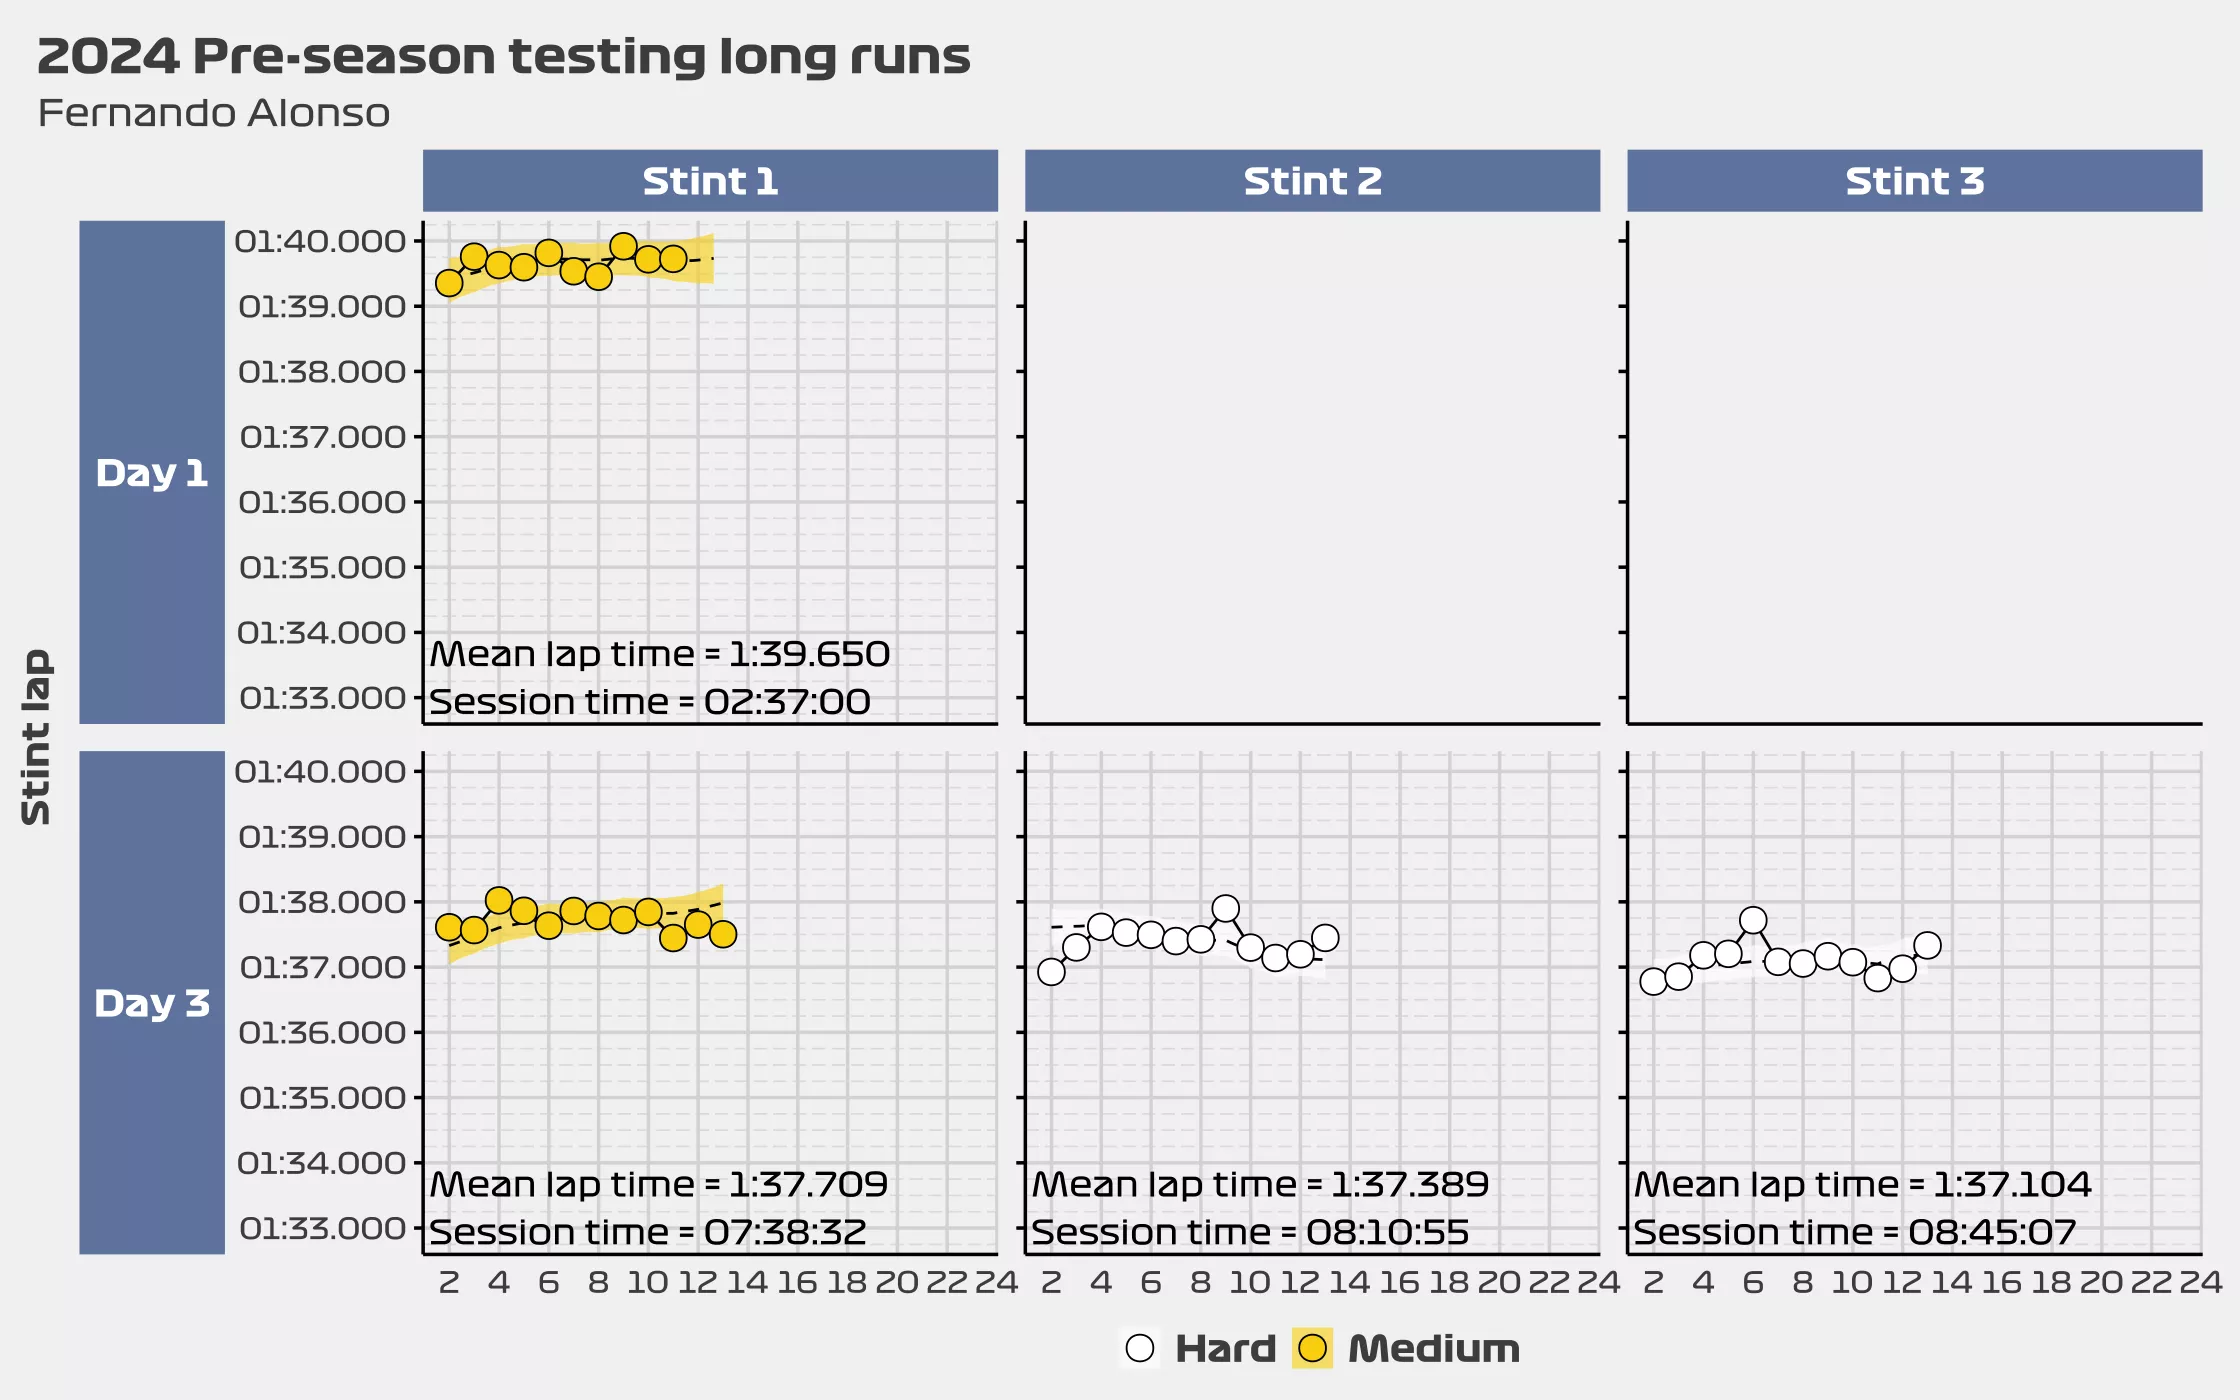
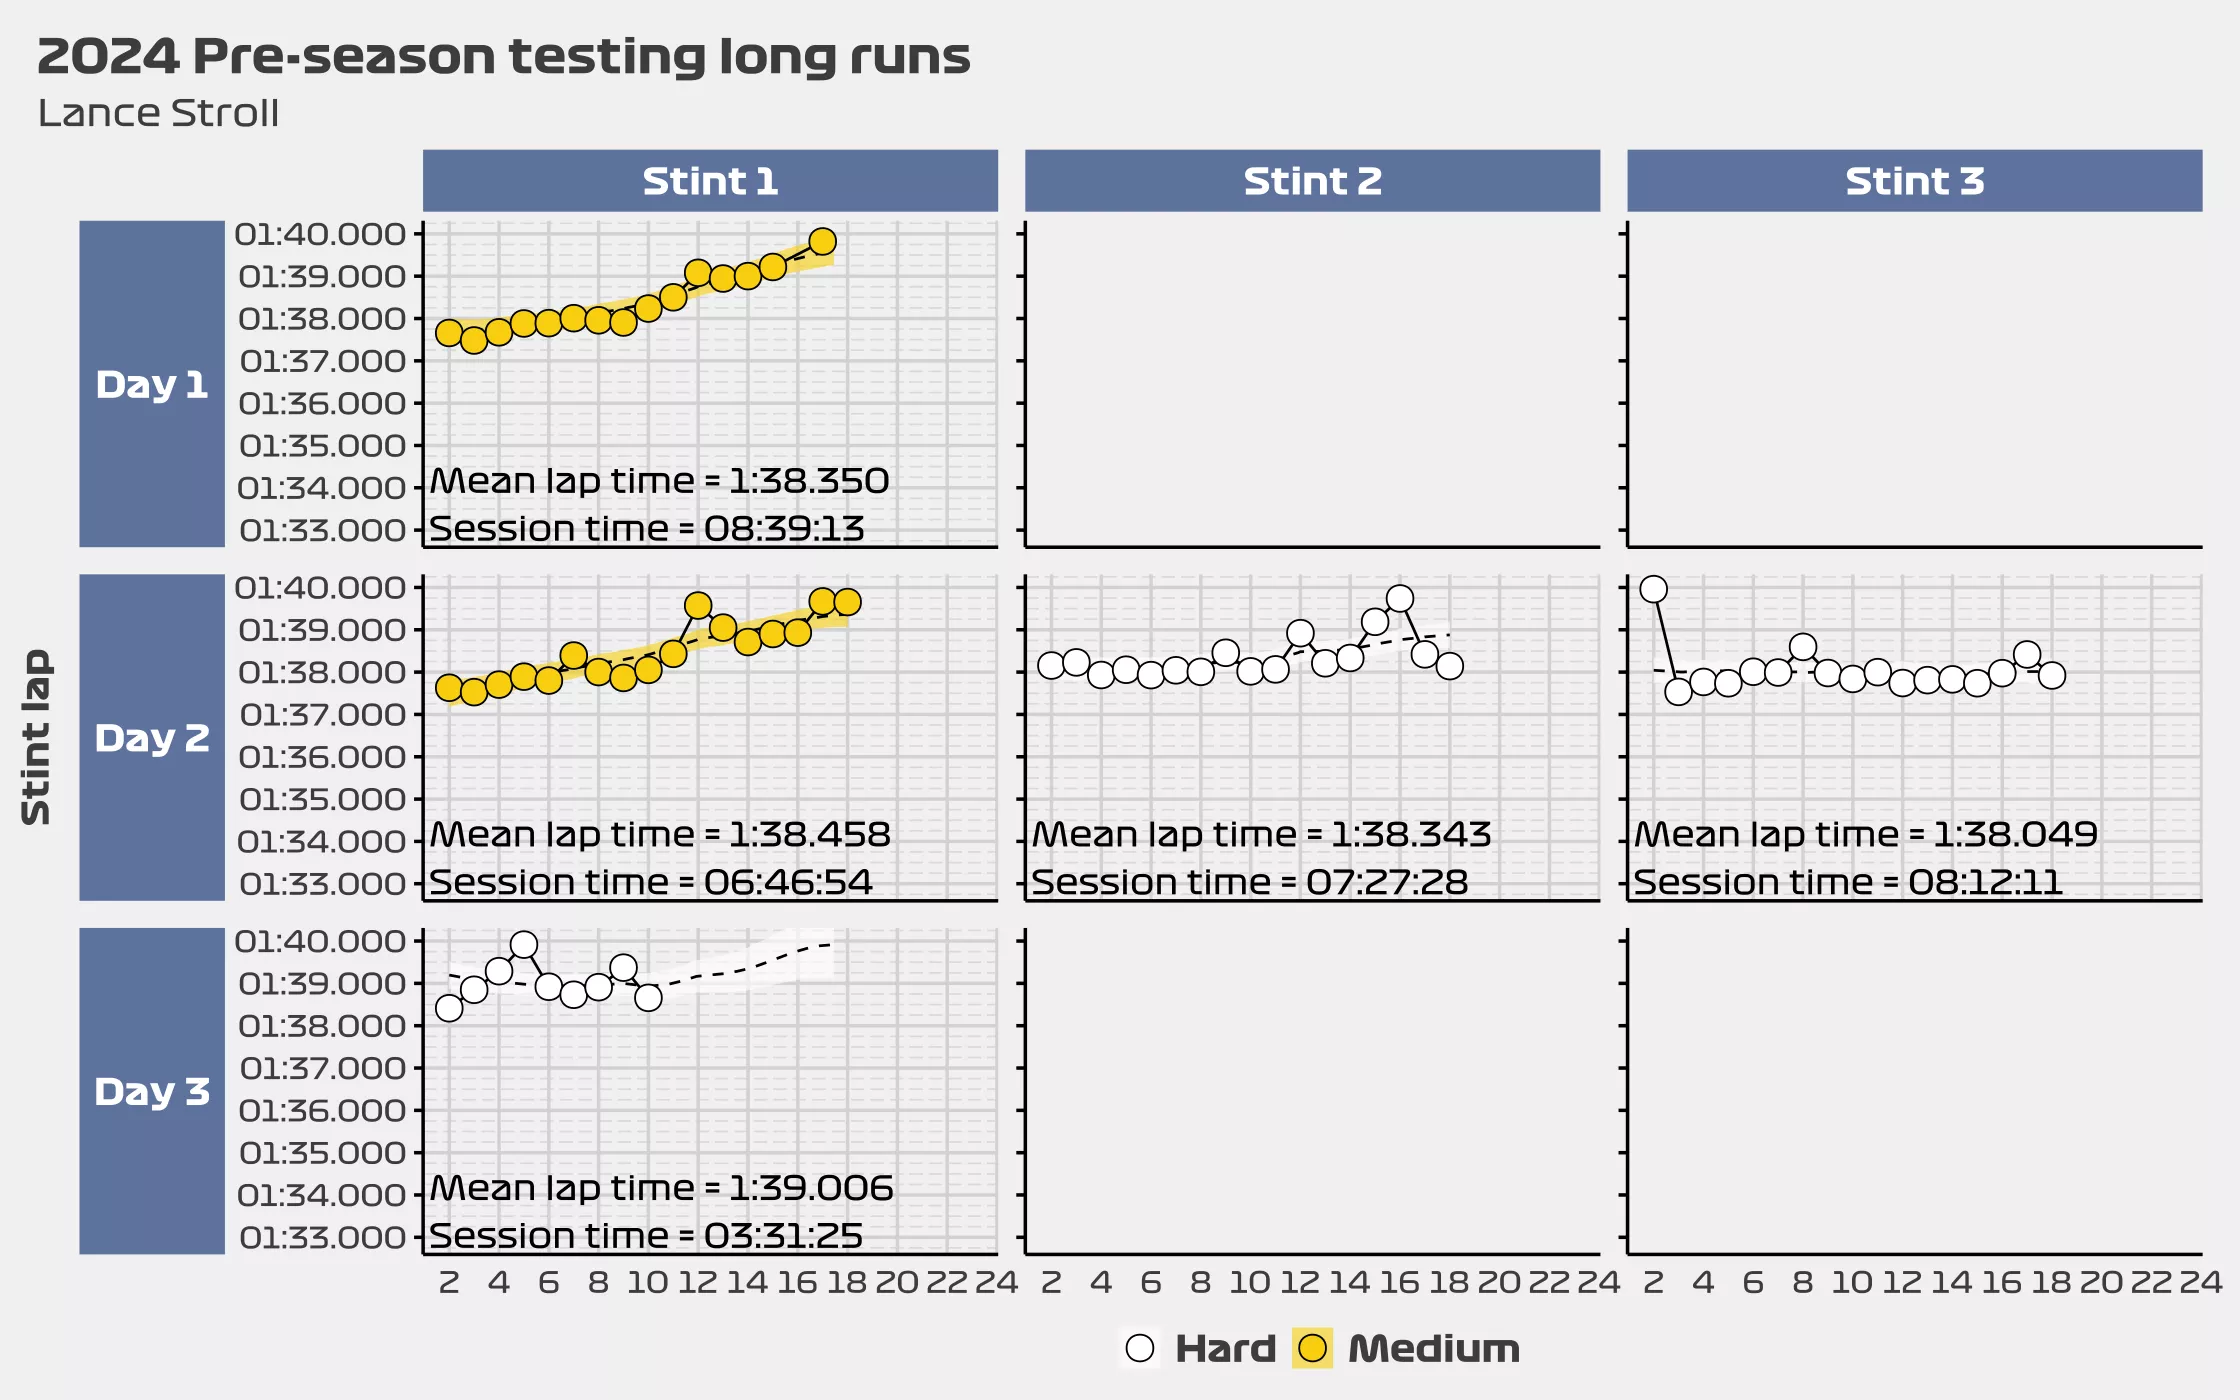
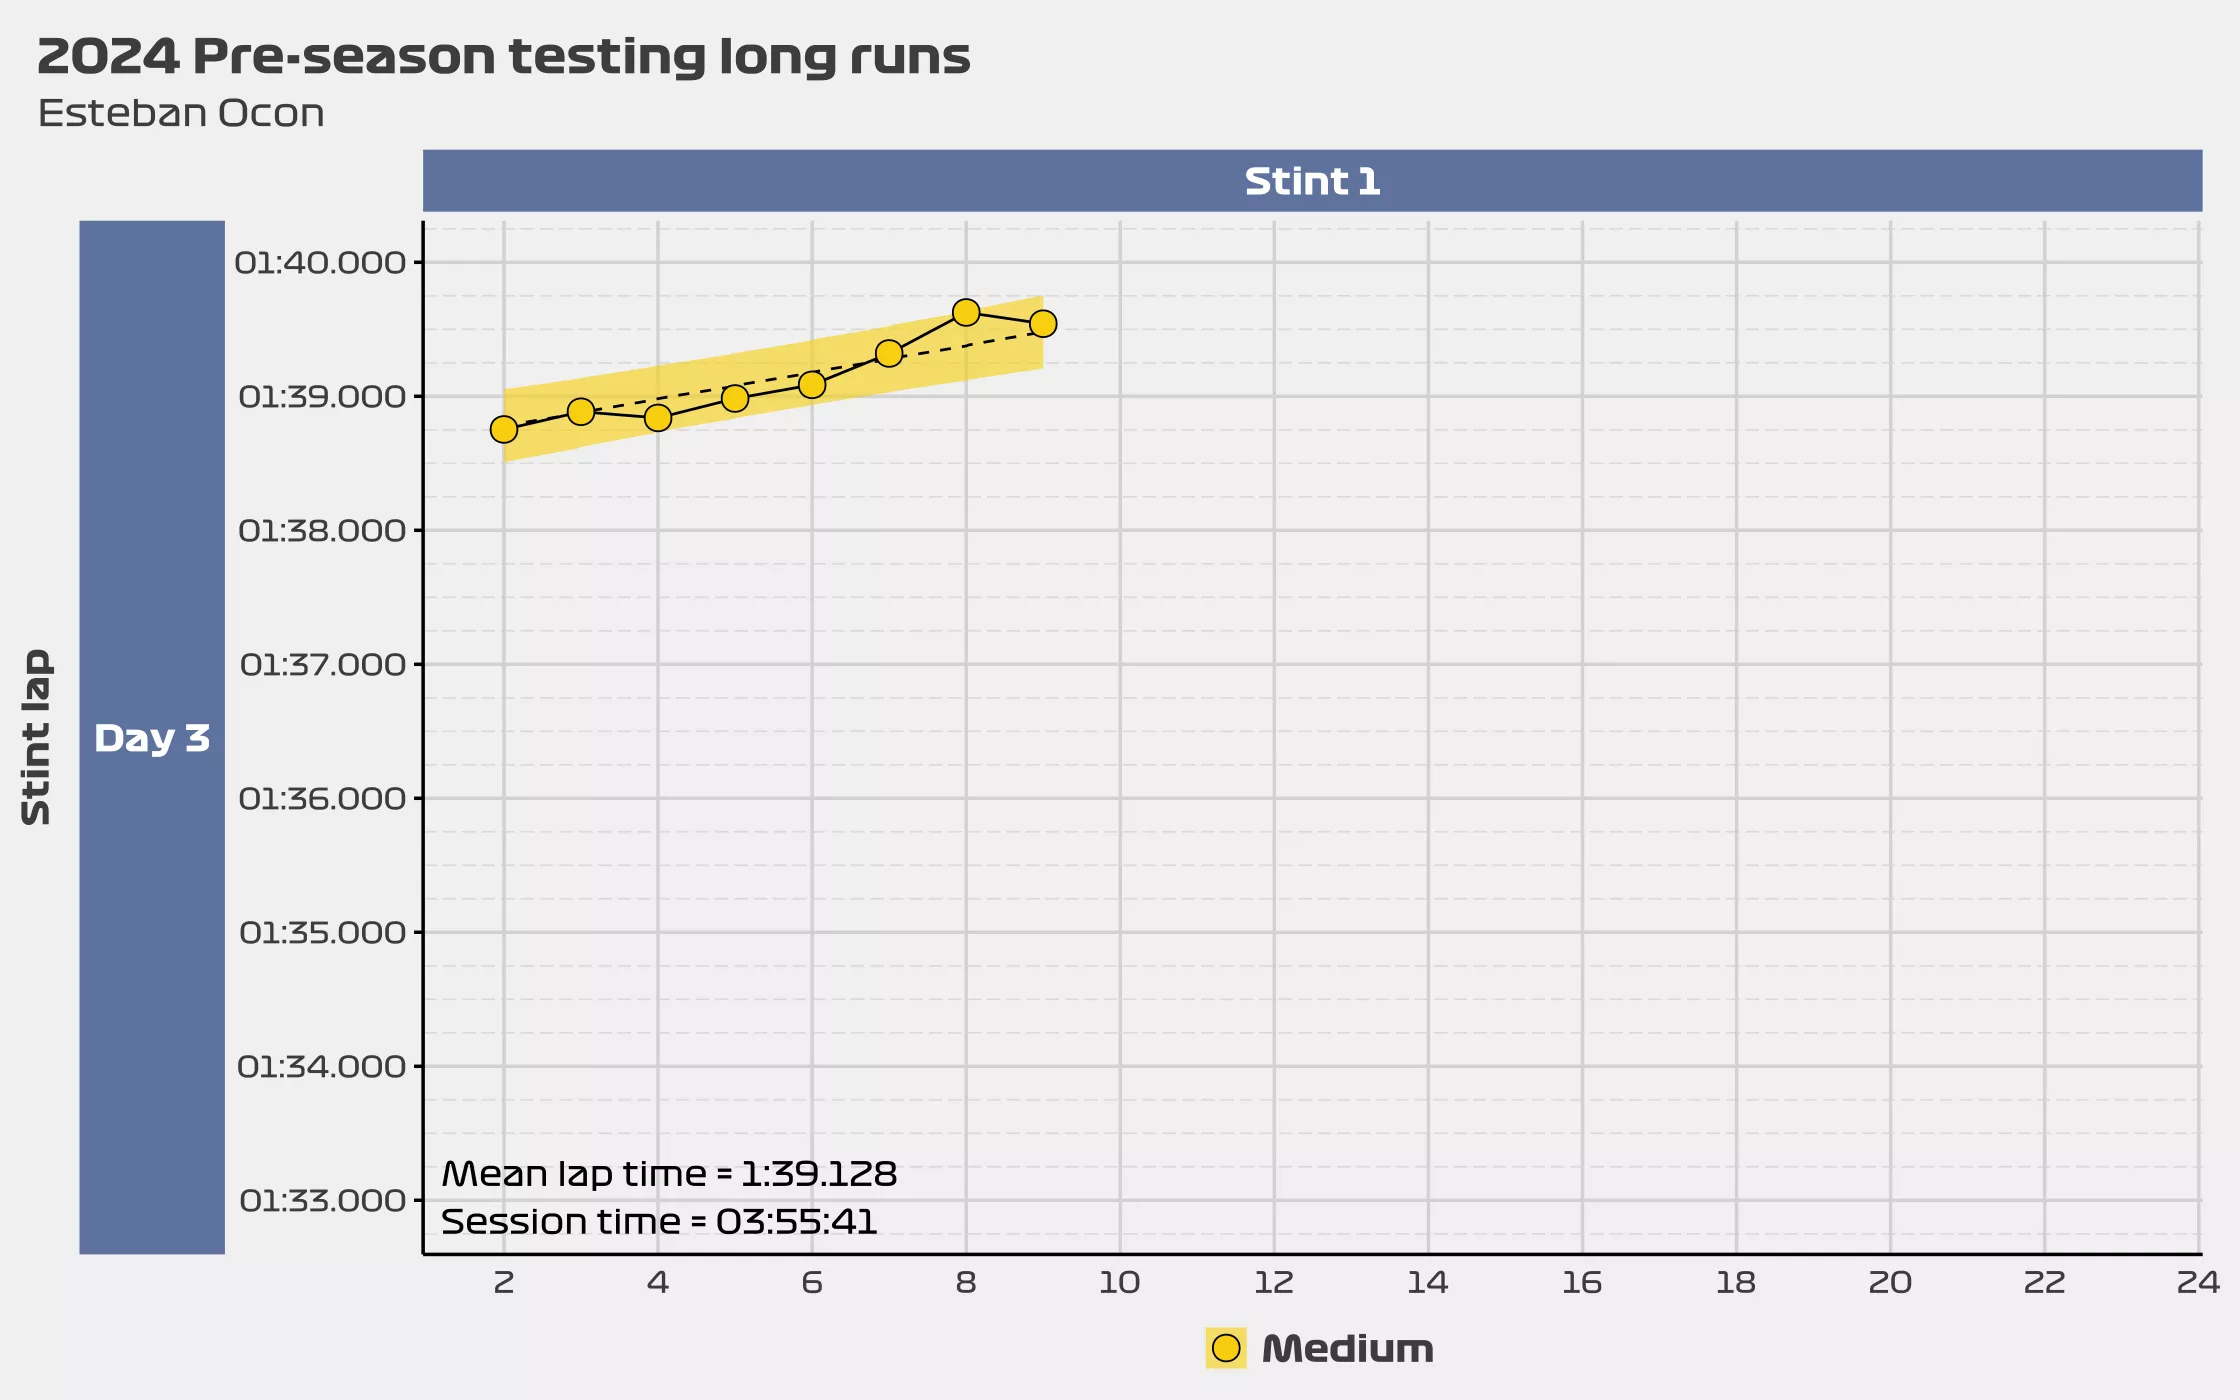
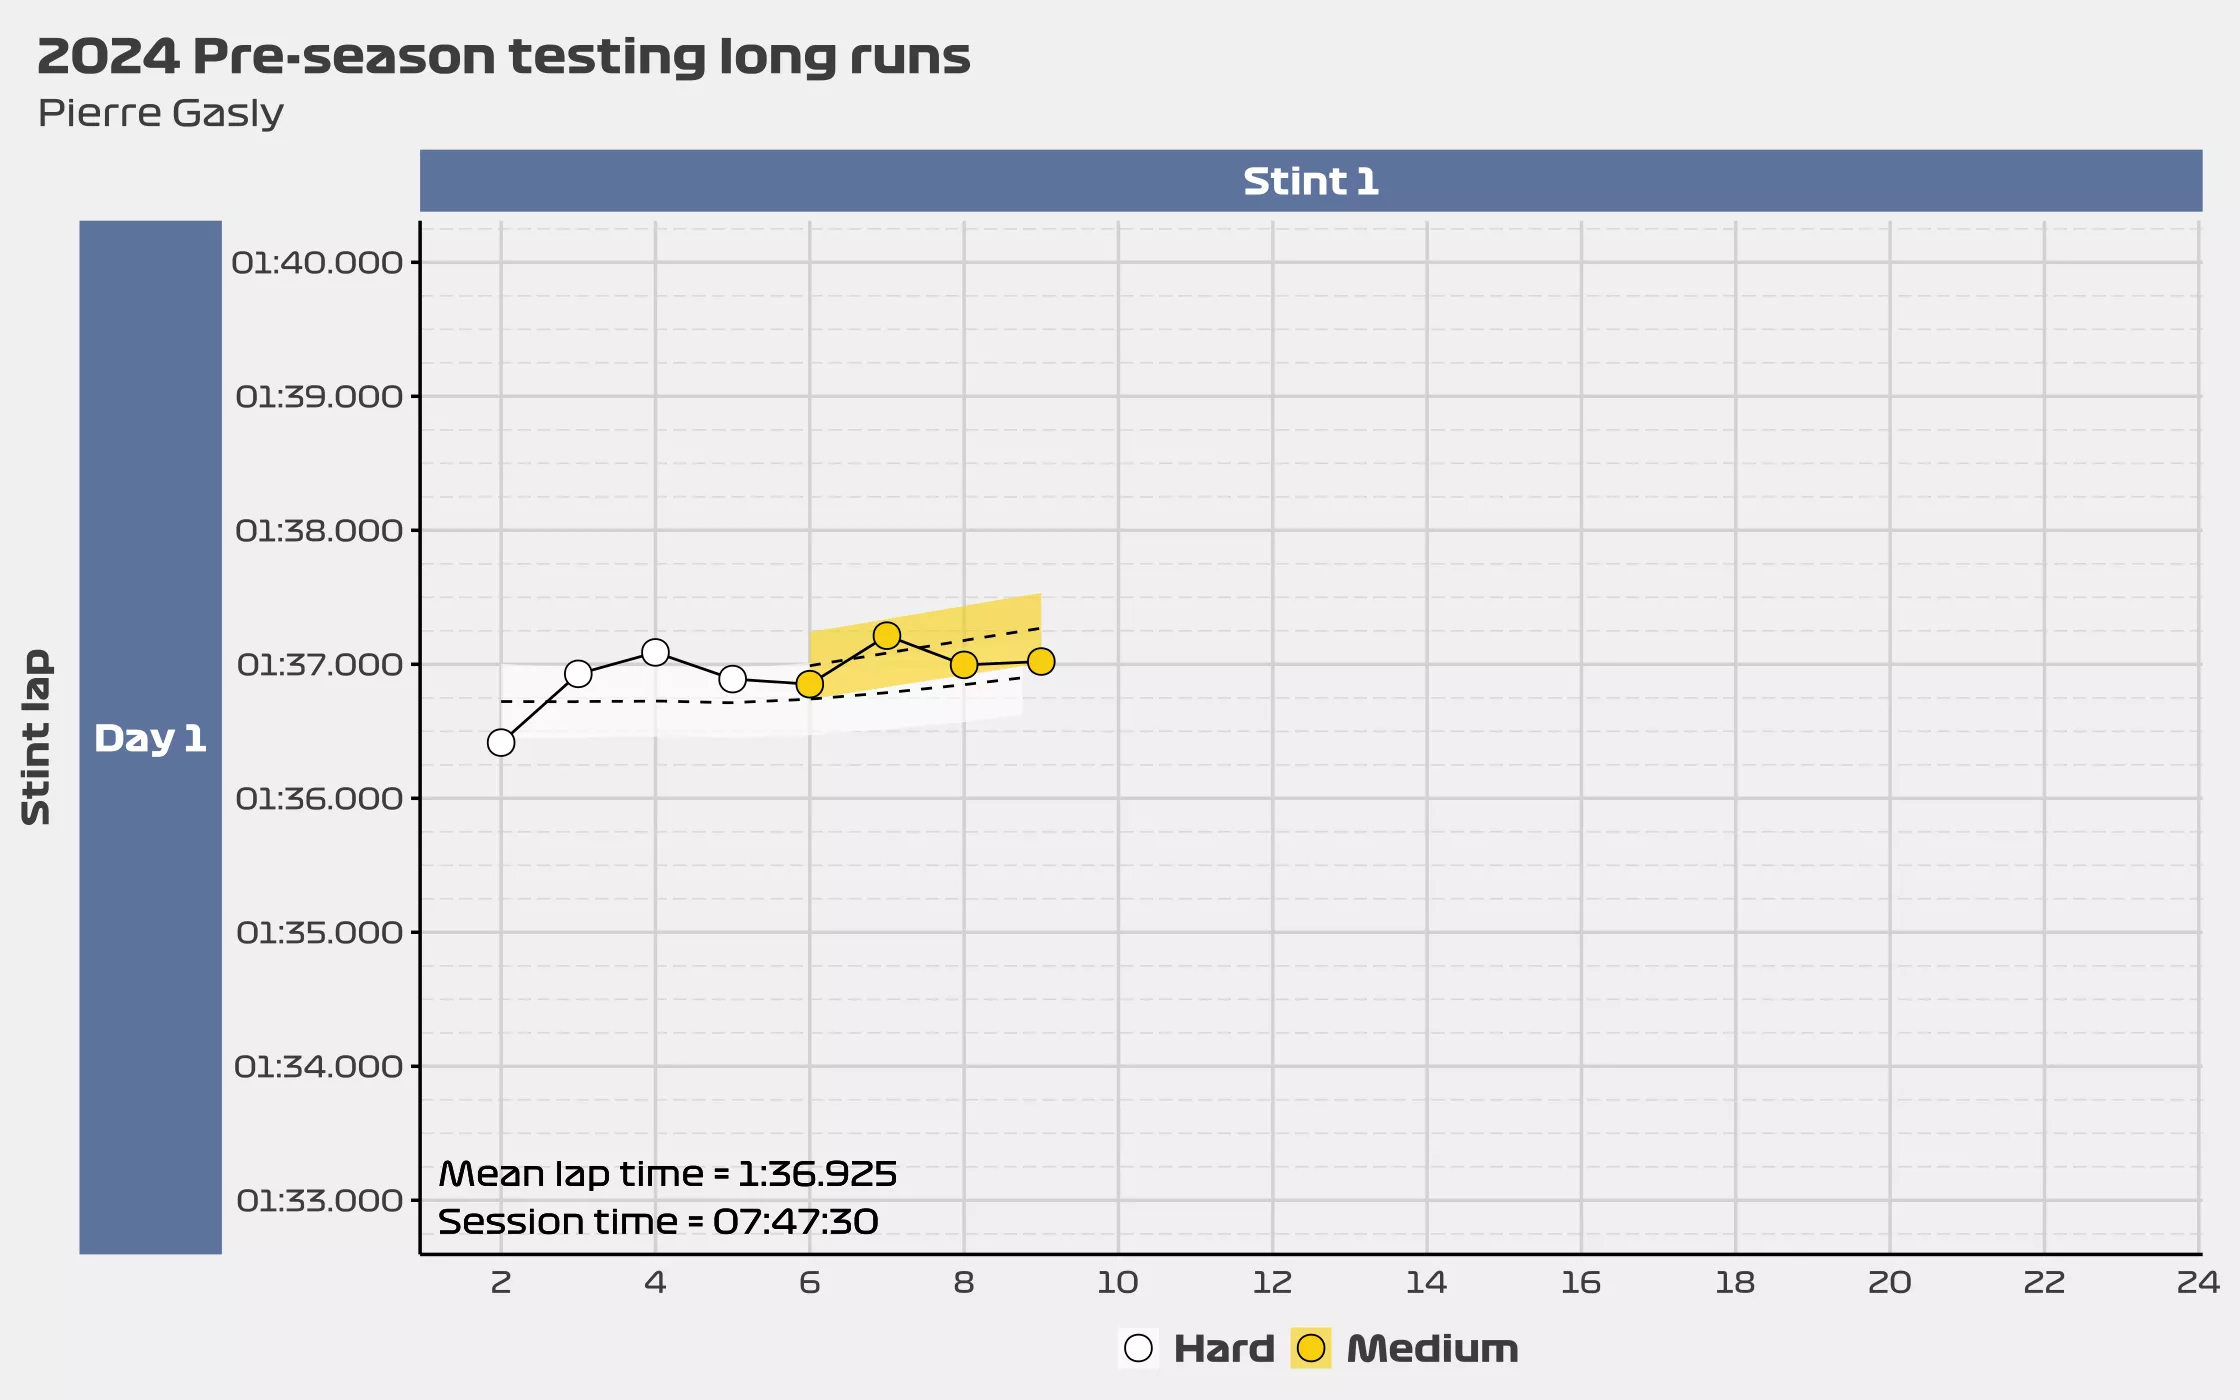
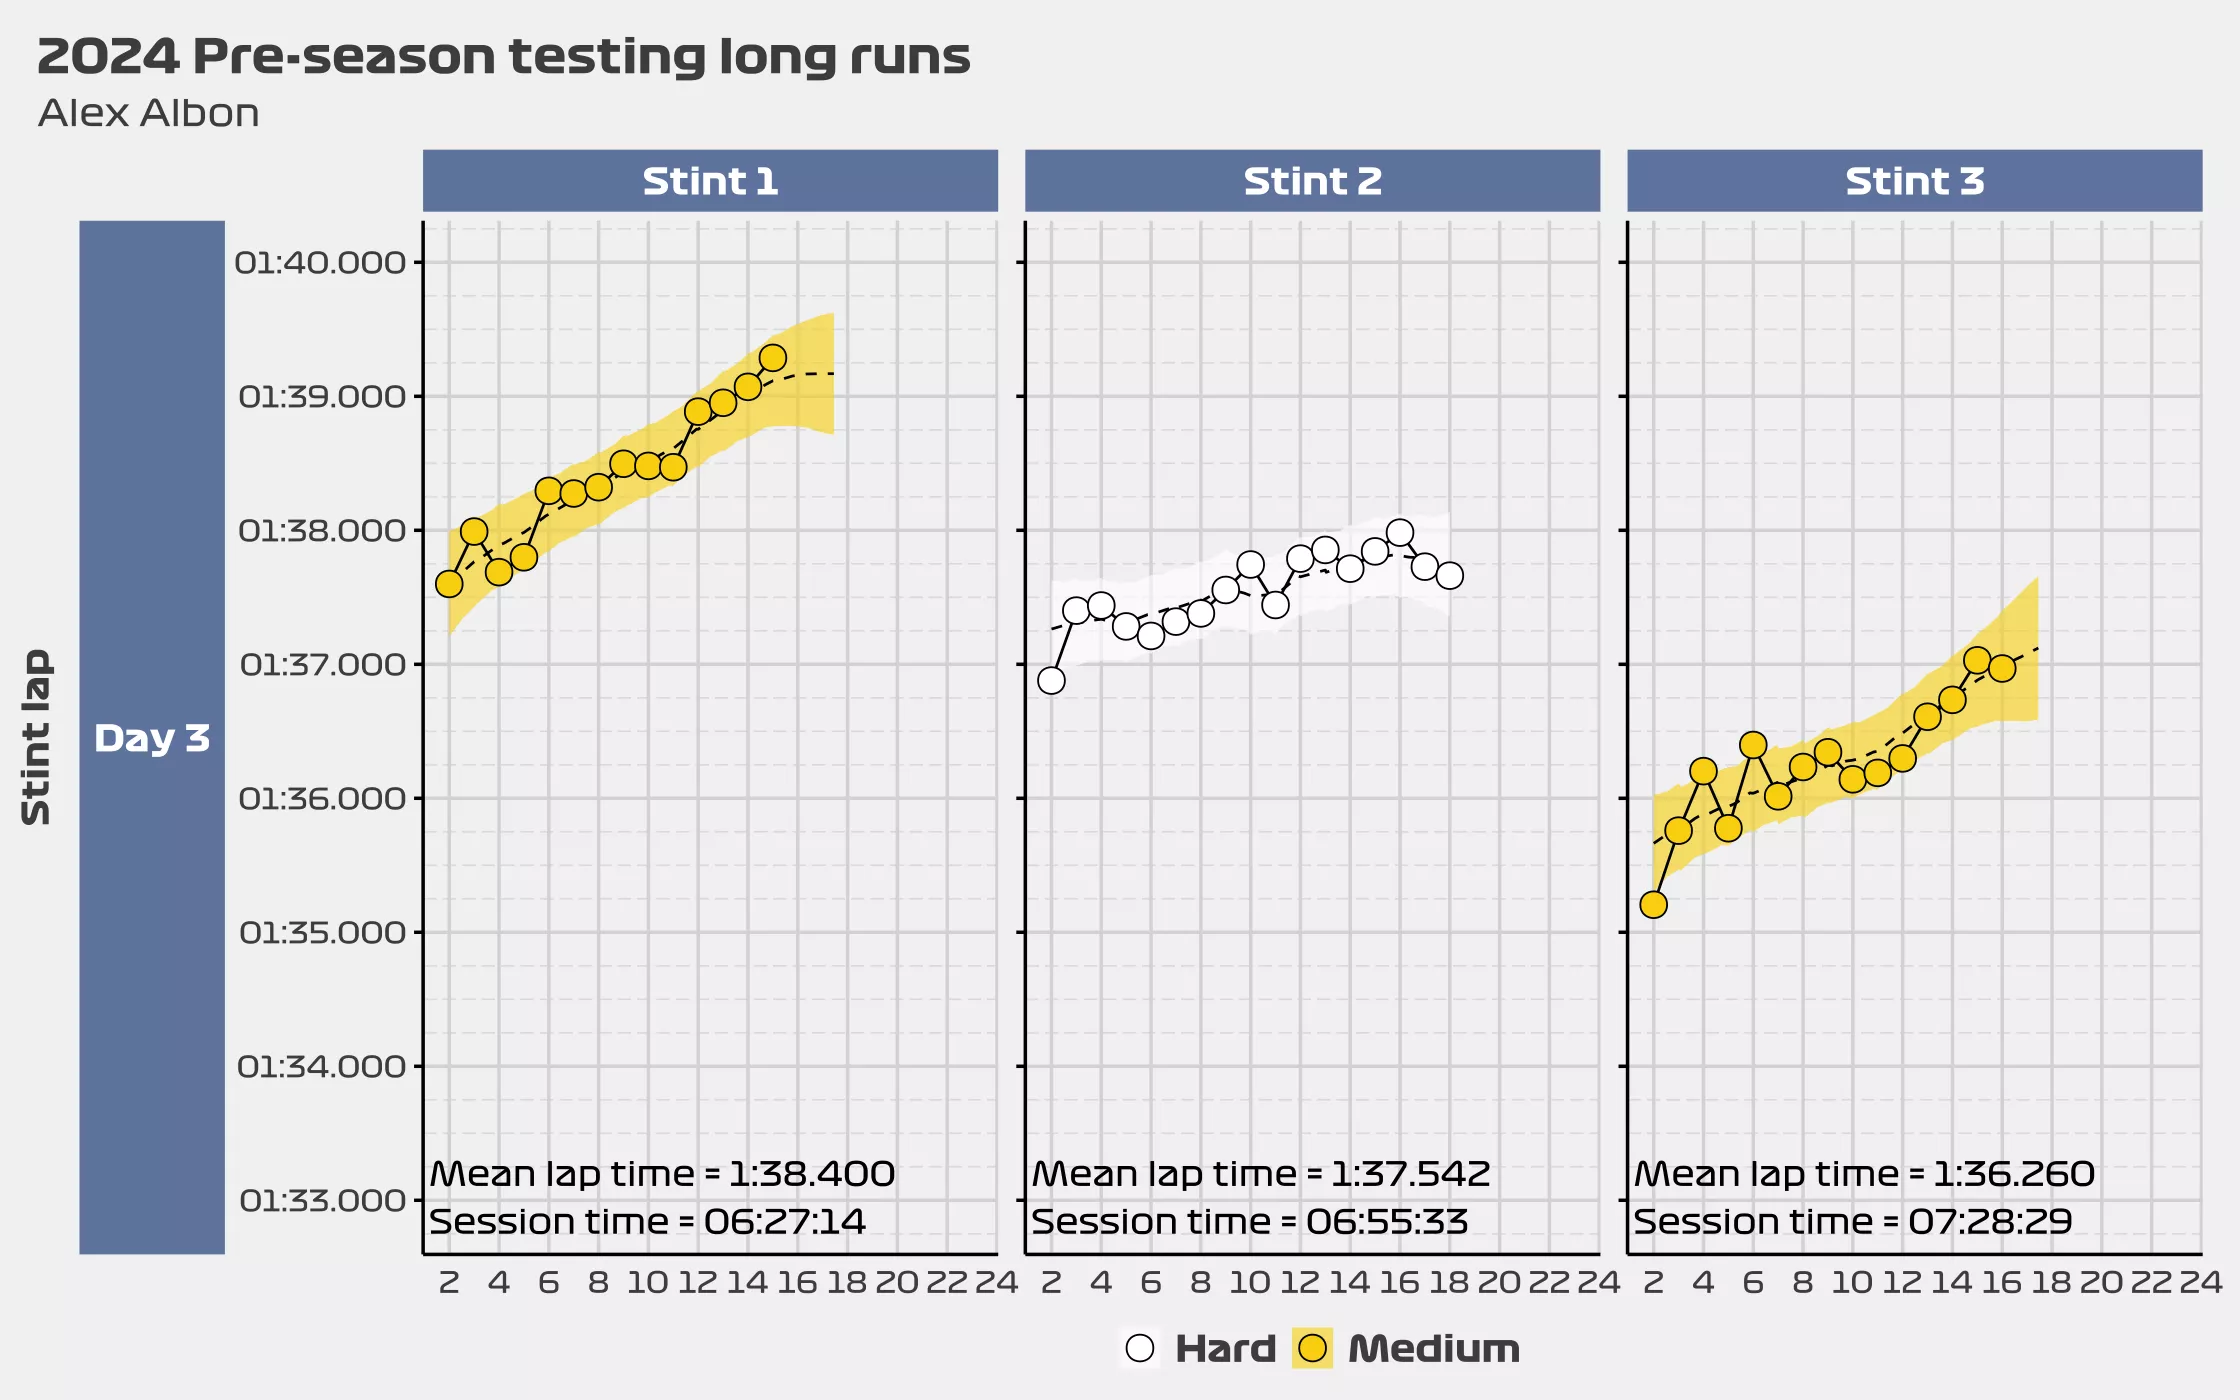
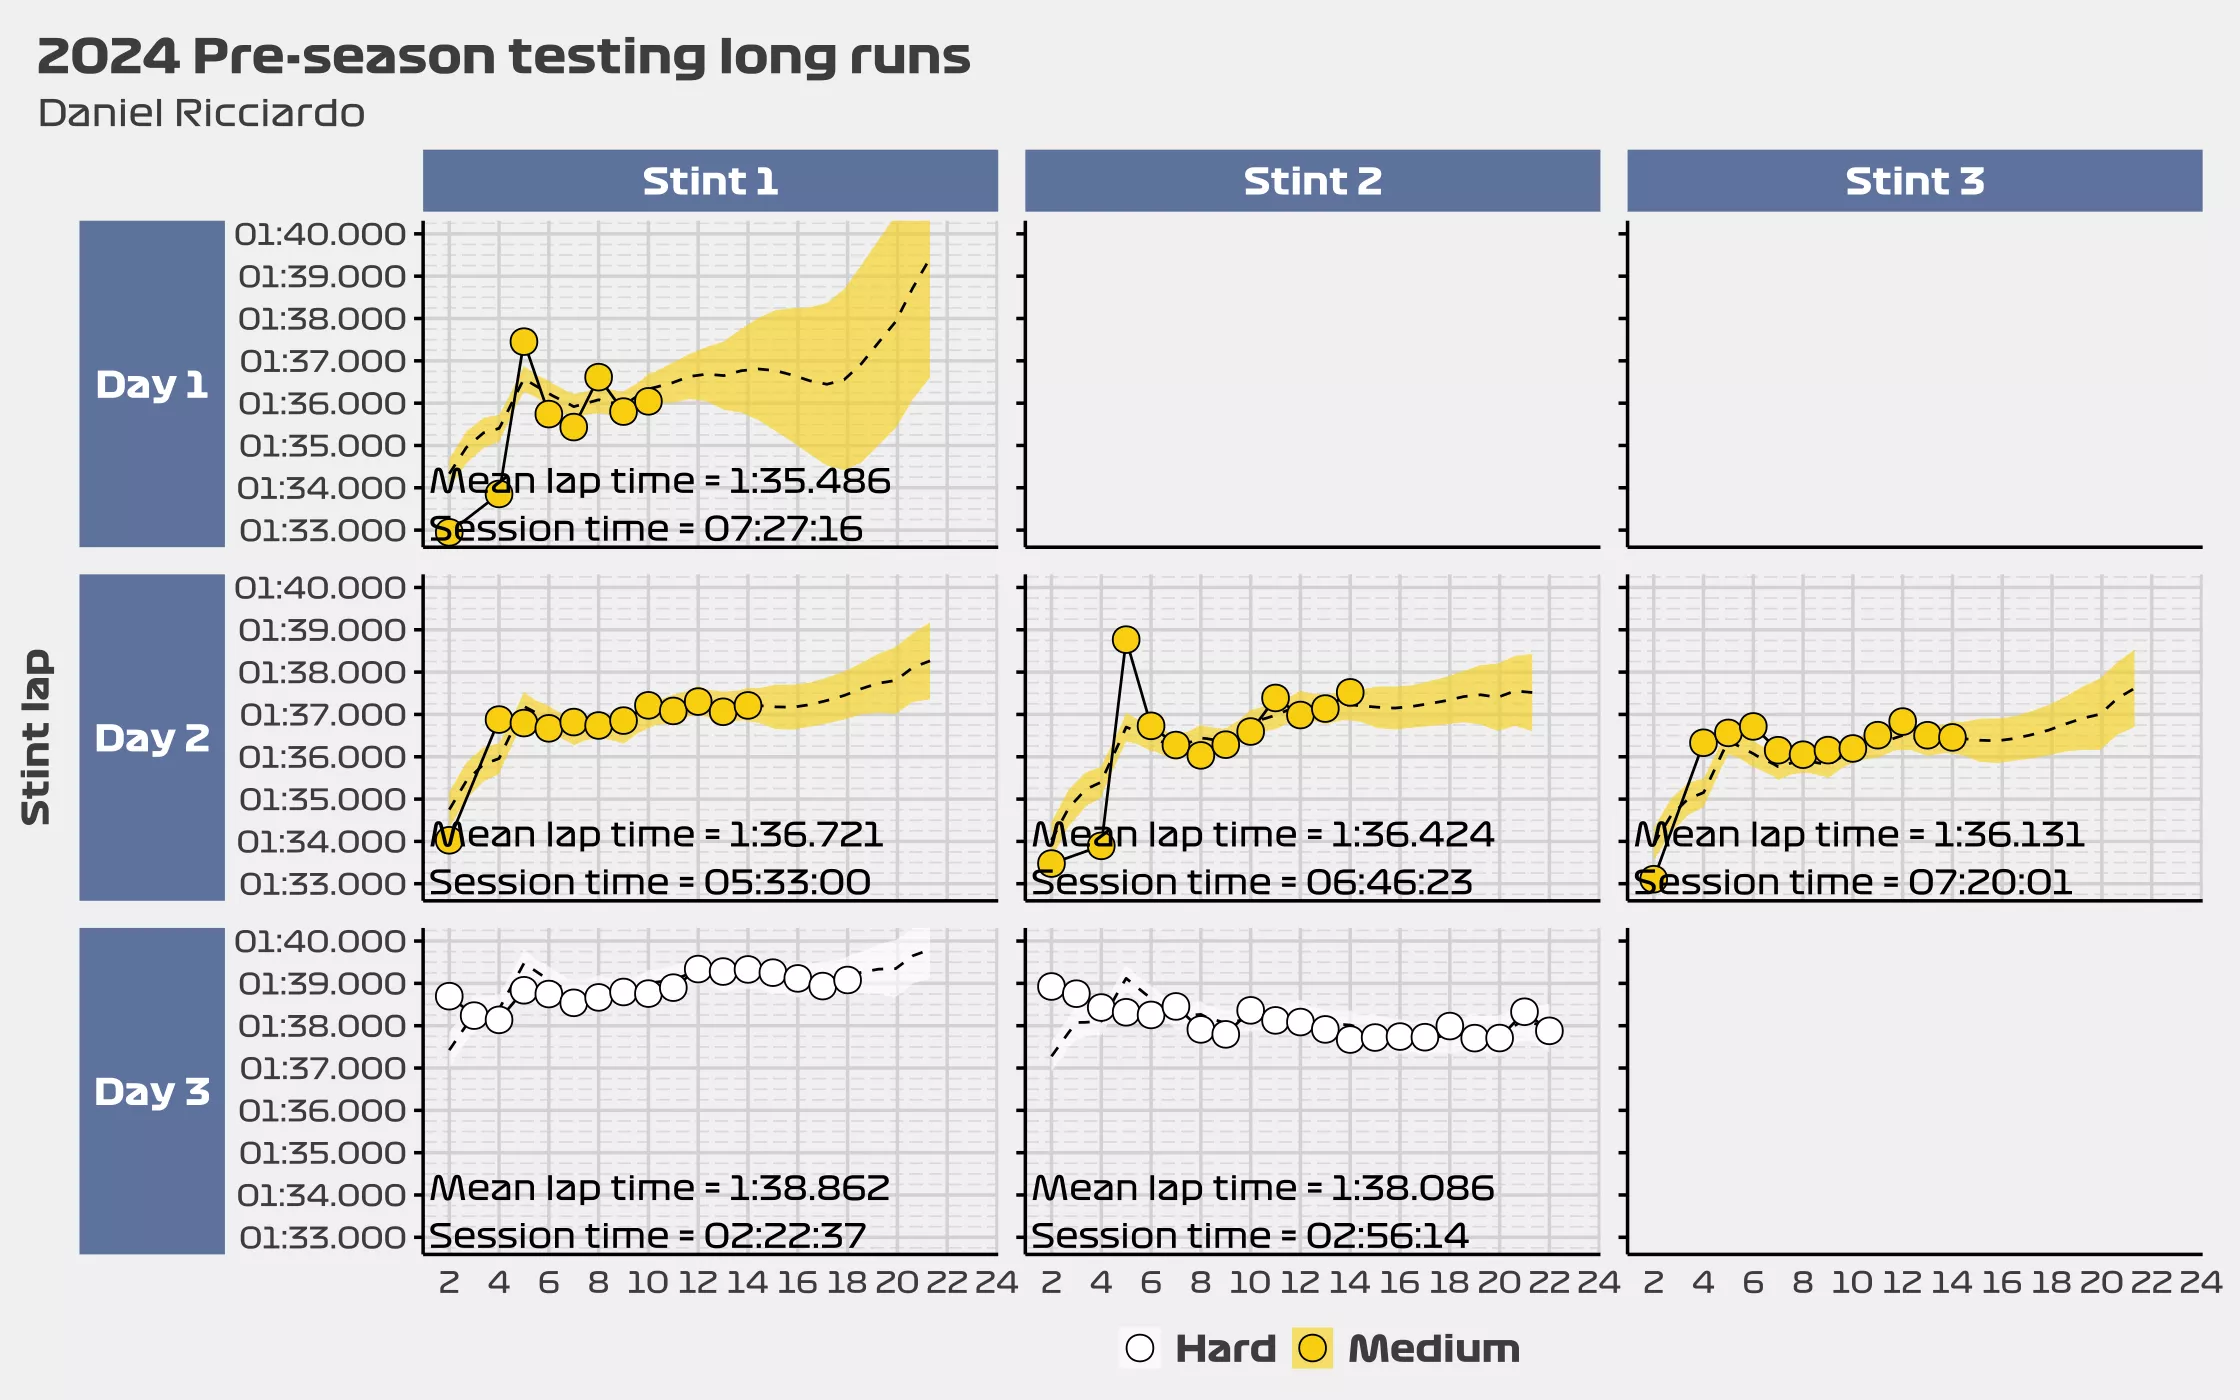
I just came up with these very simple charts. They show all of the long runs done by the drivers during the 2024 pre-season testing in Bahrain. I only kept runs with 8 or more laps and the charts show when did each stint started so that you can have an idea if they were at the beginning or end of a testing session.
The dashed line shows a smoothed estimate created by a statistical model, while the ribbon area shows the confidence interval for that estimate. The model is not perfect, but it should show an accurate representation of each run for most of the runs done by the drivers.
I wasn’t really going to do anything for testing. In fact, I’m still not sure if I will continue this blog at all since I’m busier than before and this project is a money pit. I will not run ads in this site just because I hate them, but that means that I get 0 income from this website.
Anyways, something is better than nothing (I guess?). Enjoy.
Red Bull
Mercedes
Ferrari
McLaren
Aston Martin
Alpine
Williams
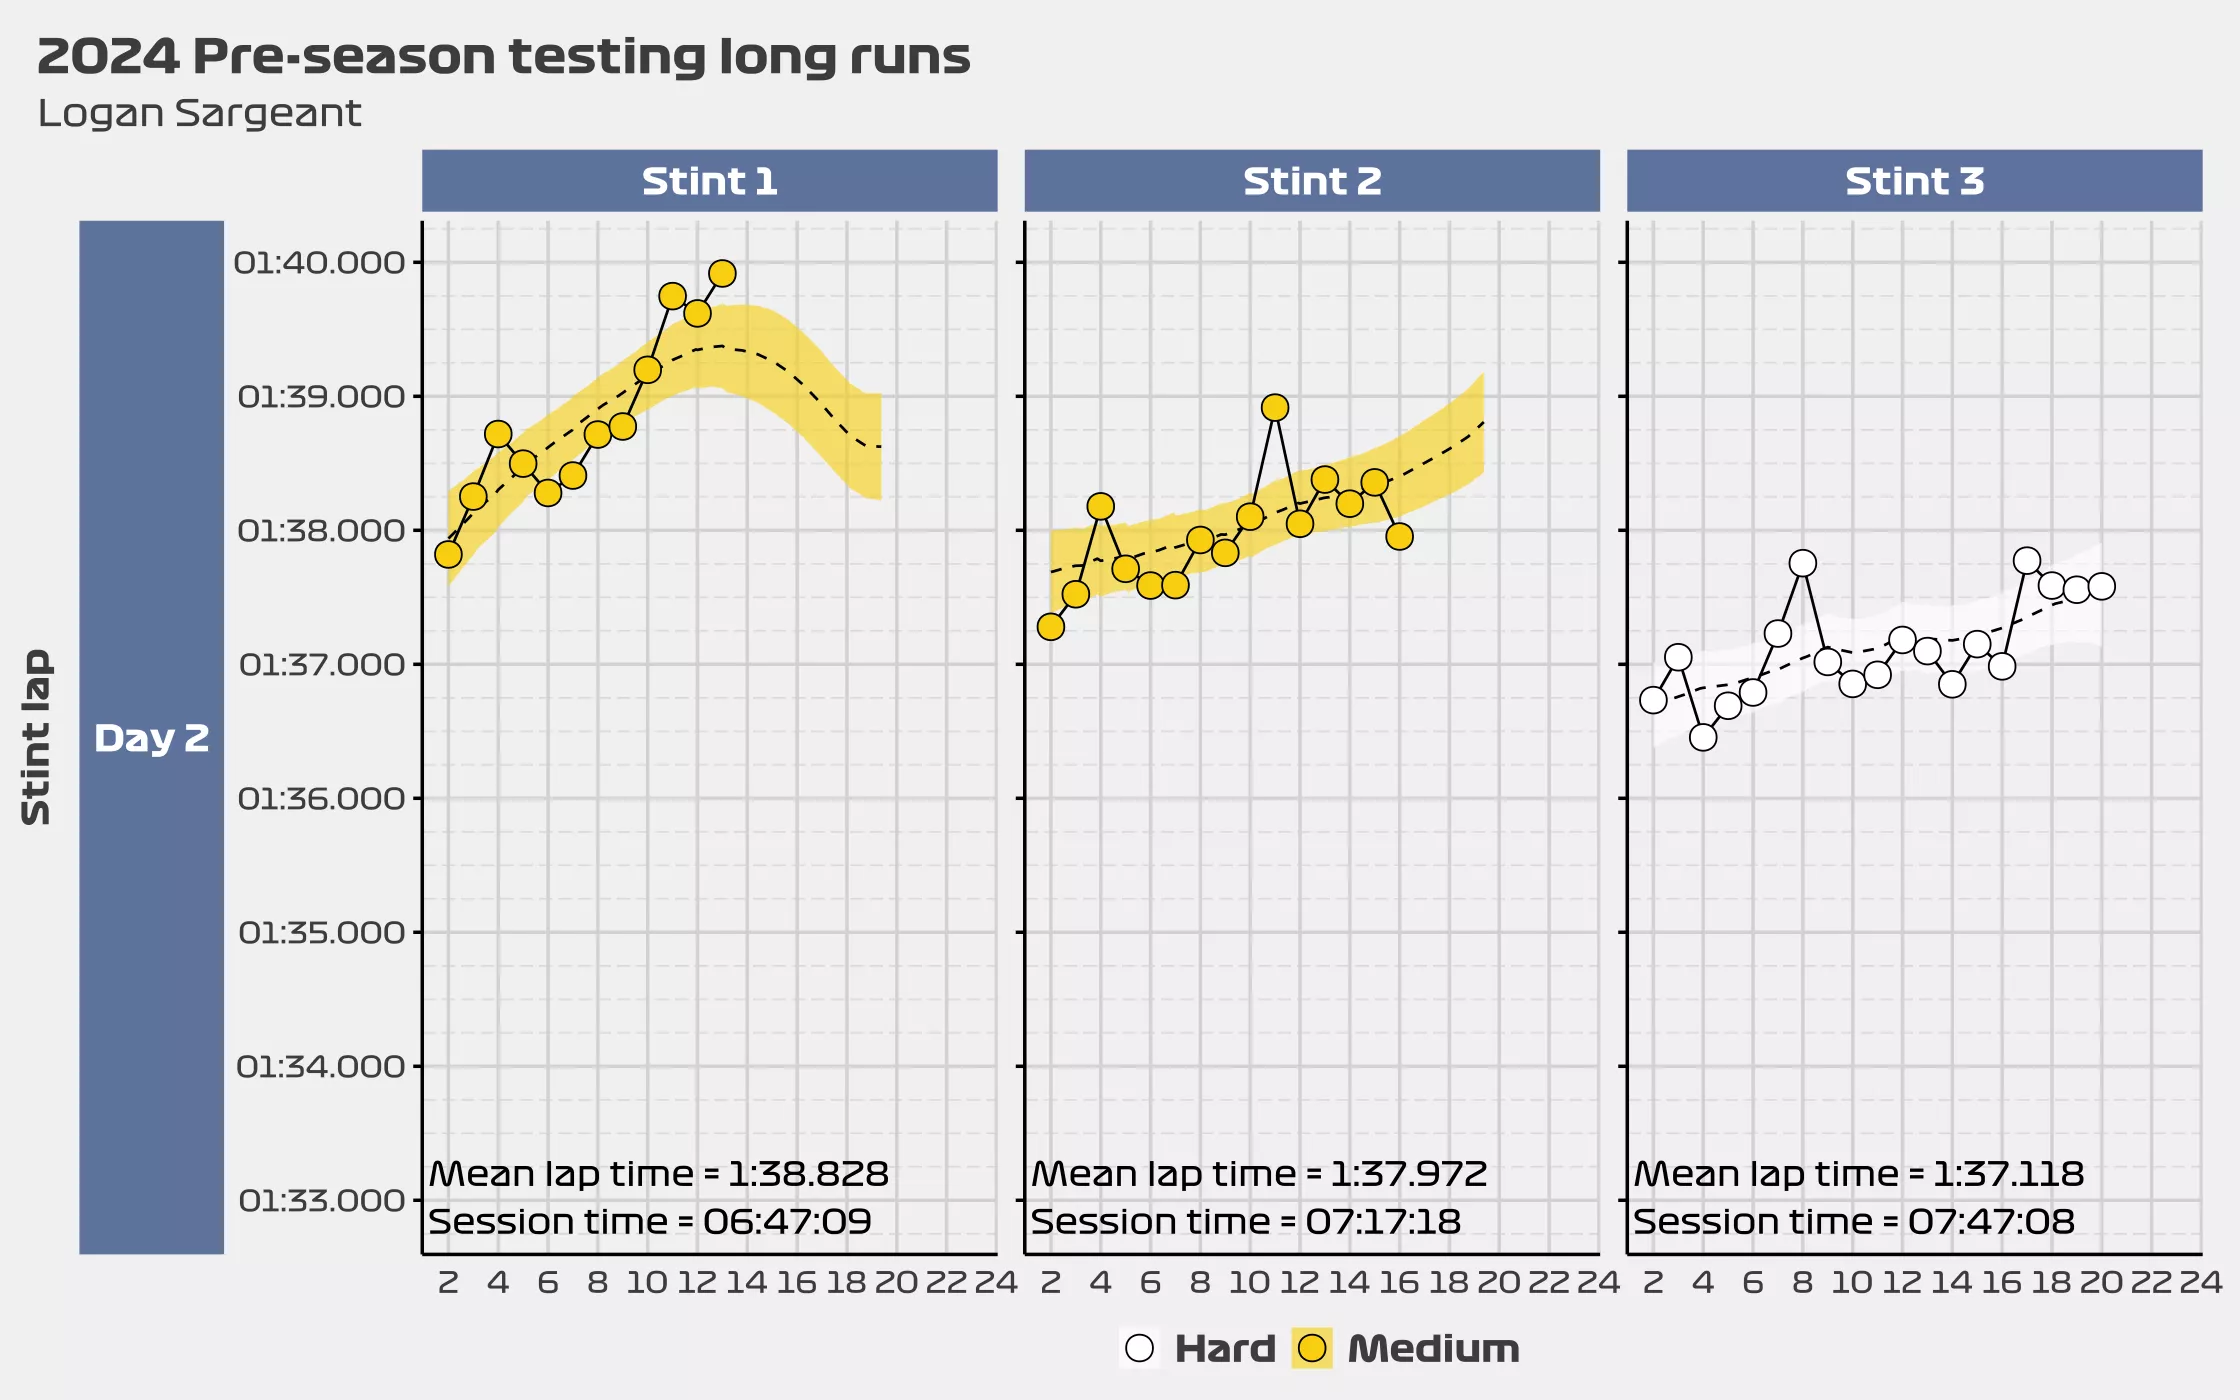
Sauber
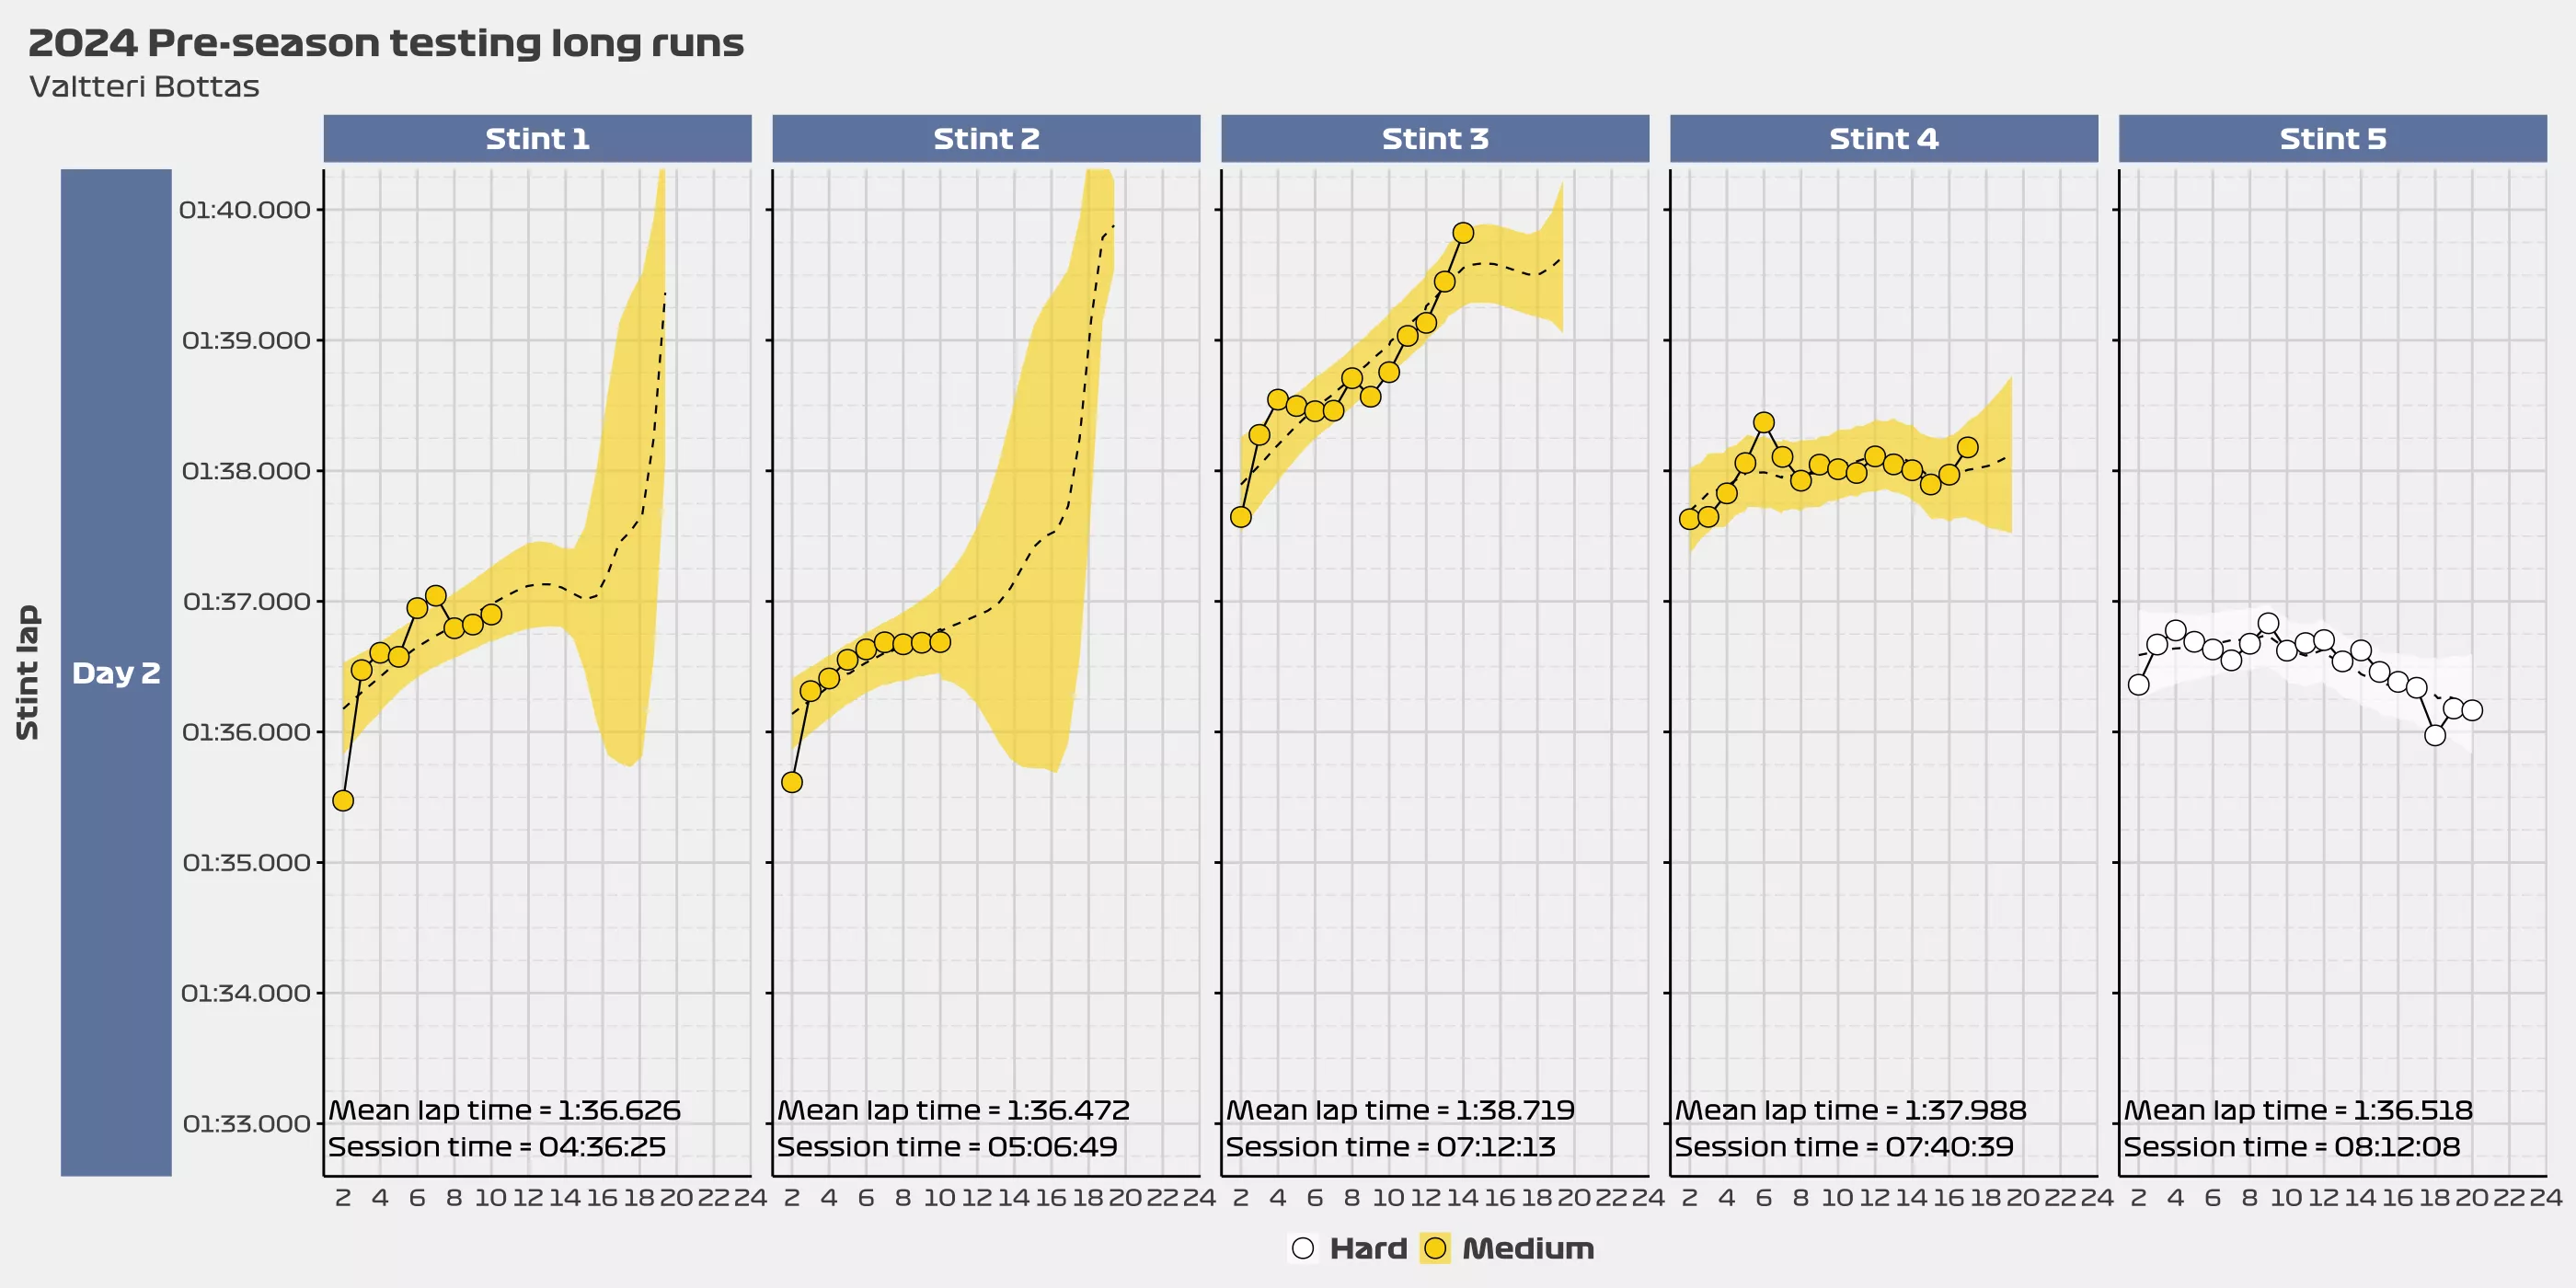
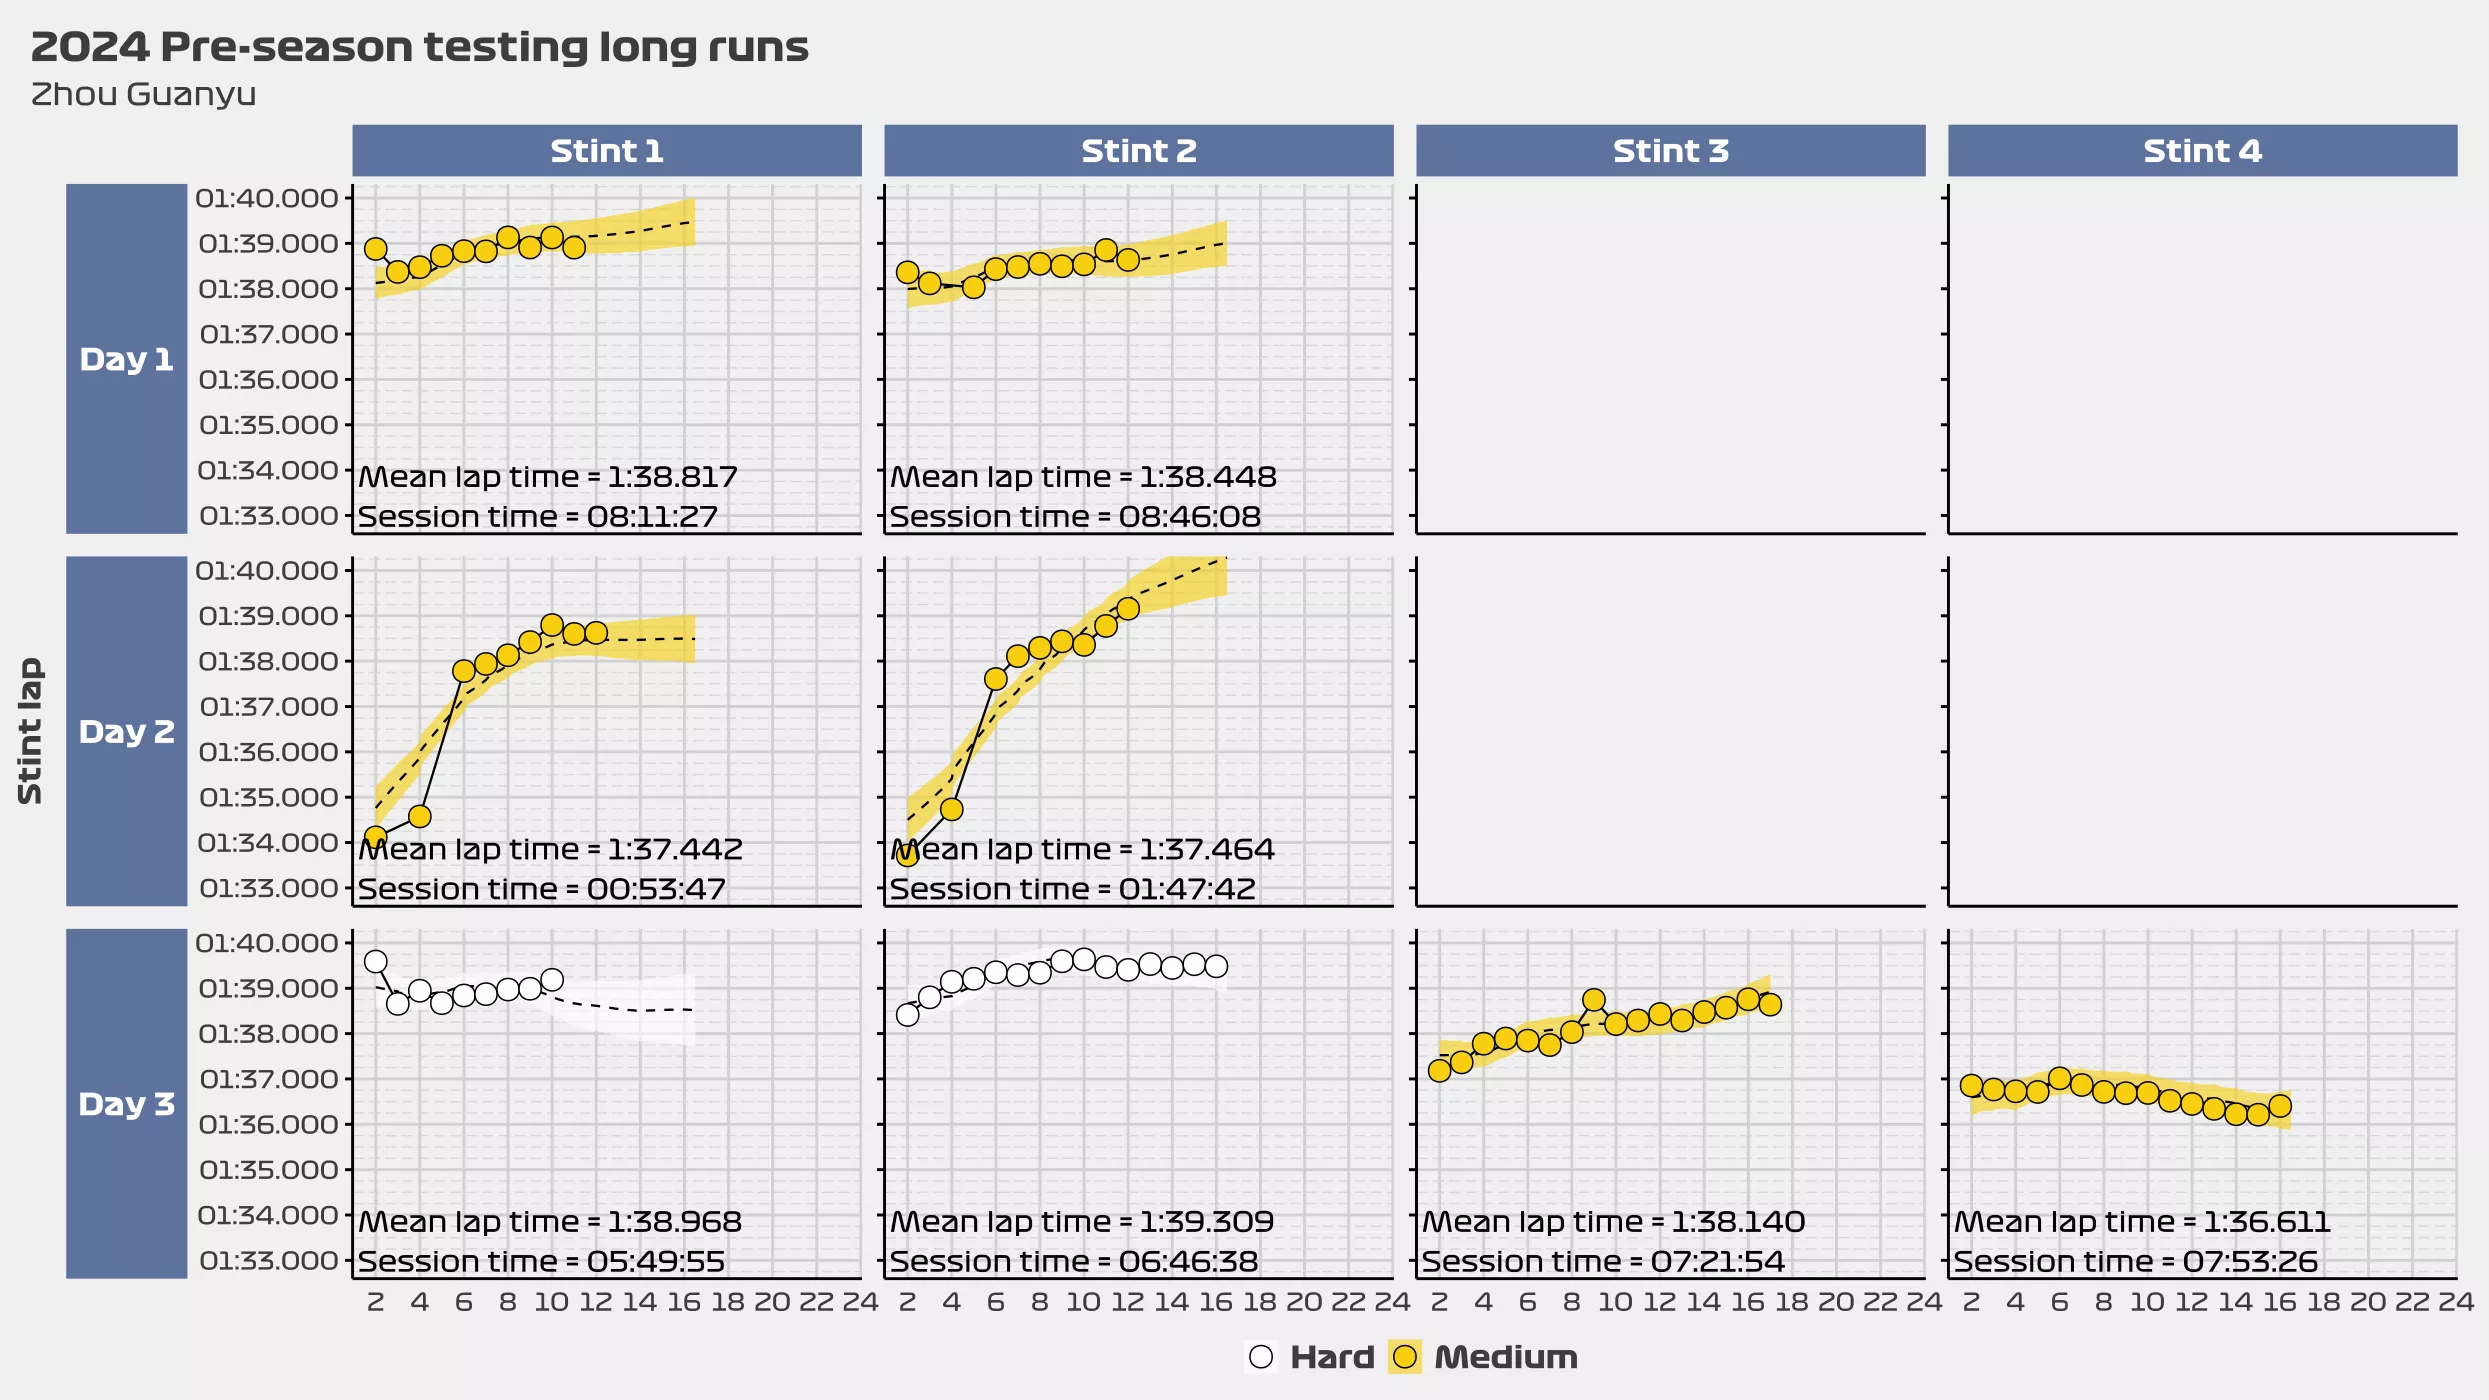
RB F1 Team
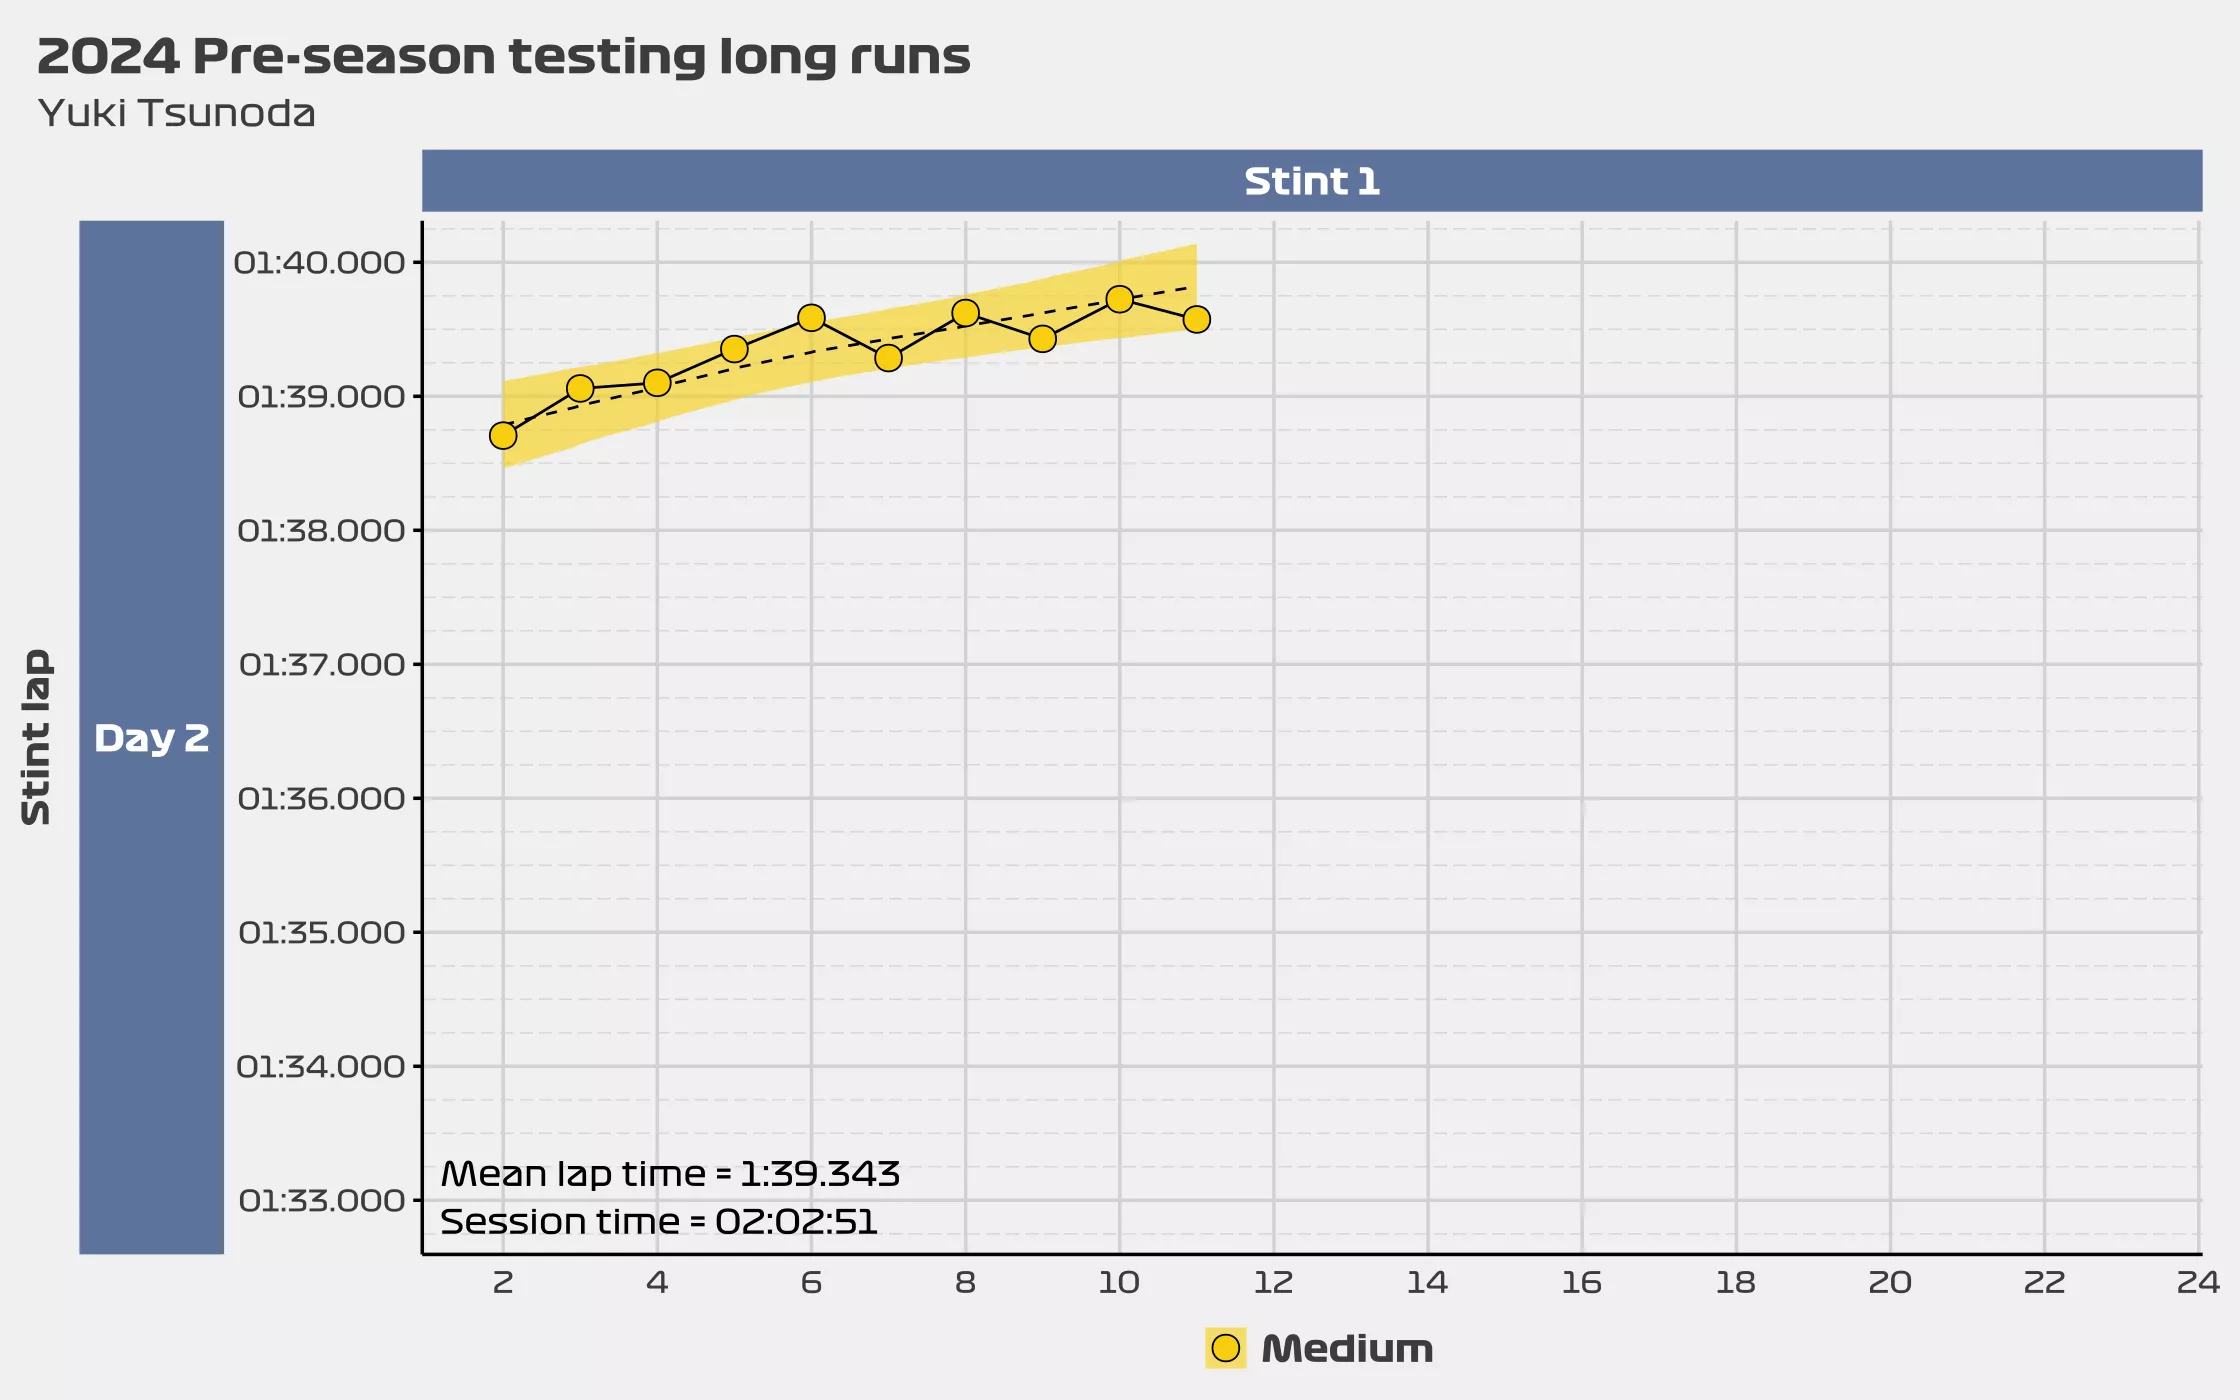
Haas
