I had some issues with my email account. If you have contacted me through the Get in touch link I may have not seen your message. I’m working on recovering all of your emails.
This is an experimental analysis.
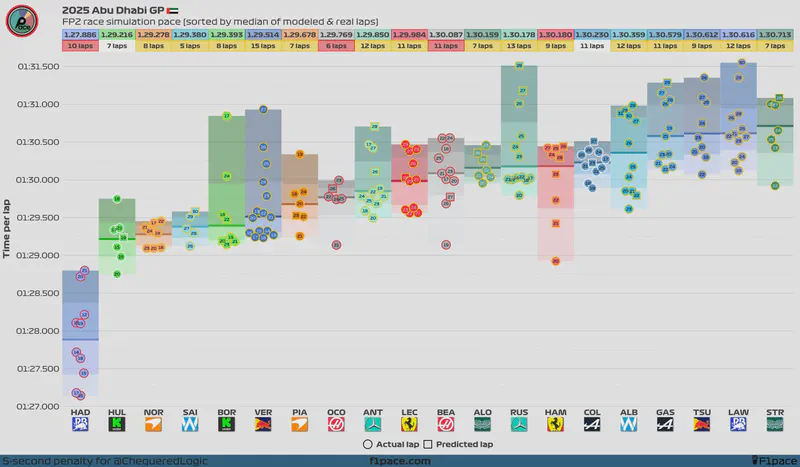
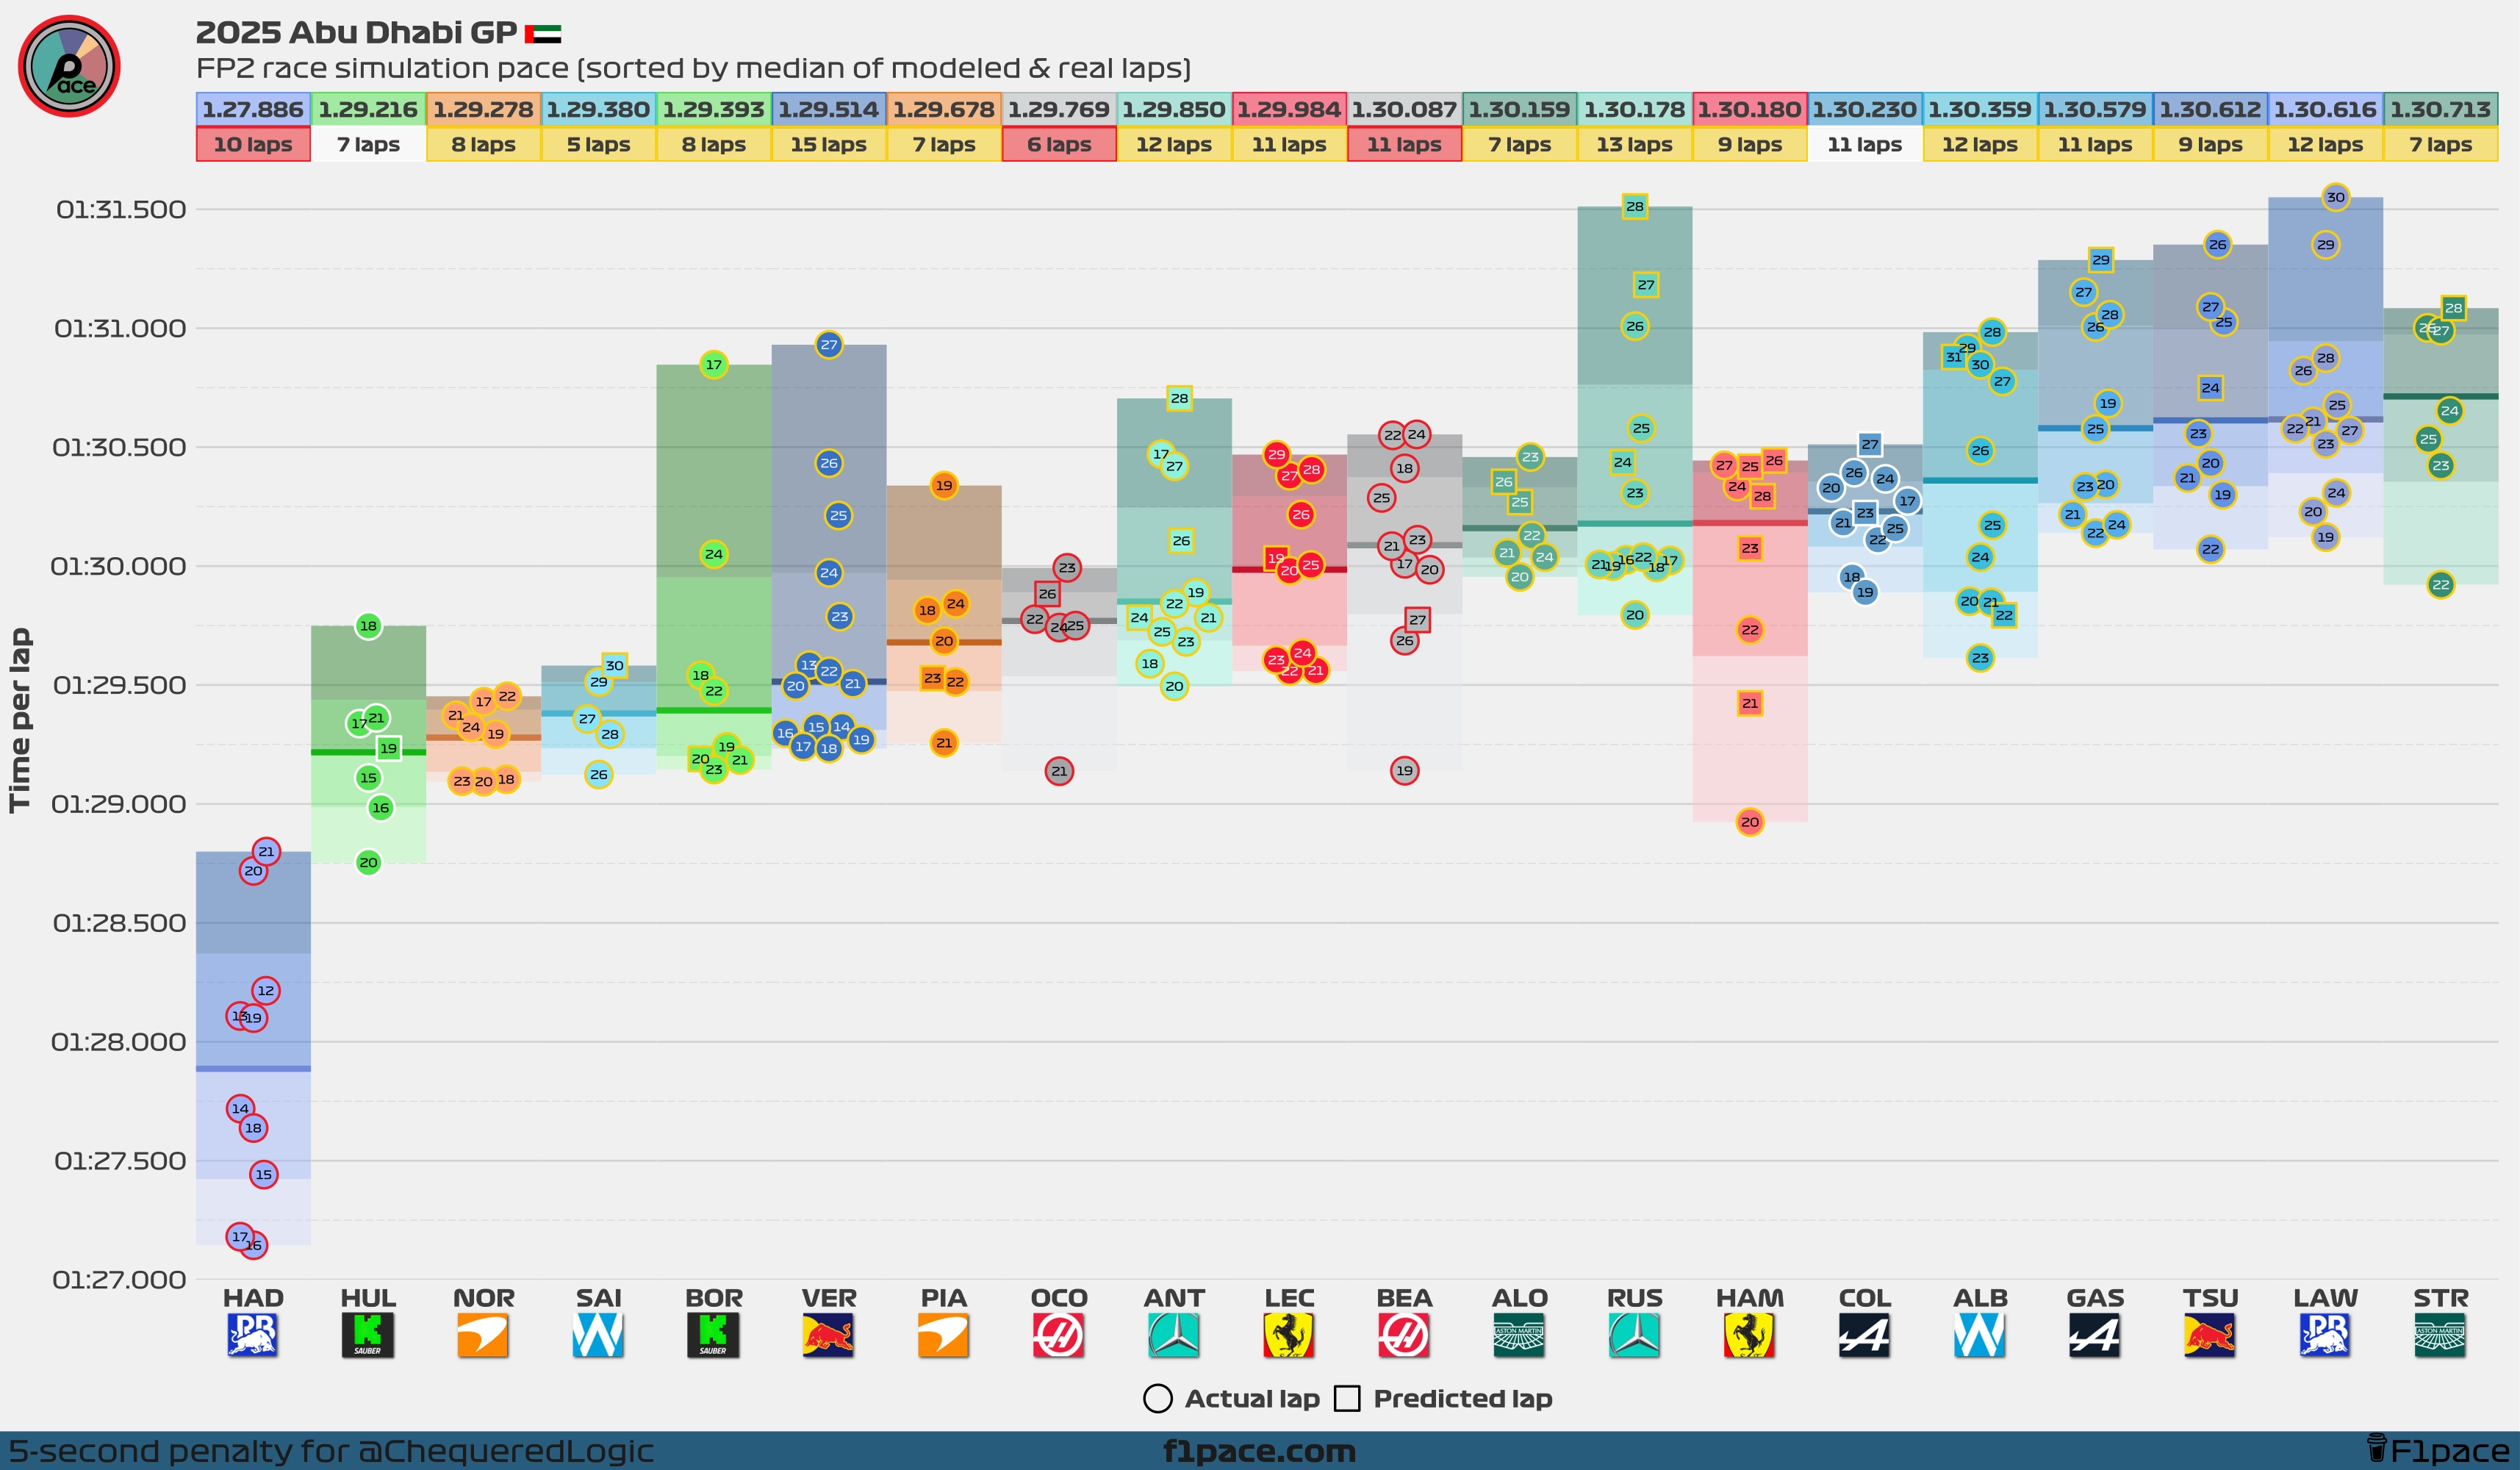
To provide a clearer picture of performance, anomalous laps (due to traffic, driver errors, etc.) have been corrected using predictions from a statistical model which learns each driver’s underlying pace and trends to generate plausible lap times.
Model-corrected race simulation pace
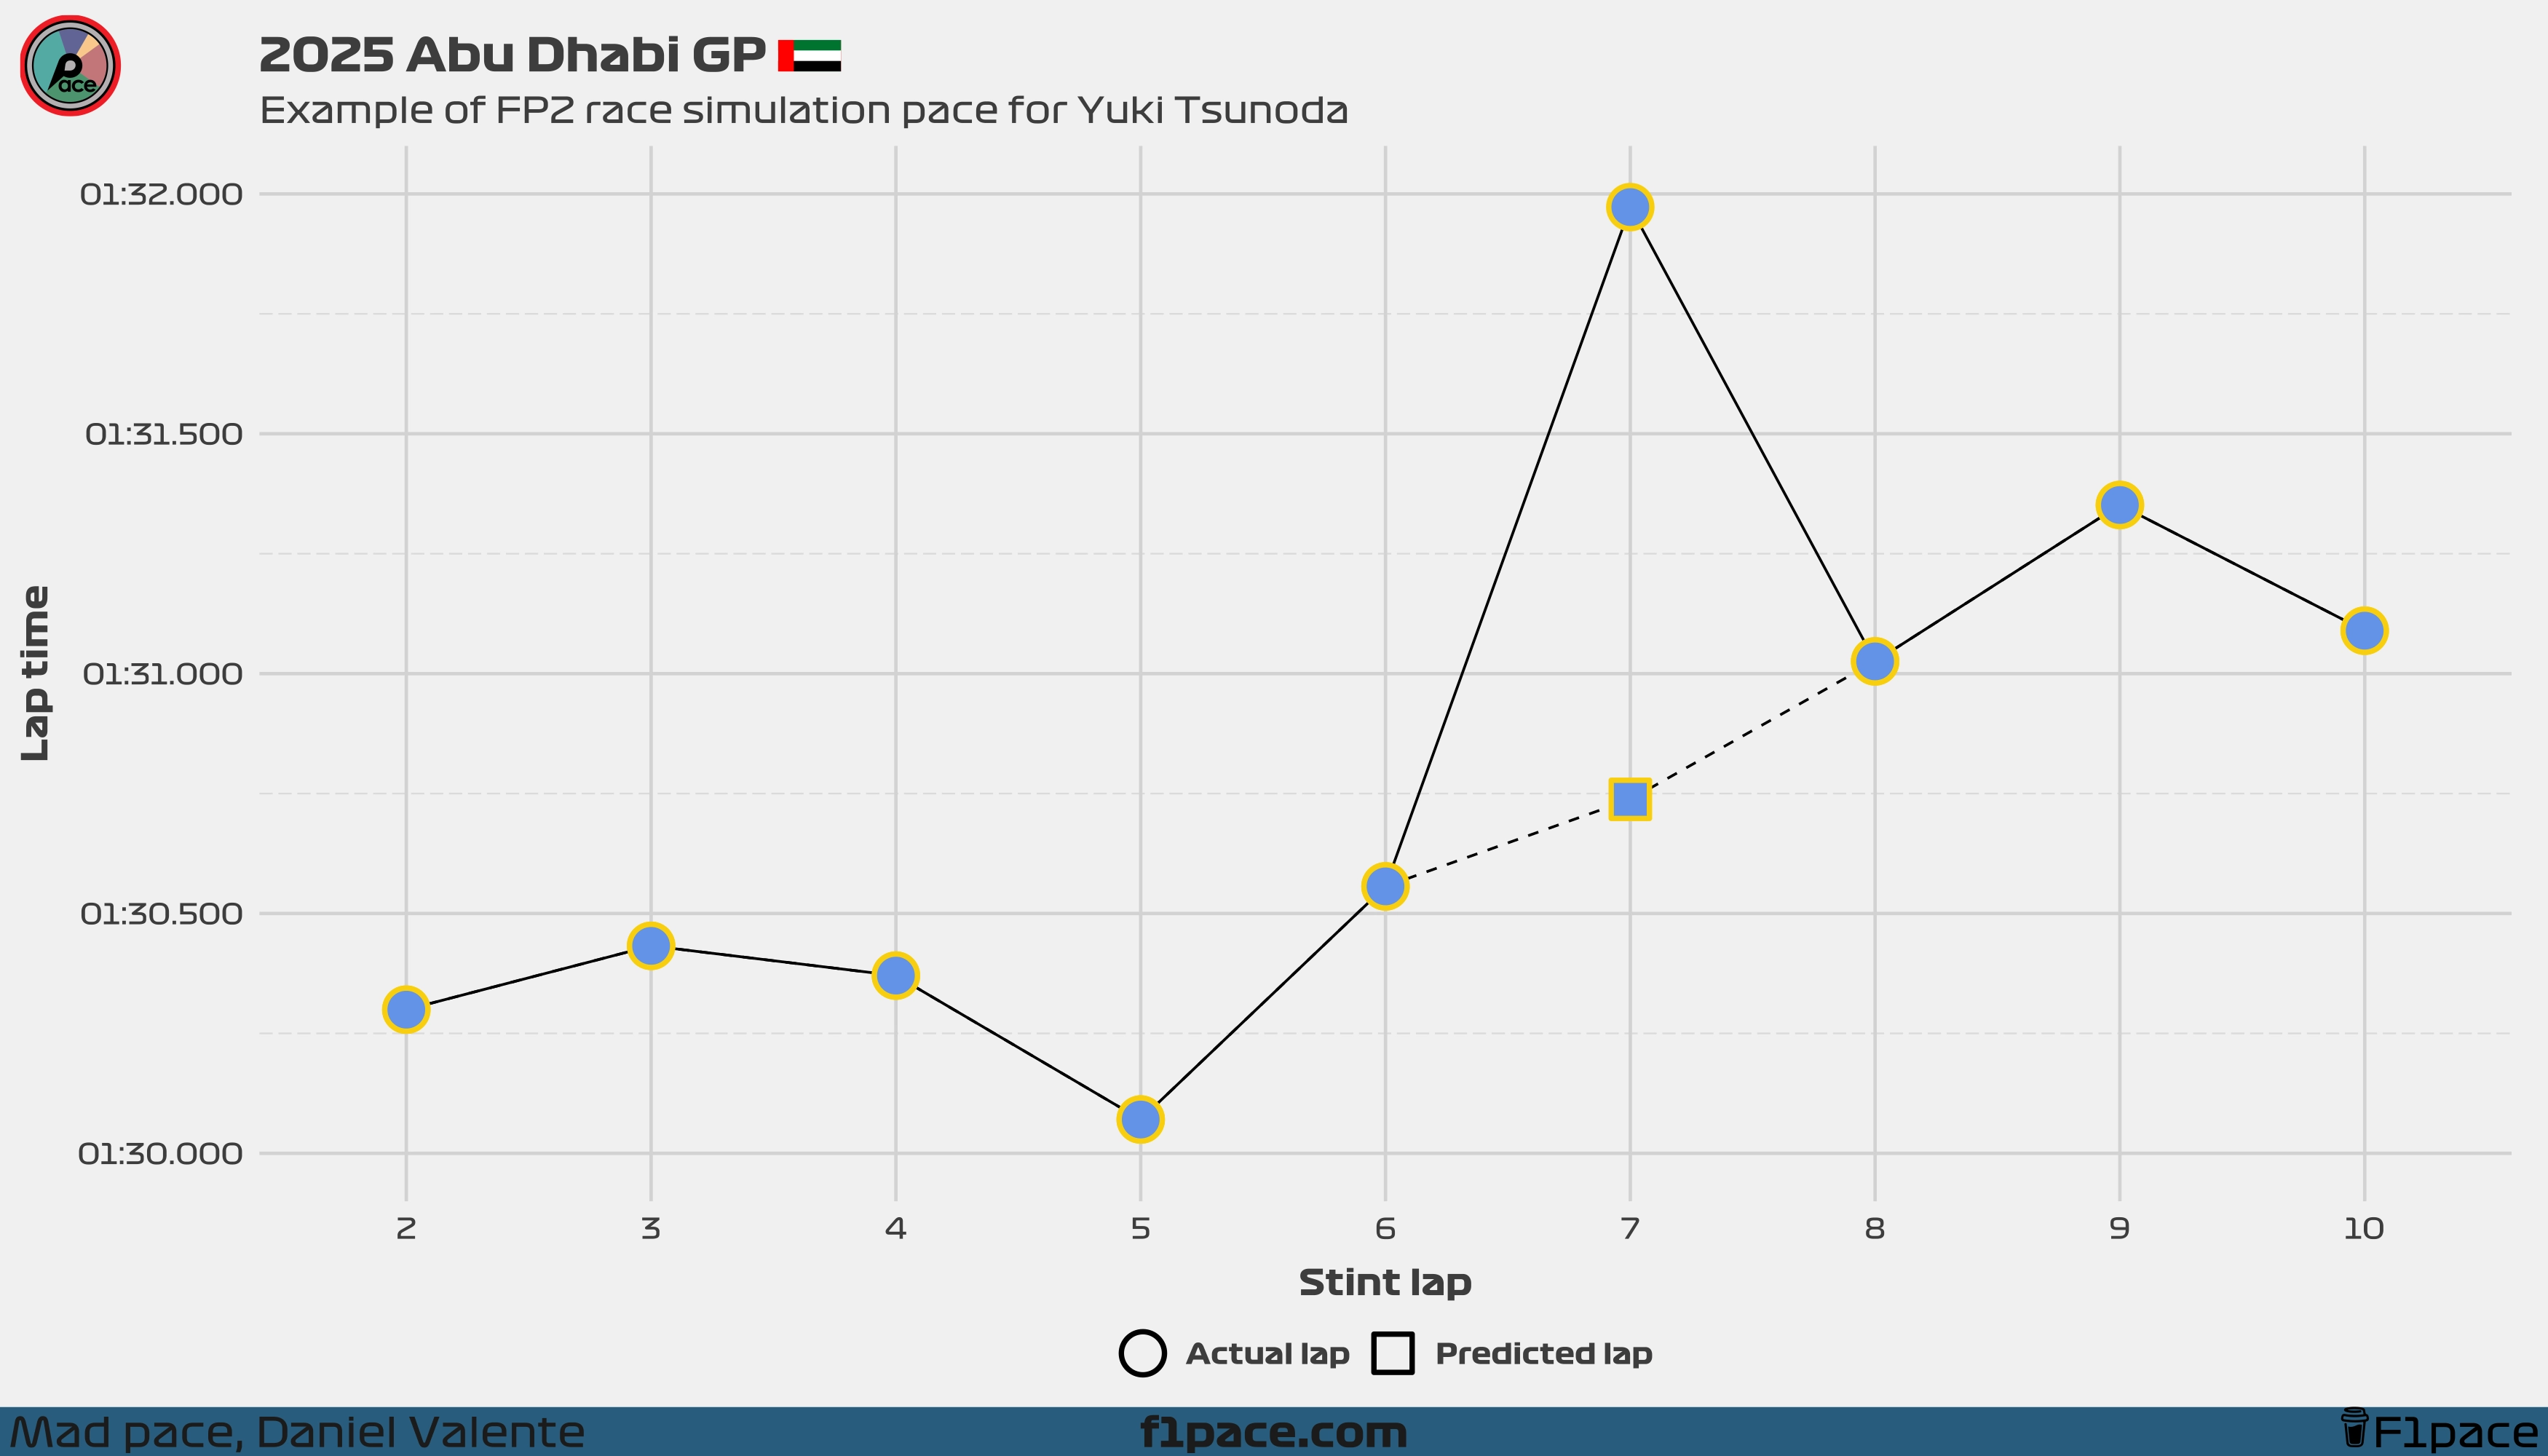
Example of model predictions
This chart shows how the model predicts lap times to replace the ones flagged as anomalies. You can see how the predictions follow a smooth curve that matches the overall trend of the remaining laps.
The predictions are based on complex linear algebra, so they’re not “guesswork” as some of you may believe. You have a better analysis? Cool, share it on your website.