I really need your support to keep going. I love this project and I want to keep it going, but if I can’t find the support to make this site sustainable I may have to shut down operations in the near future.
Use the Get in touch link if you’re interested in supporting this project.
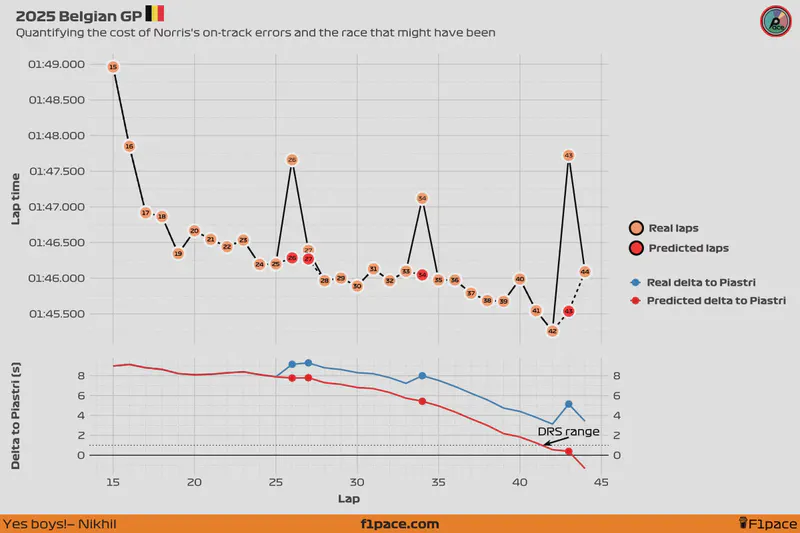
There has been considerable controversy following the outcome of the recent 2025 Belgian GP. While Piastri rightfully claimed victory, many have questioned whether Norris could have done more to challenge his teammate. Norris made several mistakes during the race that cost him valuable time. If he had avoided those errors, could he have caught up to Piastri? Let’s take a look at the numbers
Our simulated world
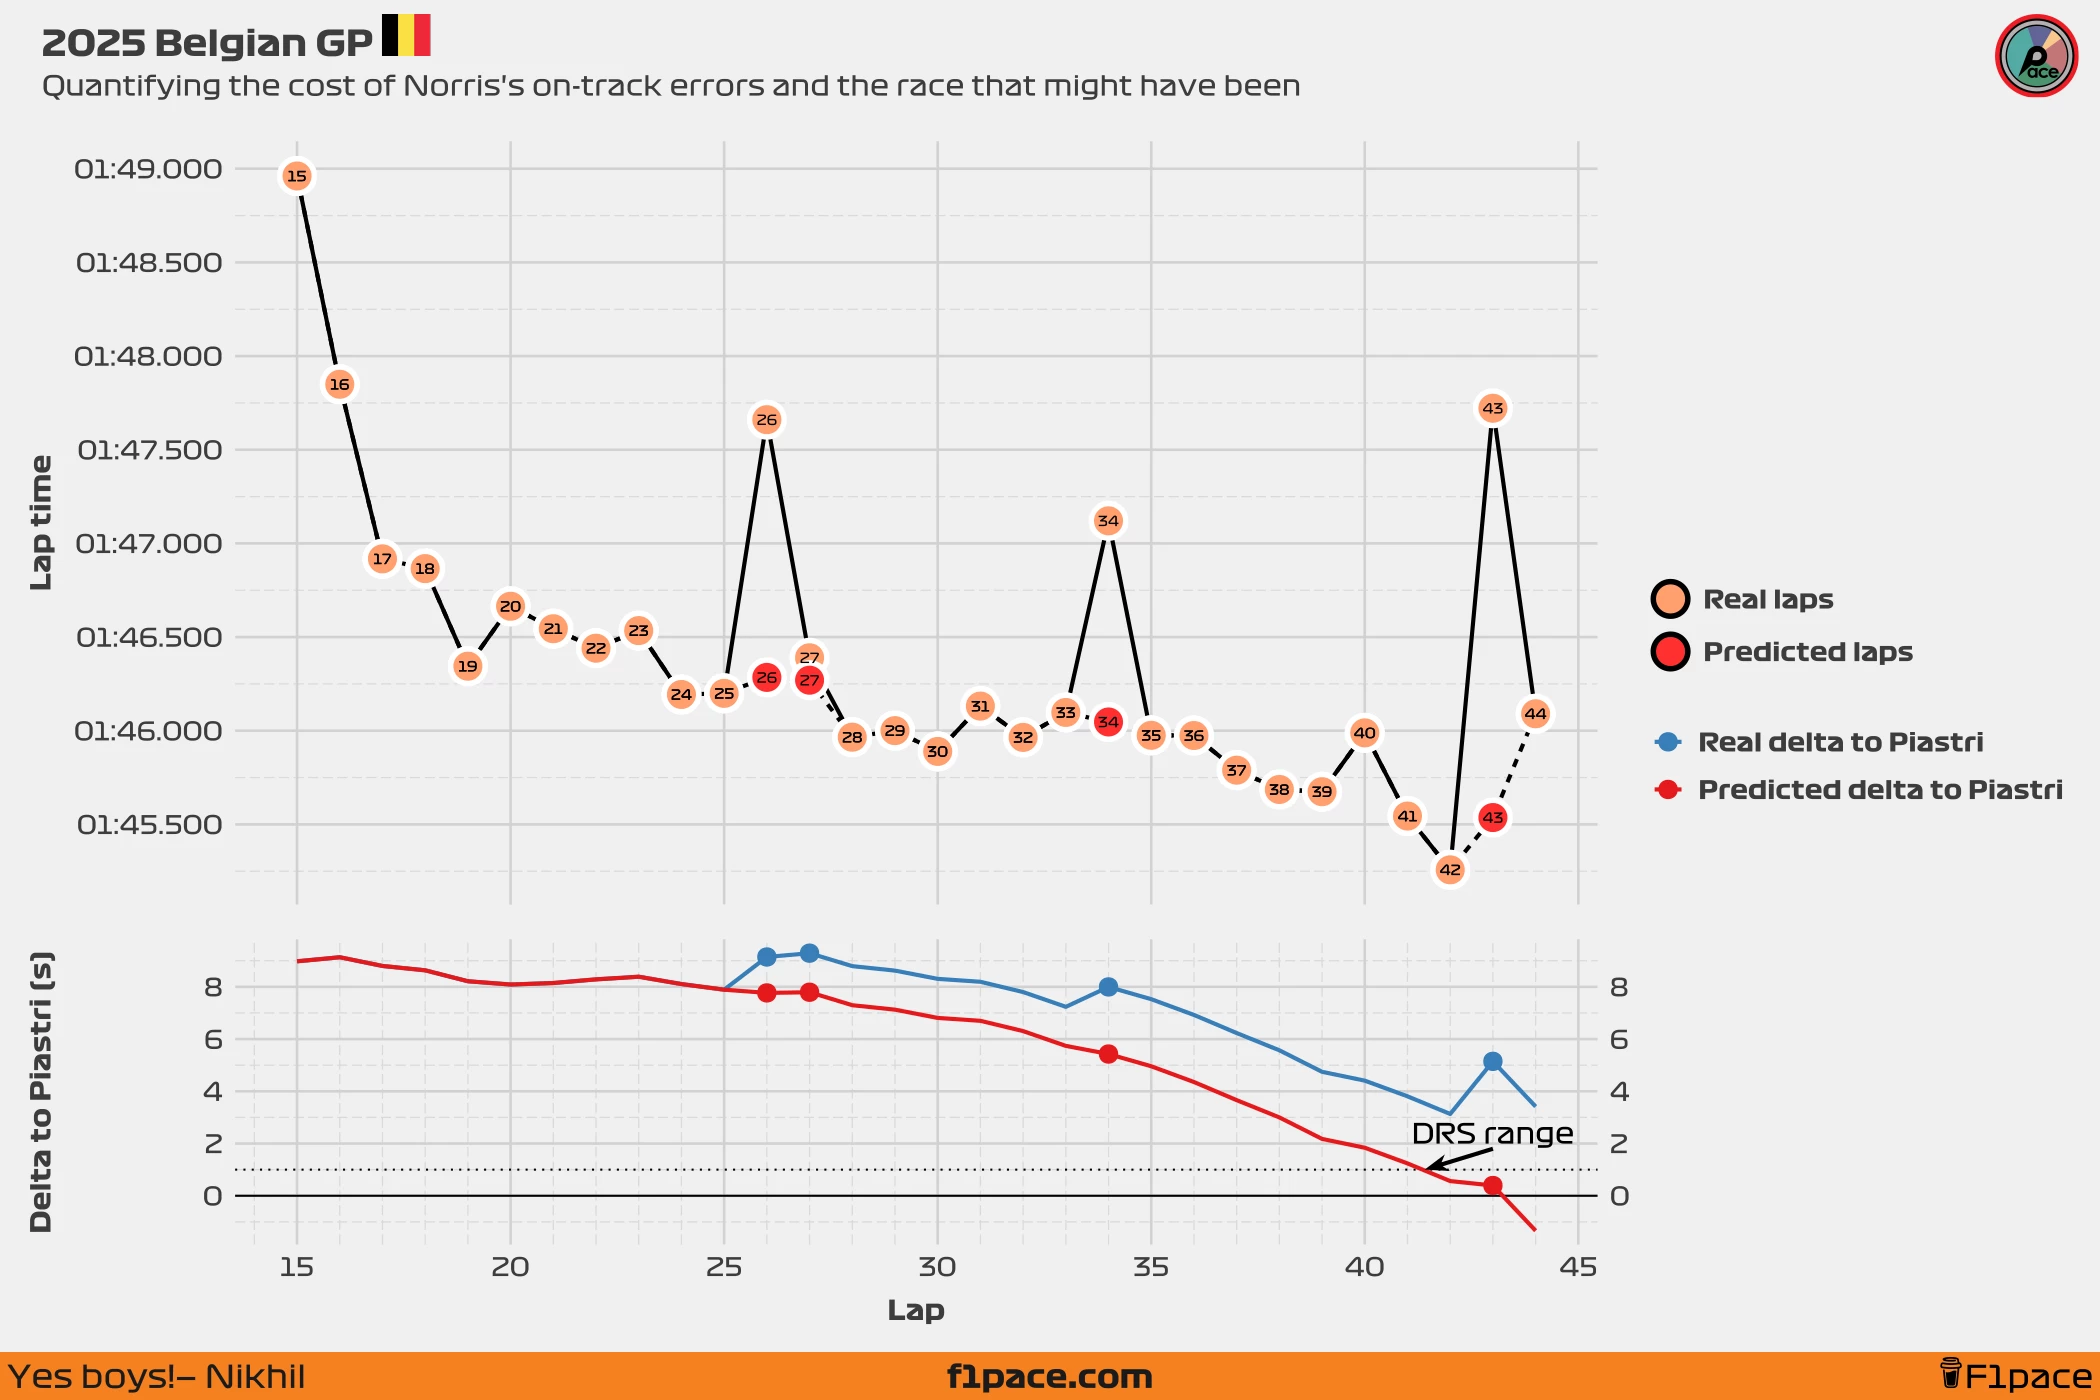
Lando Norris had a strong race, but there’s a chance he left some gains on the table. He made three costly mistakes—on laps 26, 34, and 43—and ultimately finished just over three seconds behind his teammate. While we can’t say for certain what would have happened if Norris had avoided these errors, we can model a simulated scenario in which his laps were clean. For this scenario, I’ve also asked the model to predict lap 27. Although Norris didn’t make a mistake in that lap, it seems likely his lap time was affected by what happened on the previous lap. As you’ll see, the model estimates a gain of just one tenth there, which isn’t particularly significant in the grand scheme of things.
According to our simulation, if Norris had not made those mistakes, he likely would have caught up to Piastri and entered DRS range by lap 41. The model suggests that Lando lost around 4.75 seconds due to his three major errors. However, our analysis can’t predict how Norris’s presence might have influenced Piastri’s performance, or whether Piastri had any extra pace in reserve. Assuming Piastri was already driving at his limit, there’s a strong chance Norris could have been close enough to challenge for the lead in the final 2–3 laps of the race.
The verdict: Lando appeared to have enough pace to catch Piastri. He lost approximately 4.75 seconds due to three costly mistakes and, as a result, wasn’t able to put pressure on his teammate in the final laps of the race.
Detailed data
You can check the detailed tables to review the model’s predictions. The first table compares Norris’s actual and predicted lap times for the key laps—26, 27, 34, and 43. The second table presents the same data found in the “Delta to Piastri” section of the plot, but in a clear, tabular format.
Real and model-predicted laps
| Lap | Real lap time | Predicted lap time | Time lost |
|---|---|---|---|
| 26 | 1:47.660 | 1:46.284 | 1.37 s |
| 27 | 1:46.389 | 1:46.269 | 0.11 s |
| 34 | 1:47.120 | 1:46.046 | 1.07 s |
| 43 | 1:47.721 | 1:45.536 | 2.18 s |
| Total | 4.75 s |
Real and model-predicted delta to Piastri
| Lap | Real delta | Predicted delta |
|---|---|---|
| 15 | 8.98 secs | 8.98 secs |
| 16 | 9.13 secs | 9.13 secs |
| 17 | 8.80 secs | 8.80 secs |
| 18 | 8.63 secs | 8.63 secs |
| 19 | 8.21 secs | 8.21 secs |
| 20 | 8.09 secs | 8.09 secs |
| 21 | 8.15 secs | 8.15 secs |
| 22 | 8.29 secs | 8.29 secs |
| 23 | 8.39 secs | 8.39 secs |
| 24 | 8.11 secs | 8.11 secs |
| 25 | 7.89 secs | 7.89 secs |
| 26 | 9.14 secs | 7.77 secs |
| 27 | 9.29 secs | 7.79 secs |
| 28 | 8.79 secs | 7.30 secs |
| 29 | 8.62 secs | 7.13 secs |
| 30 | 8.30 secs | 6.81 secs |
| 31 | 8.19 secs | 6.70 secs |
| 32 | 7.80 secs | 6.30 secs |
| 33 | 7.23 secs | 5.74 secs |
| 34 | 8.00 secs | 5.43 secs |
| 35 | 7.53 secs | 4.96 secs |
| 36 | 6.92 secs | 4.35 secs |
| 37 | 6.23 secs | 3.66 secs |
| 38 | 5.57 secs | 3.00 secs |
| 39 | 4.74 secs | 2.18 secs |
| 40 | 4.41 secs | 1.84 secs |
| 41 | 3.81 secs | 1.24 secs |
| 42 | 3.13 secs | 0.56 secs |
| 43 | 5.15 secs | 0.39 secs |
| 44 | 3.41 secs | -1.34 secs |