I really need your support to keep going. I love this project and I want to keep it going, but if I can’t find the support to make this site sustainable I may have to shut down operations in the near future.
Use the Get in touch link if you’re interested in supporting this project.
The 2025 Hungarian Grand Prix featured several notable incidents, but none more significant than Charles Leclerc’s sudden loss of performance midway through the race. Leclerc started on pole and appeared to be on course for victory, but something changed. What really happened? There has been much speculation, and while I can’t provide a definitive answer, I can use the power of statistics to uncover more of the truth. Let’s take a closer look at the numbers.
The limitations of raw data

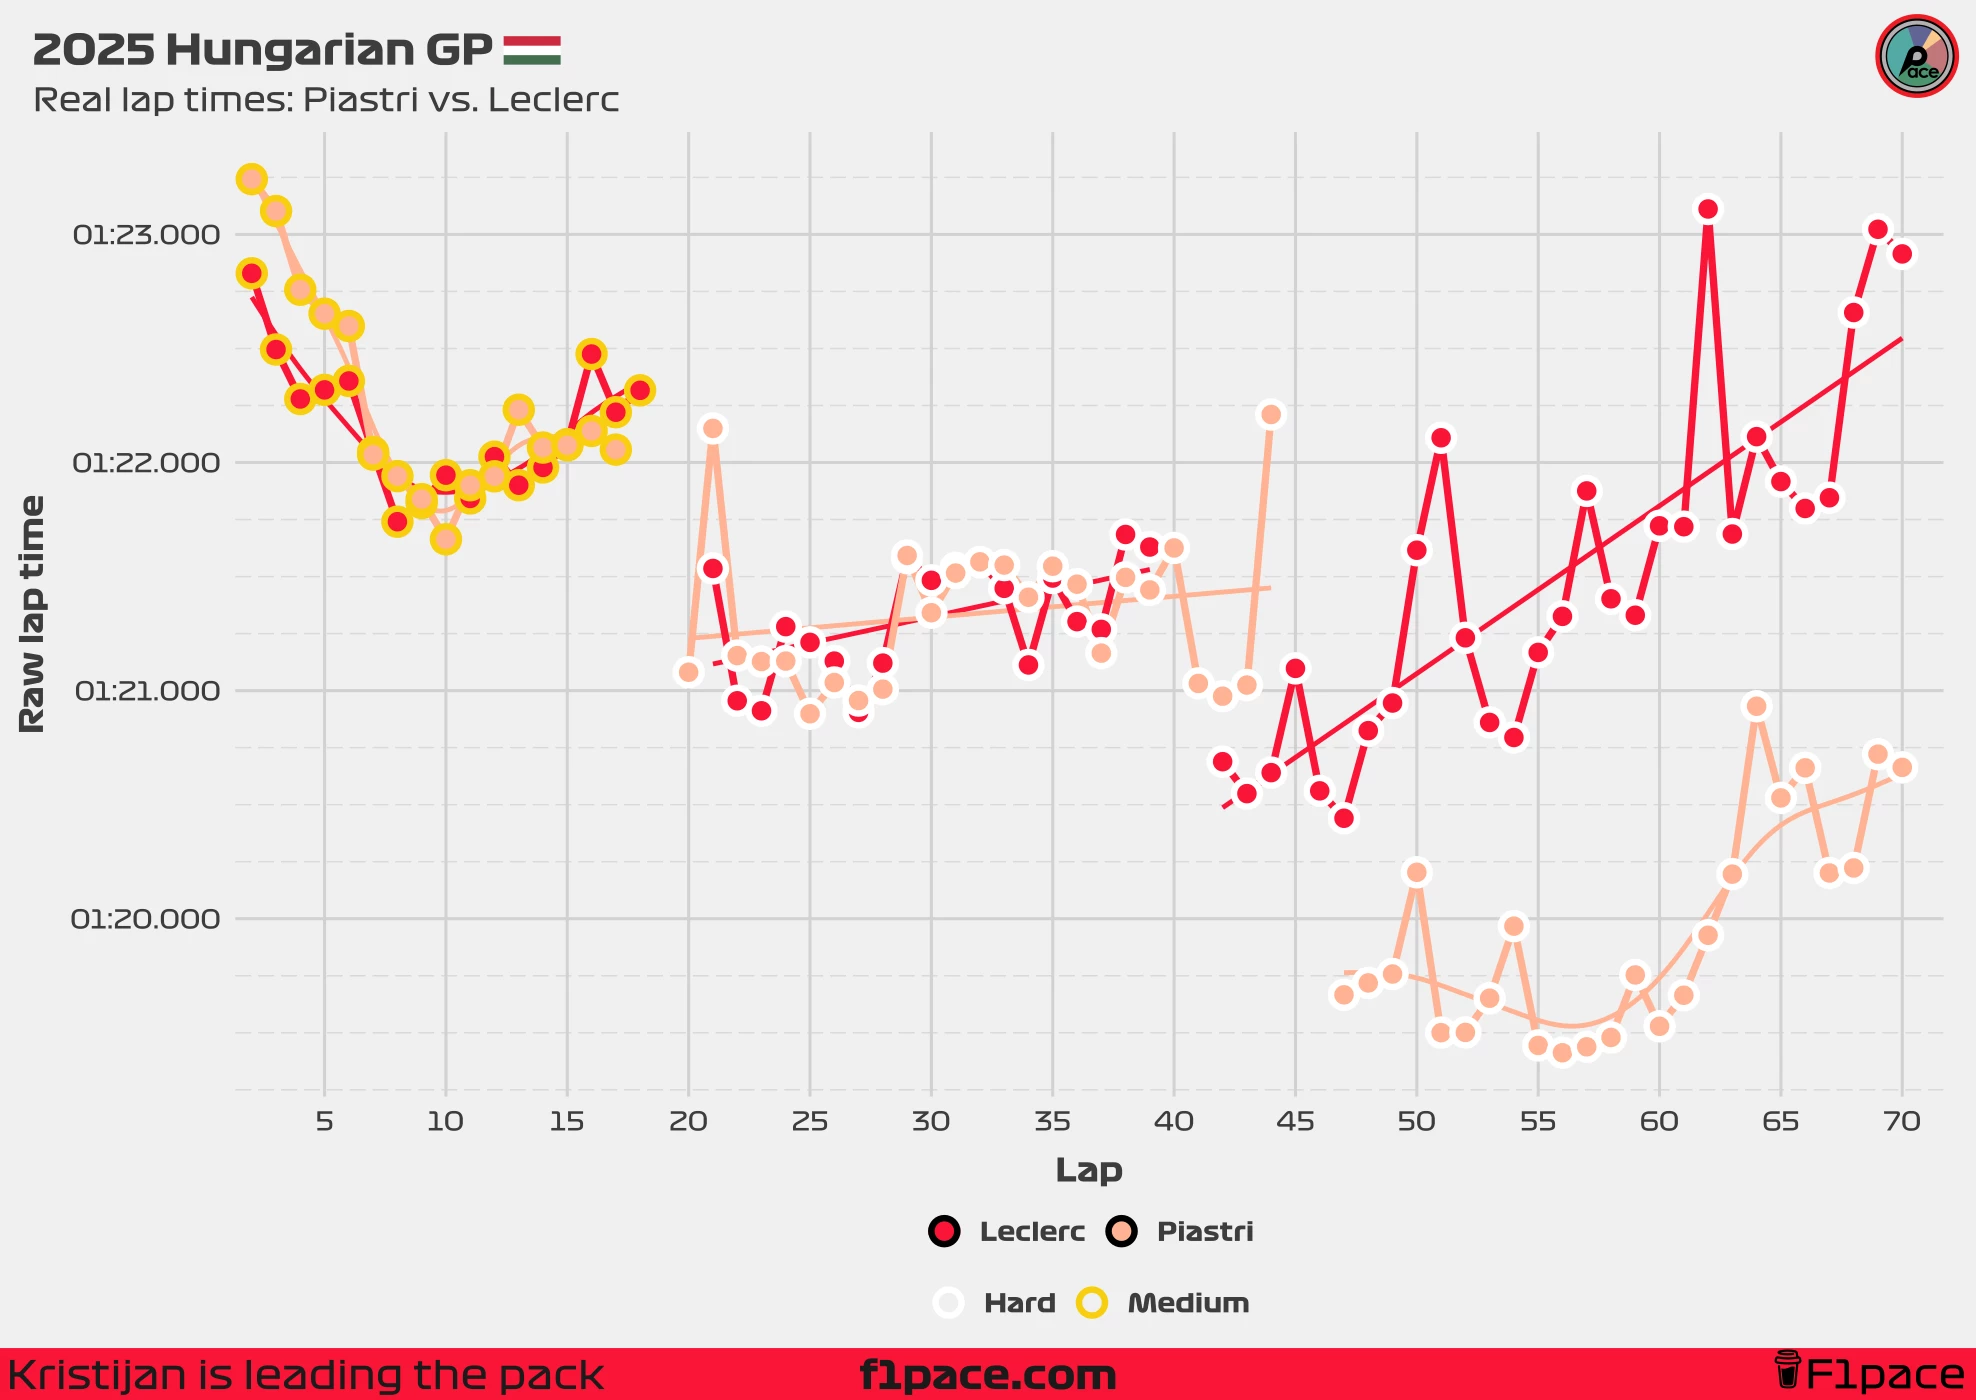
Let’s start by examining the raw lap times—the exact times recorded by the drivers during the race. While these numbers are insightful, they don’t tell the whole story. In reality, lap times are influenced by much more than a driver’s pure speed. A multitude of factors come into play, including but not limited to:
- Fuel: As cars burn fuel, they become lighter and therefore faster as the race progresses. This is why you often see slower lap times at the beginning of the race and much quicker times toward the end.
- Track evolution: The track surface is constantly changing. As cars repeatedly circle the track, they deposit rubber onto the racing line, increasing grip. That’s why you’ll notice lap times dropping dramatically early in the race as the track “rubbers in.”
- Weather: Conditions such as humidity, ambient temperature, track temperature, and wind significantly affect lap times. A track that’s too cold or too hot can slow drivers down and accelerate tire wear. These variables are always shifting throughout the race.
- Tire degradation: Perhaps one of the most interesting topics in current Formula 1. Drivers must carefully balance between preserving their tires to reduce degradation and pushing for faster lap times. Overheating the tires can lead to a sudden loss of performance. On the other hand, being too conservative might allow a rival to overtake. It’s a delicate balance between endurance and speed.
- Traffic: This one’s almost self-explanatory. Running behind another car—known as being in “dirty air”—reduces aerodynamic efficiency and hampers cornering speed. Conversely, running in clean air allows a driver to extract the car’s full potential.
When you look at a graph of lap times, all these effects are mixed into each number. So if a driver suddenly sets a faster lap, was it because of fuel, track conditions, or something else? The raw times alone can’t give you a clear answer. Maybe a driver was excellent at looking after his tires, but with all this noise—from fuel, track evolution, weather, and traffic—it’s impossible to tell just from the lap chart.
Traffic makes things even messier. If someone gets stuck behind another car without the chance to overtake, their real speed might never show up in the results. They could have been the fastest on track, but the numbers don’t always reveal that.
So, who was really the quickest this weekend? We know Leclerc’s pace fell off sharply in the final stint, but did something go wrong during his last pit stop, or was there a problem creeping in from earlier on? That’s the question we really want to answer.
Wouldn’t it be great if we could filter out all the distractions and compare every driver on a level playing field? Then we’d really see when someone’s performance picked up or dropped off. Believe it or not, that’s something we can do using statistical modeling.
Understanding our analysis
Using a statistical model, we can isolate the effects we actually want to analyze from everything else that gets mixed into the lap times. What I’m interested in here is the relative pace of Leclerc, Piastri, and Russell, if we assume they were all racing under the same circumstances.
Some effects are similar for everyone. Fuel, for example, drops at a similar rate for all drivers, so the effect of a lighter car as the race goes on is easy to correct for. The same goes for track evolution since the grip on the track improves for everyone, regardless of who’s behind the wheel. But traffic is a different story. If a driver gets stuck behind slower cars, it’s going to hurt their lap times, badly, even if they have plenty of pace in reserve. On the other hand, a race leader in clean air might post deceptively strong times, partly thanks to clear track rather than sheer speed.
To work through this, I built a statistical model that decouples these effects and lets us see each driver’s true pace. The details of the model aren’t the main focus here since my goal is mainly to use its output to understand what actually happened, especially with Leclerc’s race.
Using the model, I predicted the lap times for Leclerc, Russell, and Piastri, but these times are “clean.” In other words, I adjusted the laps so that fuel levels don’t factor in, and track evolution is held constant. For track evolution, I chose to freeze its effect as it was on lap 35, whic is the halfway point of the race. That way, we’re imagining no further changes in grip, lap after lap. Most importantly, I removed the impact of traffic. For example, Piastri spent much of his second stint stuck behind Leclerc, which clearly cost him time. So I had the model estimate what his laps would have looked like if he’d been able to run in free air for the entire stint.
For this analysis, here’s a quick summary of the effects I corrected for:
- Fuel: Corrected. I added back a 0.03-second time penalty per lap, which is a widely used estimate of how much lap times improve as cars burn fuel. This was a straight correction based on industry knowledge. It’s not perfect, but it’s accurate enough for our needs.
- Track evolution: Controlled for. Track evolution was modelled, which means that this effect is not constant, and instead is allowed to vary throughout a race. For this comparison I fixed track evolution at the value from lap 35, so we’re comparing everyone on an even surface.
- Traffic: Controlled for. I asked the model to predict lap times as if each driver spent the whole race in clean air, with no time lost following slower cars.
With these corrections, the lap times we’re looking at show how fast each driver could have gone if all the outside factors were neutralized. In other words we combined all of these adjustments, and we create a fuel, track evolution, and traffic-corrected, view of the race.
A corrected view of the race

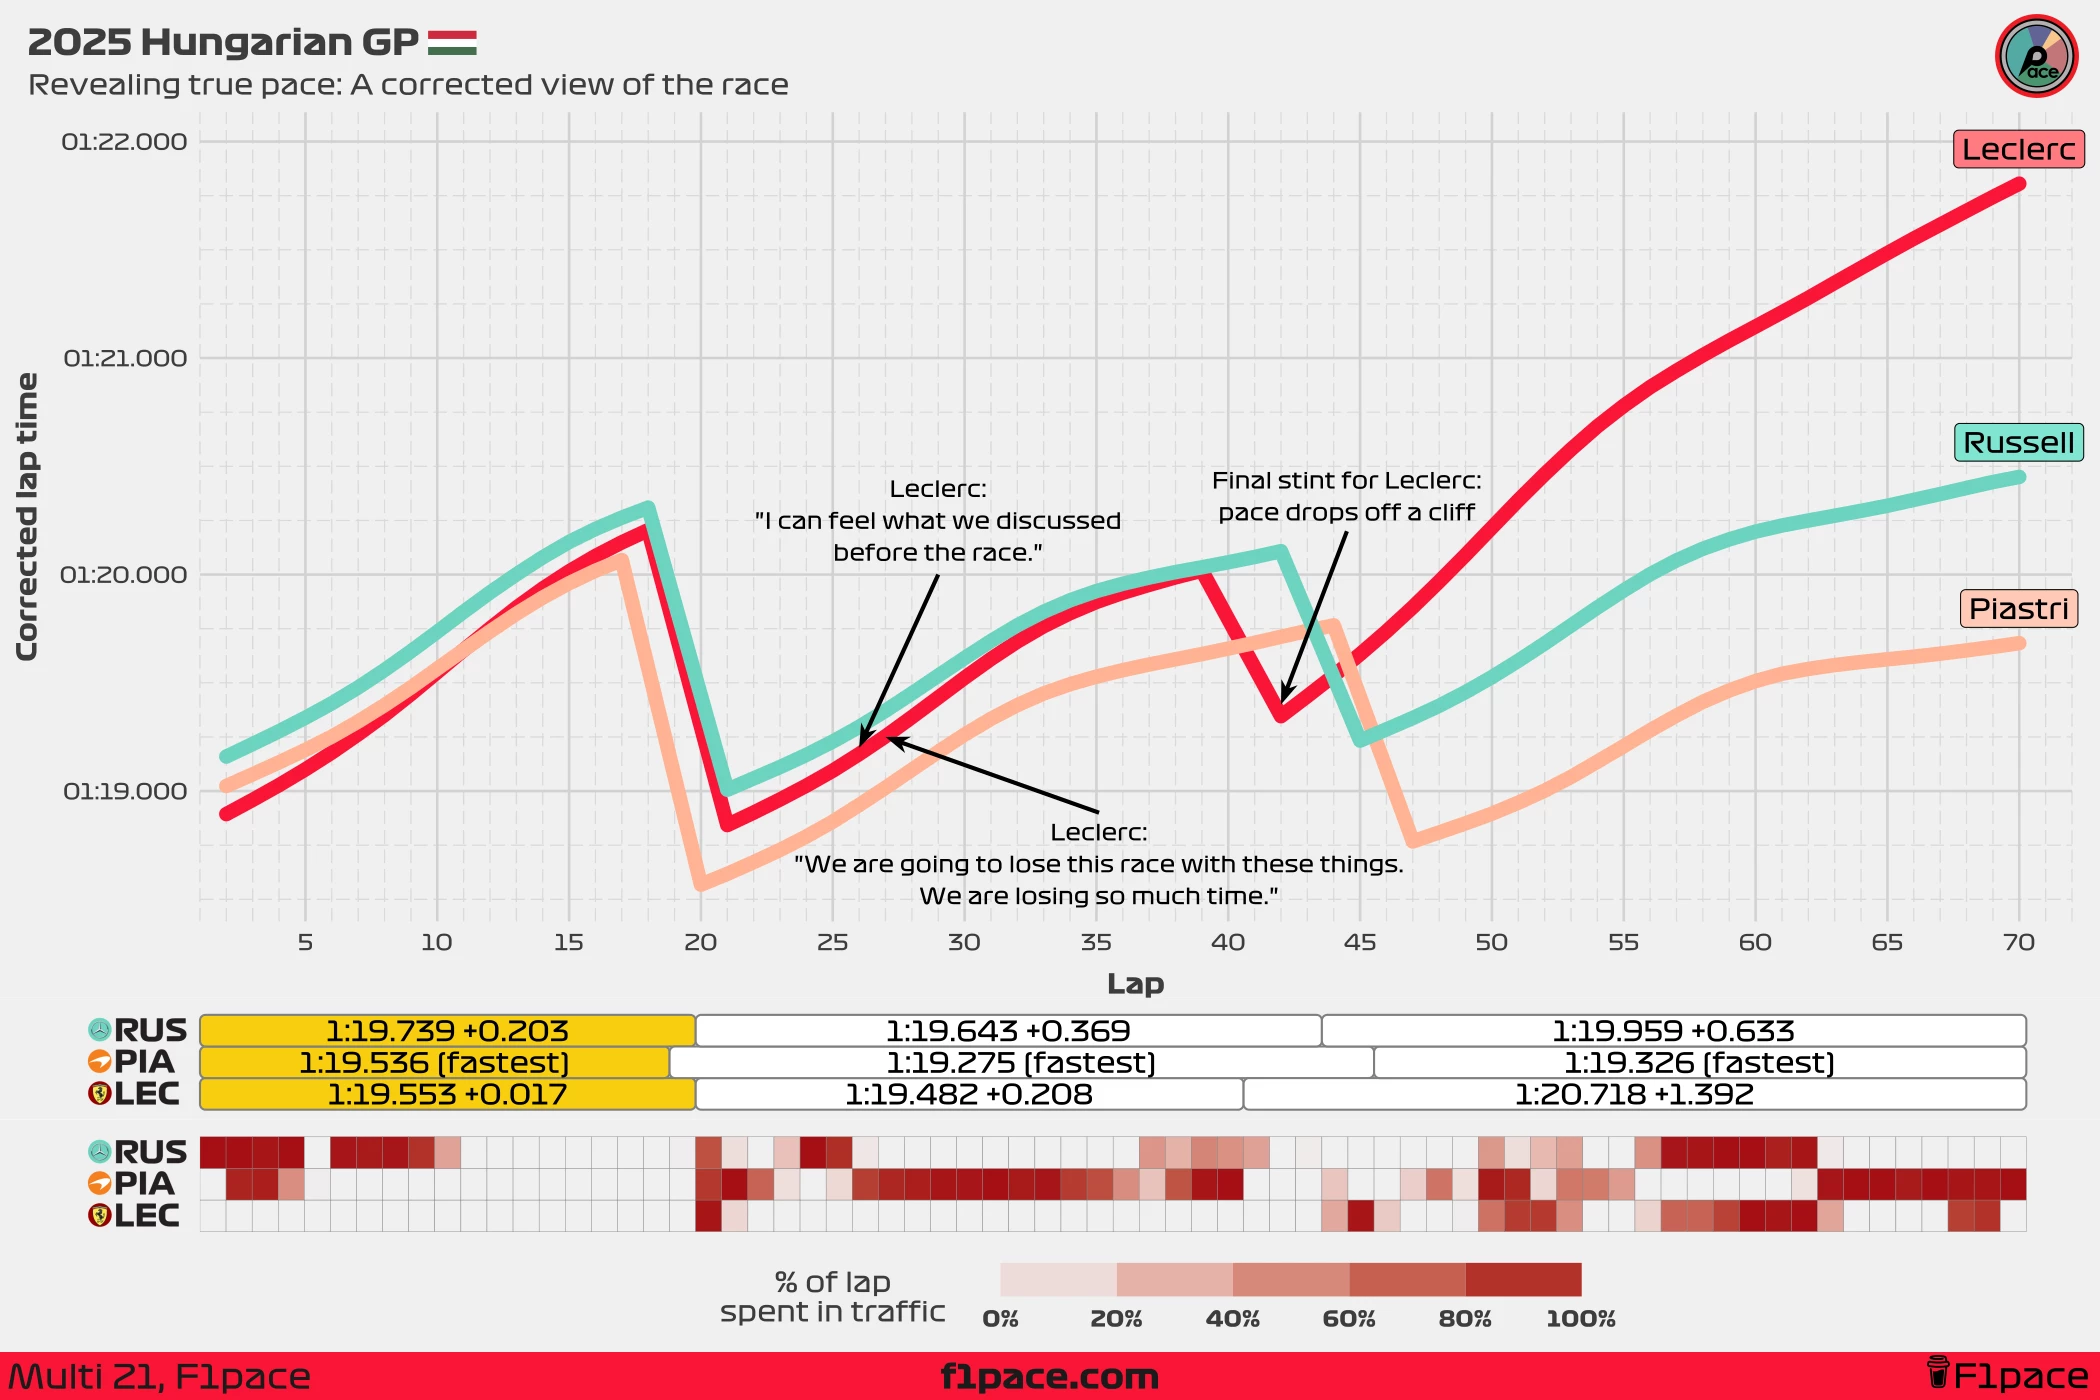
Looking at the corrected version of the race, a very interesting story starts to emerge. When we break down each stint, you’ll notice that lap times get steadily slower, rather than jumping up and down. That’s because, with our corrections in place, what we’re seeing now is mainly the impact of tire degradation and the driver’s own input.
Of course, we can’t directly model whether a driver was pushing hard or taking it easy to save their tires, but we can observe the overall effect. What these smoothed lap times show us is the combined influence of tire wear and the way each driver chose to manage their race. We’re effectively isolating the signal (tire deg and driver performance) from the noise (fuel effect, track evolution & traffic.)
| Stint | Mean lap time (Leclerc) | Mean lap time (Piastri) | Delta |
|---|---|---|---|
| 1 | 1:22.157 | 1:22.264 | -0.11 secs |
| 2 | 1:21.323 | 1:21.339 | -0.02 secs |
| 3 | 1:21.516 | 1:19.947 | 1.57 secs |
The first stint
If we focus on the first stint, it’s clear that Piastri and Leclerc were almost identical on pace. Their corrected average lap times were separated by just 0.017 seconds—less than two hundredths of a second. Meanwhile, George Russell was a bit off compared to the Ferrari and McLaren, trailing by just over two tenths.
Now, even though the model shows only a tiny gap between Piastri and Leclerc, the raw lap times tell a different story: about a tenth in Leclerc’s favor. But this makes sense when you remember Piastri spent a few laps right on Leclerc’s tail, and even more laps still dealing with the dirty air from the Ferrari. By correcting for those effects, the model gives us a much clearer picture of how closely matched they actually were.
The second stint
In the second stint, the picture changes quite a bit. On raw lap times, Leclerc and Piastri look pretty much the same, with just a 0.02 second gap per lap in Leclerc’s favor. But when we look at the corrected data, we see a diffent picture.
According to the model, Piastri was actually the fastest driver in the second stint, beating Leclerc by an estimated two tenths per lap. So, why does the corrected data show such a bigger gap? If you check the traffic chart, you’ll notice Piastri spent almost the whole stint stuck behind Leclerc. That meant he was running in dirty, turbulent air, which slows you down. By removing the effect of traffic, we get a better read on Piastri’s true pace for this part of the race.
What’s even more interesting is that you can track the moment Leclerc’s performance started to drop off. Early in the stint, he was already a bit slower than Piastri, but both were lapping pretty consistently. Then there were those two radio messages from Leclerc—the first one on lap 26, where he mentioned he could “feel” something that was already discussed with the team, and another a lap later, this time sounding more concerned. On lap 27, he said they were “losing so much time” and might lose the race if things stayed the same. Right around these laps, you can see Leclerc’s lap times getting worse. From lap 26 to lap 39, his times start to drift away from Piastri’s and get closer to Russell’s.
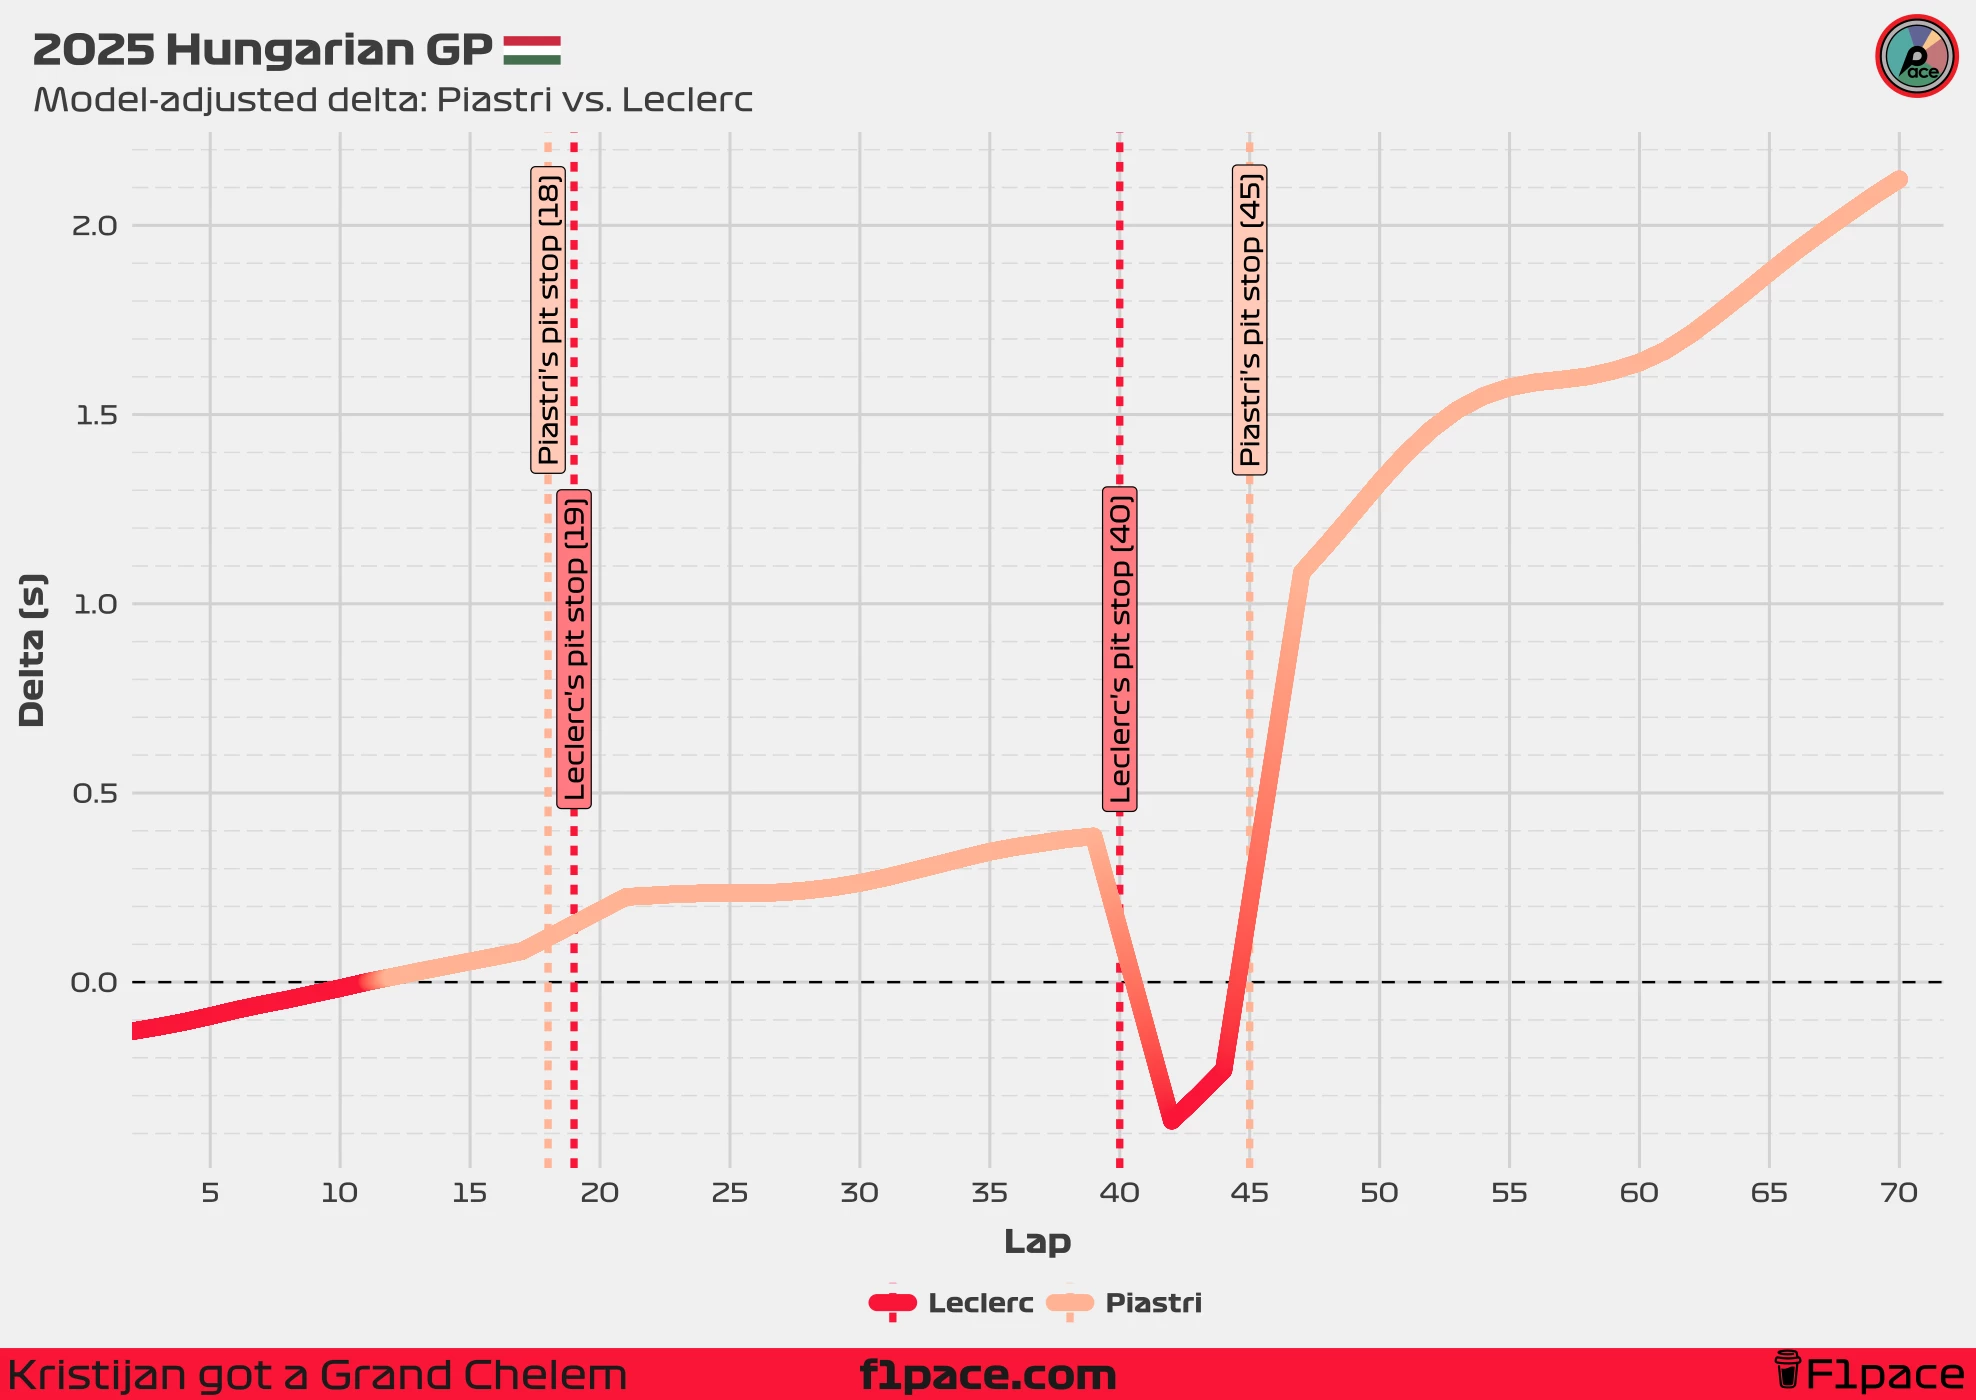
By the end of the stint, Leclerc wasn’t just trailing Piastri by almost four tenths per lap (0.385 seconds), but he was basically just as fast as Russell, just a hundredth slower per lap. For me, that pretty convincingly shows that something started going wrong with Leclerc’s car well before his final pit stop on lap 40.
The third stint

The last stint really tells its own story. As soon as Leclerc came out of the pits for the second time, his performance just disappeared. By lap 50, he was already about seven tenths slower per lap than Russell and more than 1.3 seconds off Piastri’s pace. It just kept getting worse and by lap 70, he was over two seconds a lap slower than Oscar.
Whatever the problem was, it totally took away his pace. In those final laps, Leclerc just didn’t have anything to fight with and there wasn’t much he could do to hold off Piastri and Russell.
Findings overview
What can we take away from the output of our model?
- Piastri and Leclerc were very evenly matched during the first stint. There was nothing to separate them; they were virtually just as fast.
- After the first pit stop, in the second stint, Piastri was already faster than Leclerc. On lap 21, Piastri was estimated to be just over two tenths (0.225 s) quicker per lap than Charles. By the end of Charles’s stint on lap 39, Oscar was almost four tenths (0.385 s) faster per lap.
- Leclerc’s second stint was already worse than Piastri’s right from the start, but it got progressively worse after laps 26 to 28. This, coincidentally (or not), matches the laps when Charles complained on the radio about issues with the car’s performance.
- After the final pit stop, Charles lost all of the pace he had at the start of the race. His lap times completely fell off a cliff, and he was much slower than both Russell and Piastri.
In my opinion, all of these findings—combined with the cryptic radio messages from Charles during the second stint—point to a problem that started to show up around lap 25. Charles complained about losing time, and the corrected lap times immediately show a drop in performance. While his lap times were still competitive for a while, there was a clear negative trend in car performance. I don’t think the problem started right after the second pit stop; it seems like it began well before he came in for new tires on lap 40.
The third and decisive stint just makes it obvious how bad things got for Charles. After that last stop, his lap times didn’t just get worse, but they got dramatically slower in a way that was totally unexpected.
Speculation on what happened
The data helps us understand what happened more effectively, but it doesn’t answer why Leclerc lost so much performance. Still, we can speculate. Please note that the following is just my personal opinion, based on my knowledge of Formula 1 and what we’ve seen in the model’s output.
I think the plank wear issue mentioned by George Russell after the race is probably the most likely cause. Ferrari has already been disqualified this season for excessive plank wear, and they’ve been telling Lewis and Charles to lift and coast aggressively at several races. To me, it seems quite possible that the engine mapping, which controls how the engine responds to both driver commands and sensor inputs, began dialing back the power to preserve fuel and protect the plank. By reducing ERS (Energy Recovery System) deployment and cutting fuel flow, the car would have less top speed in certain sections. That reduced top speed also lowers compression under load and braking. I suspect this is about the time Leclerc started complaining, saying things like “I can feel what we discussed before the race” and “losing so much time.” Charles probably knew this behavior from the ECU was on the cards, and that it would seriously hurt his performance.
Now, regarding the final stint, I think that although both Ferrari and Charles expected the ECU to step in and limit the car to preserve the plank, the team may have realized that the plank wear was worse than they thought. Teams can’t directly measure plank wear, but all F1 teams have ride height and temperature sensors, along with accelerometers and onboard cameras. These tools together can give a pretty good idea of how quickly the plank is wearing away. It’s quite likely that, once they saw the wear was above expectations, Ferrari felt they had to act fast to avoid disqualification. This is probably where tire pressures became a factor.
If the SF-25’s ECU was already cutting performance to minimize plank wear, but it still wasn’t enough, then the team had to try something else. Increasing tire pressure was probably the only remaining option. Normally, teams want to run the lowest tire pressure possible, since this increases grip and usually helps tire performance as a side effect. With lower pressures, the tire is a bit shorter, which brings the car closer to the ground. In turn, this has a negative effect on plank wear. Fitting new tires with higher pressure, and therefore a taller profile, would raise the ride height and help protect the plank. Teams would never do this unless it was absolutely necessary to avoid getting disqualified, since there is a big performance trade-off. My guess is that Ferrari had no choice on Leclerc’s final stop; they put on fresh tires with increased pressure, which severely hurt his cornering grip. Combine that with the ECU already holding back the power, and you get a massive drop in pace, which became really obvious in that last stint but actually started showing up at the beginning of the second stint.
My conclusion
I think the easiest way to sum things up is with these bullet points:
- The team was aware that plank wear could be a problem during the race.
- To manage this, they had pre-planned power reduction modes built into the ECU, which were activated mid-race and caused the first big drop in performance. This is around the time Leclerc started to complain about “losing so much time.”
- Real-time data from the sensors and feedback from Leclerc showed that even with reduced power, the car was still wearing the plank too quickly. This likely caused panic within the team about a potential disqualification.
- The team decided to put over-inflated tires on Leclerc’s car as a last resort to physically raise the car and save the plank.
- The combination of power reduction in the ECU + over-inflated tires caused a “double penalty”: Leclerc was driving with a car that was down on power (due to the engine mode) and had terrible grip (due to the high tire pressures).
- This combination of issues culminated in catastrophic performance that started gradually (first due to ECU programming and power reduction), and then acceleratedly (due to overly-inflated tires) by the end of the race.
My plea
This is the one of the most advanced articles I’ve written for this blog. I’ve decided to embrace modelling to take my analyses to the next level. Doing inference with statistical models isn’t easy—it takes a lot of time to develop a useful and reliable model capable of producing meaningful insights. Creating this model and writing this article took me dozens of hours. I know the race was just a couple of days ago, but since it ended, I’ve been working on getting this article done. If you’ve enjoyed reading it, please consider becoming a supporter to help me continue writing in-depth articles like this one. Your support truly makes a difference and helps keep the blog going. Thank you!
