Use the Get in touch link if you’re interested in supporting this project.
Lando Norris was leading his teammate Oscar Piastri until he pitted on Lap 47. Unfortunately, a mistake by the pit crew resulted in a very slow stop, allowing Oscar to undercut him. While much can be said about the team ordering Piastri to let Lando regain the position, I decided to analyze the pit stops themselves to see just how likely this scenario was at the 2025 Italian Grand Prix. Let’s take a look at the numbers.
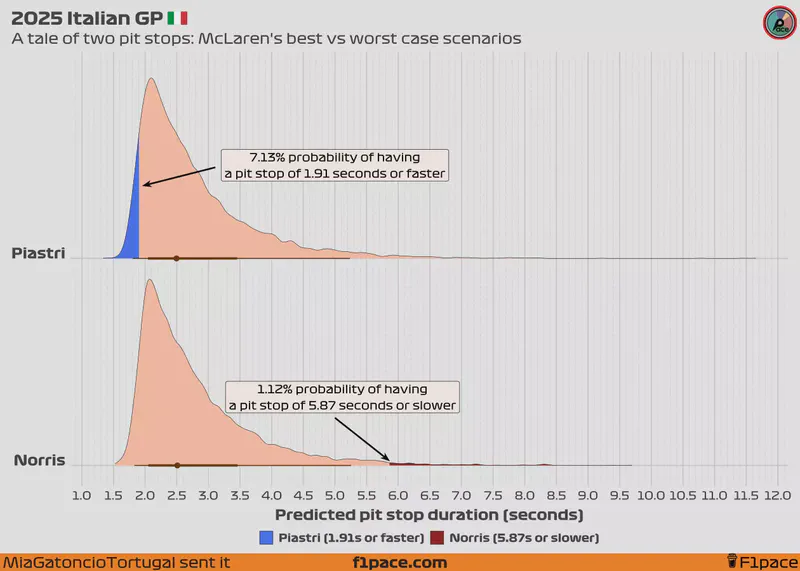
The model’s predictions
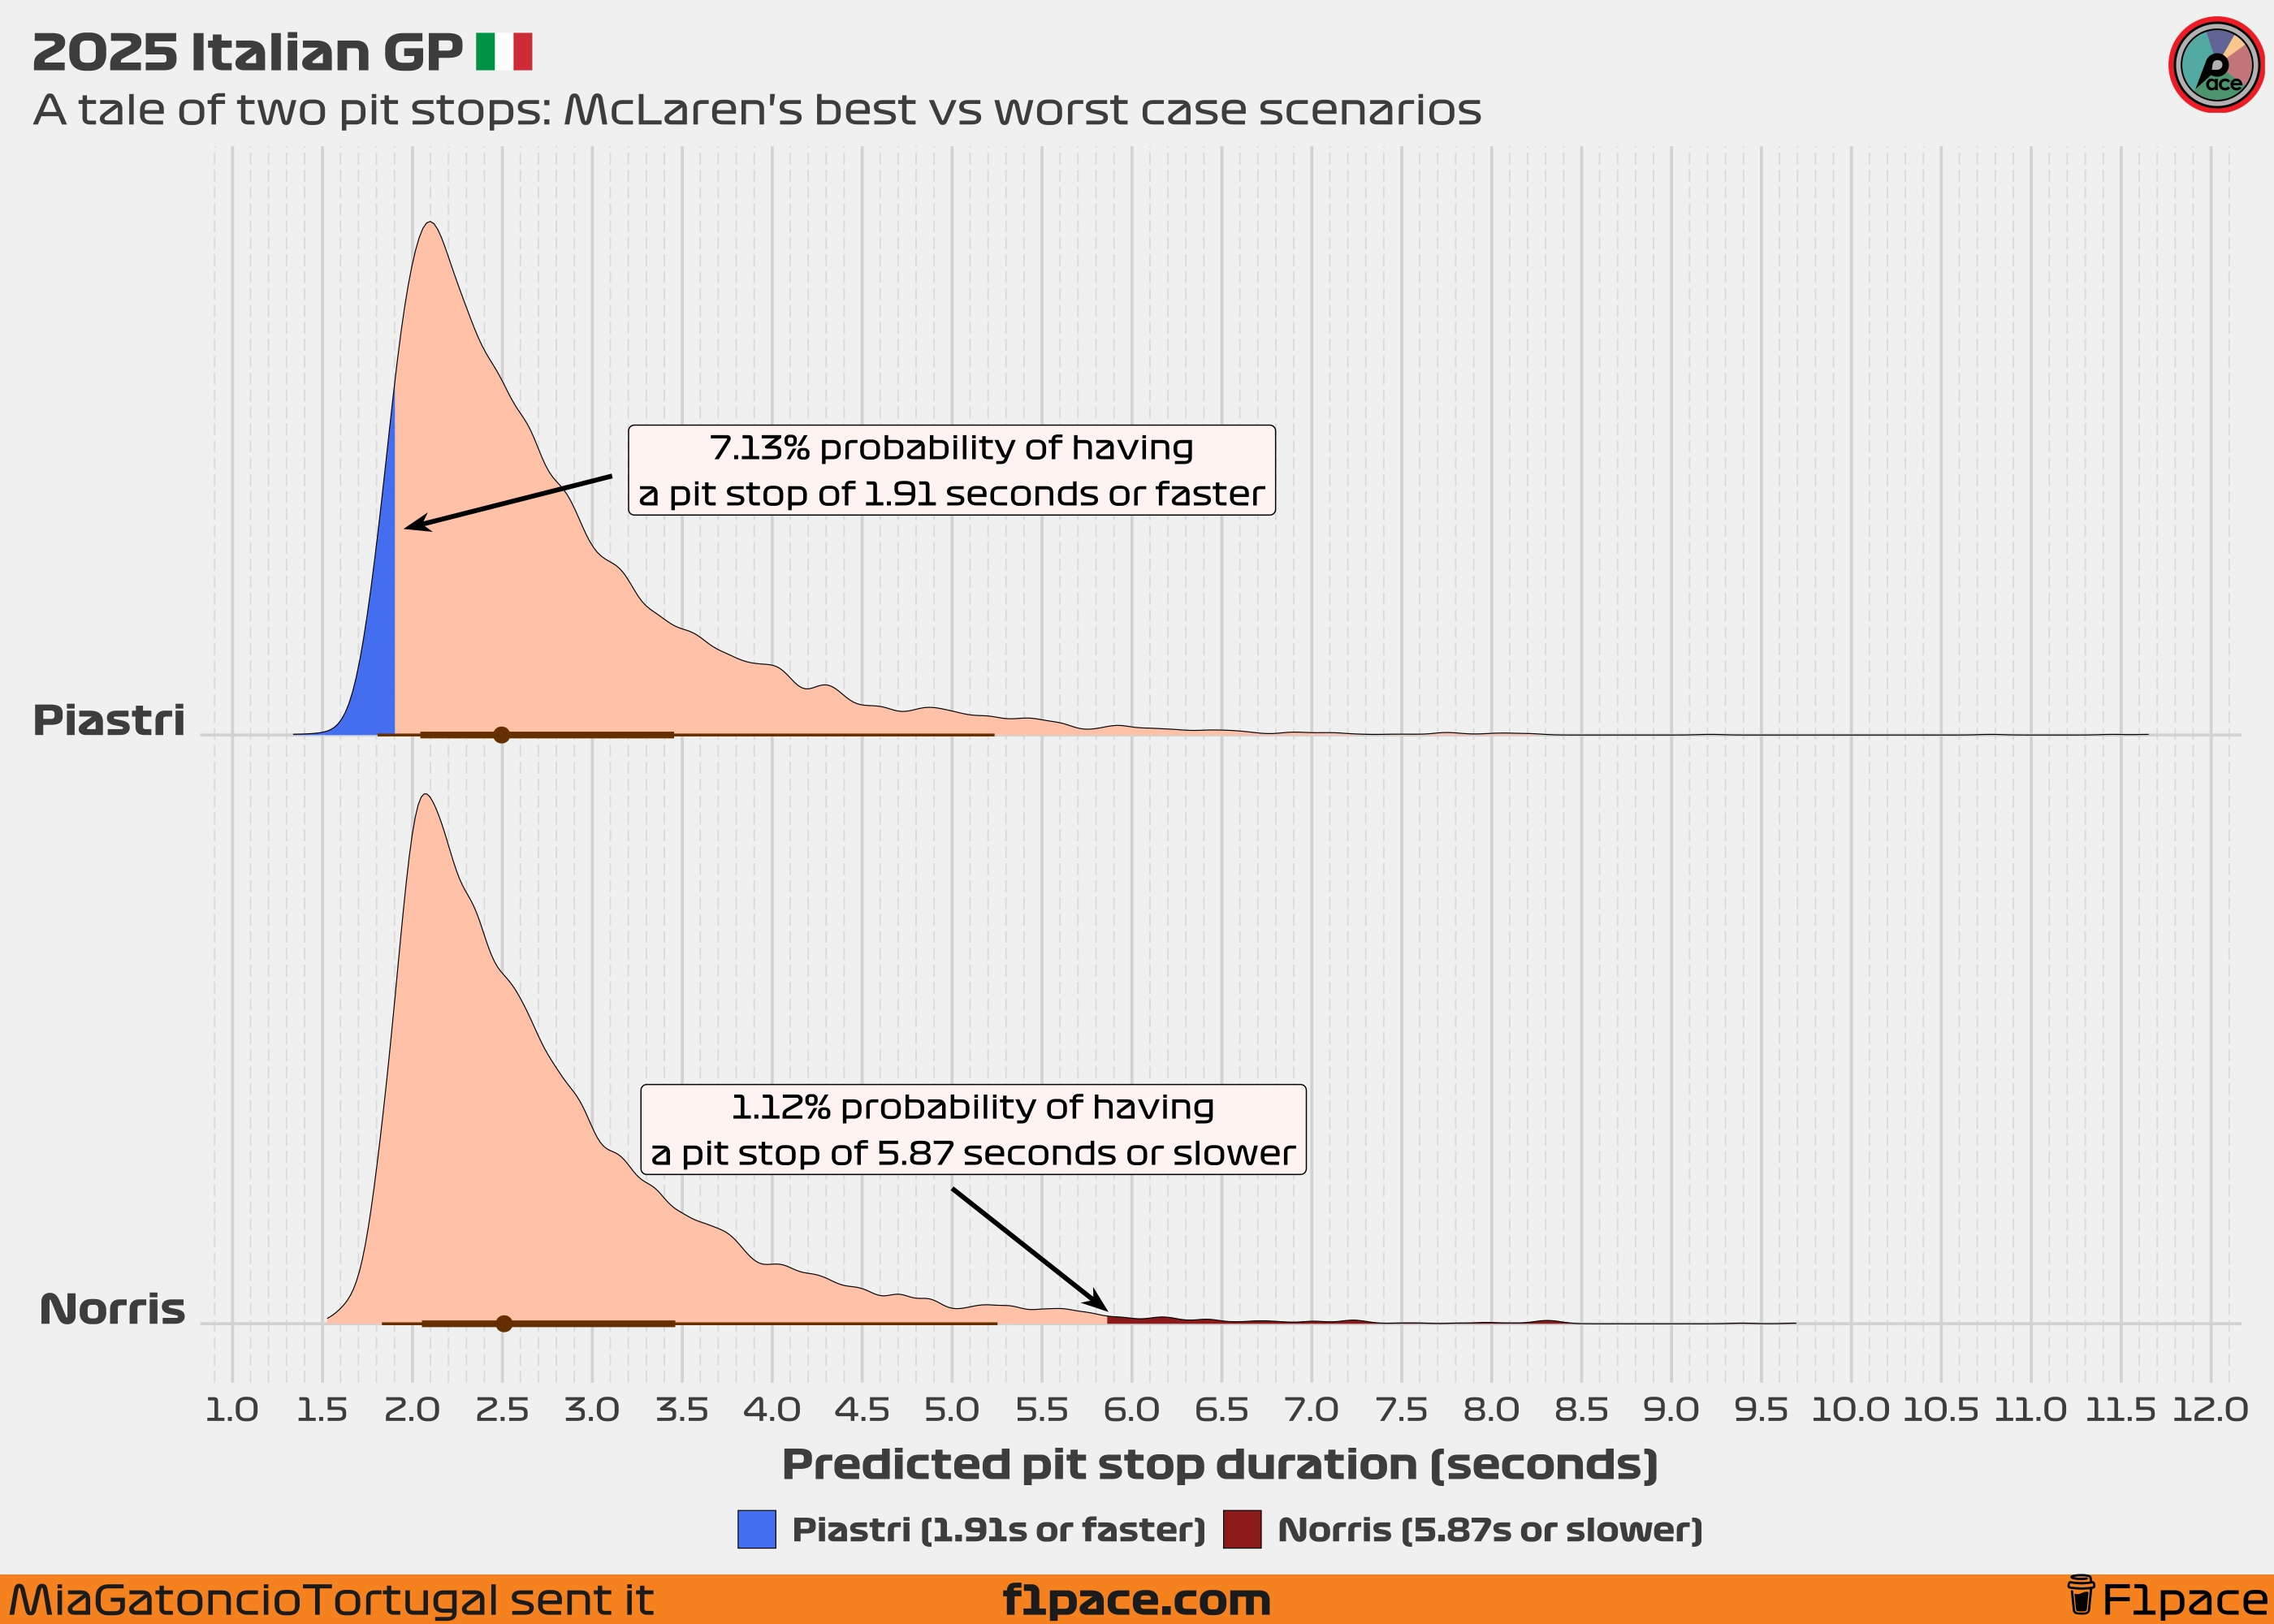
If you’ve been following this blog for a while, you’ll know I’ve created a model to analyze pit stops across the 2025 F1 season. While its main purpose is to understand season-long trends, it can also make specific predictions for drivers and teams. For this race, I used it to calculate the probability of two key events: Piastri’s season-record-breaking 1.91-second stop and Norris’s very slow 5.87-second stop.
I usually update the model weekly, and as of today, it includes data from Rounds 1 to 15 (up to the Dutch GP). Crucially, the model hasn’t seen any data from the 2025 Italian GP, so it’s not “cheating” with its predictions.
The model has only learned from the first 15 races of the season. Our model hasn’t seen any data from the Italian GP, so it isn’t “cheating” by knowing the outcome in advance.
Our model predicted that McLaren had a 7.13% probability (a 1 in 14 chance) of performing a pit stop of 1.91 seconds or faster for Piastri. Regarding Norris, the model gave the team only a 1.12% probability (a 1 in 89 chance) of having a stop of 5.87 seconds or slower.
This result shows that the sequence of events that allowed Piastri to overtake Norris was an extreme anomaly—but one that can still happen. Clearly, McLaren had a much higher chance of achieving an extremely fast stop like Piastri’s than suffering a catastrophic one like Norris’s. The odds of both happening in the same race were almost zero, and yet, here we are.
How to read the chart
If you are struggling to understand the chart, this section was made for you.
- The y-axis: Shows the two McLaren drivers being analyzed, Norris and Piastri.
- The x-axis: Shows the predicted pit stop duration in seconds, as generated by our model.
- The slabs: The slabs, or “domes”, provide a range of predicted values for a driver’s pit stop. These shapes visualize the full range of likely pit stop times for each driver. The higher the dome, the more probable the time. The very peak represents the single most likely outcome.
- The shaded area: The colored sections highlight the specific probabilities we’re interested in. The blue area shows the chance of Piastri having a stop of 1.91 seconds or faster, while the red area shows the chance of Norris having a stop of 5.87 seconds or slower.
- The black dot and horizontal bars: The dot and bars below each slab represent the represents the median value and the the “most likely” ranges for our predicted value.
Conclusion
So after looking at the numbers, what’s the takeaway?
Well, the model showed that a super-fast stop for Piastri wasn’t actually that surprising. While it was a season-best pit stop, our model shows that it had about a 1 in 14 chance of happening, which is rare, but definitely possible. The real shocker was Norris’s stop. The probability of a stop being that slow was just over 1%, a true 1 in 89 long shot.
What this tells me is that the whole situation that led to the controversial team orders was caused by an extremely unlucky moment for Norris. It just goes to show that while we can talk about strategy and performance all day, sometimes a race is decided by a single moment of incredibly bad luck.
Final remarks
If you enjoyed this analysis, consider becoming a supporter. Your contribution makes a real difference and helps me continue writing in-depth F1 articles like this one.
Stay tuned for future updates to the F1pace Pit Stop Power Rankings and many more data-driven stories to come. Thank you for reading!