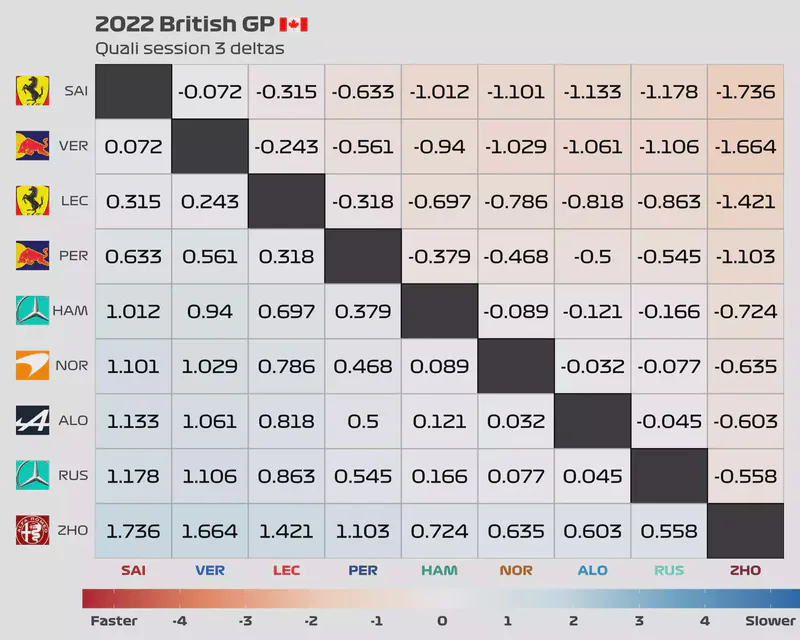
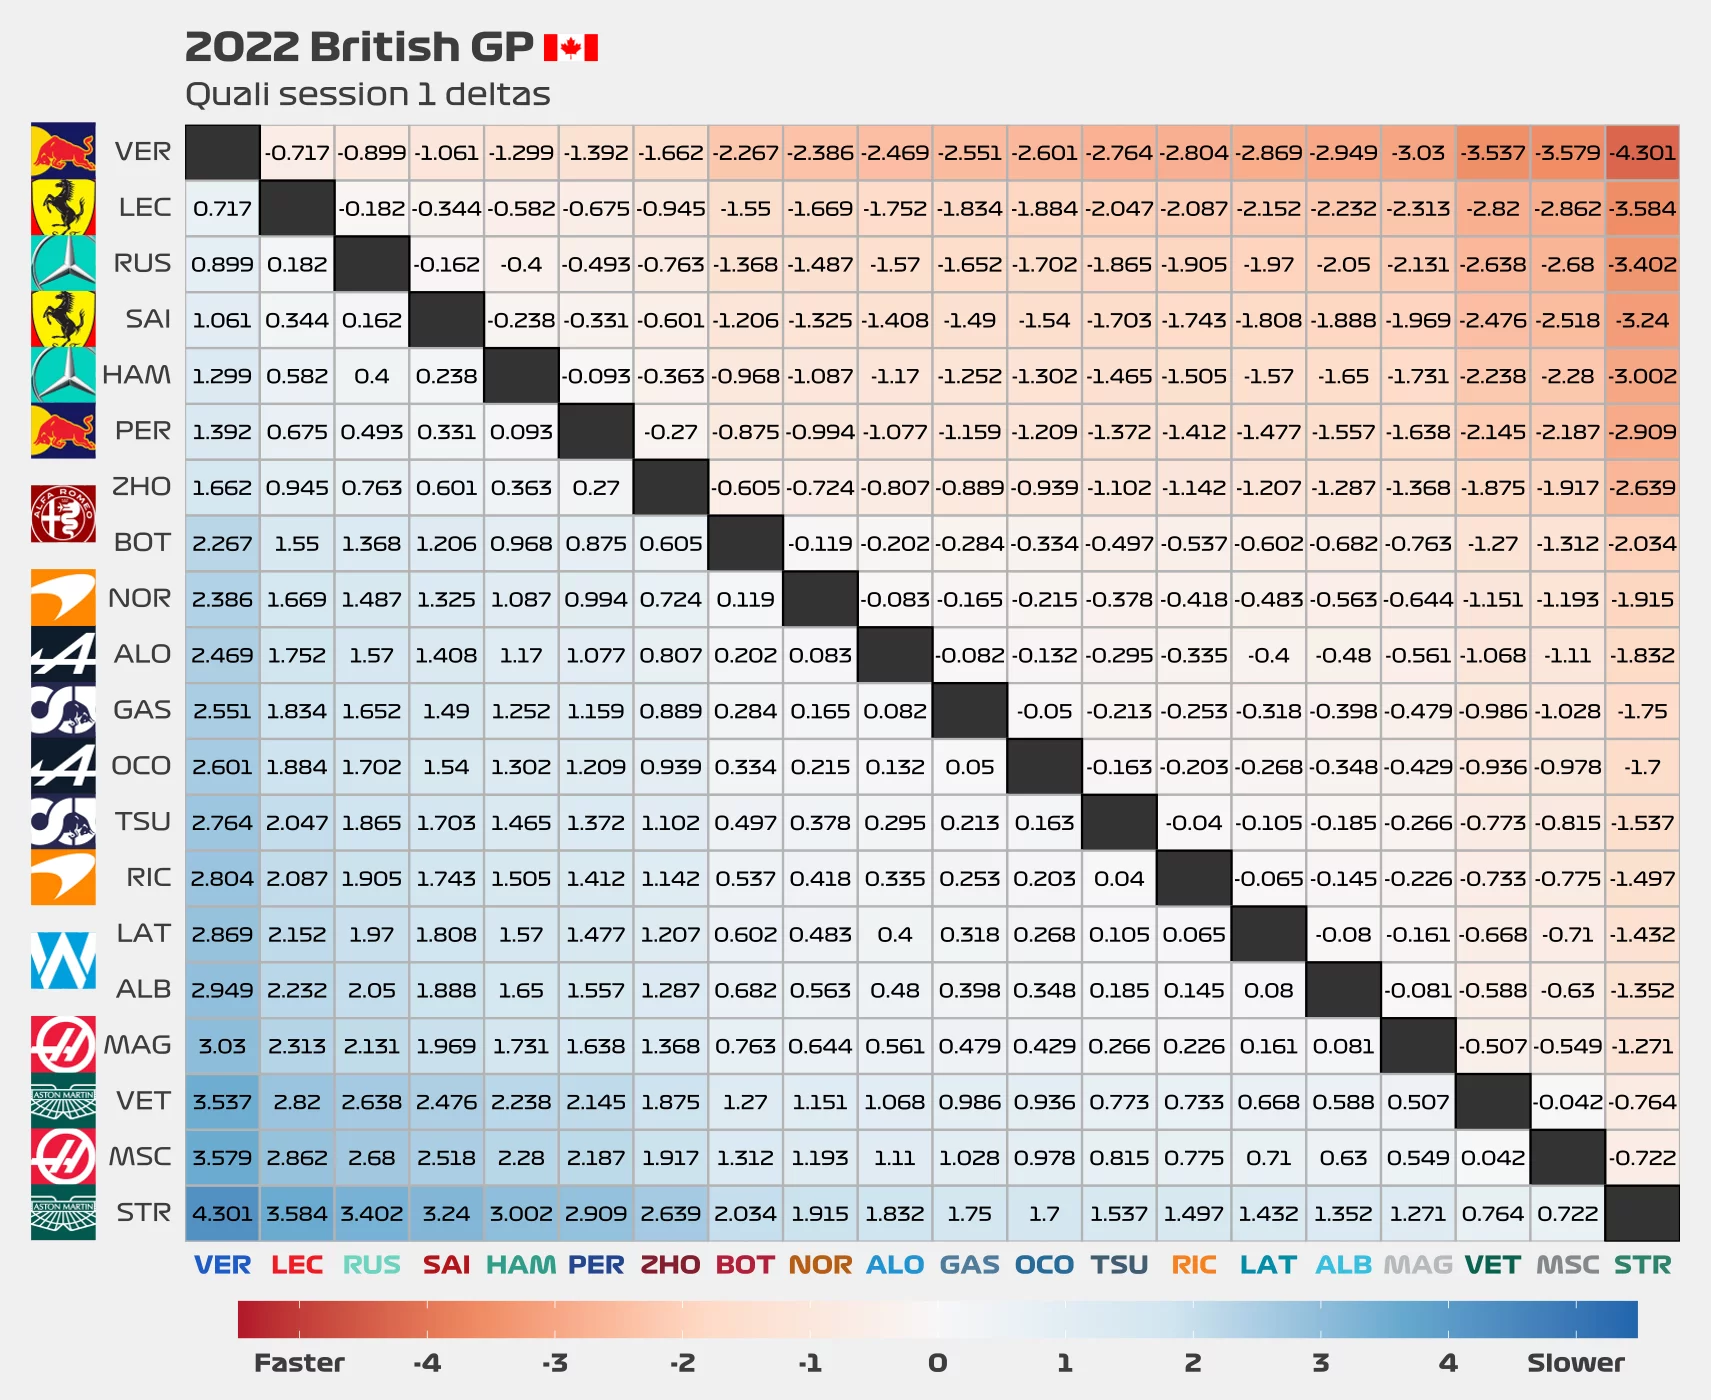
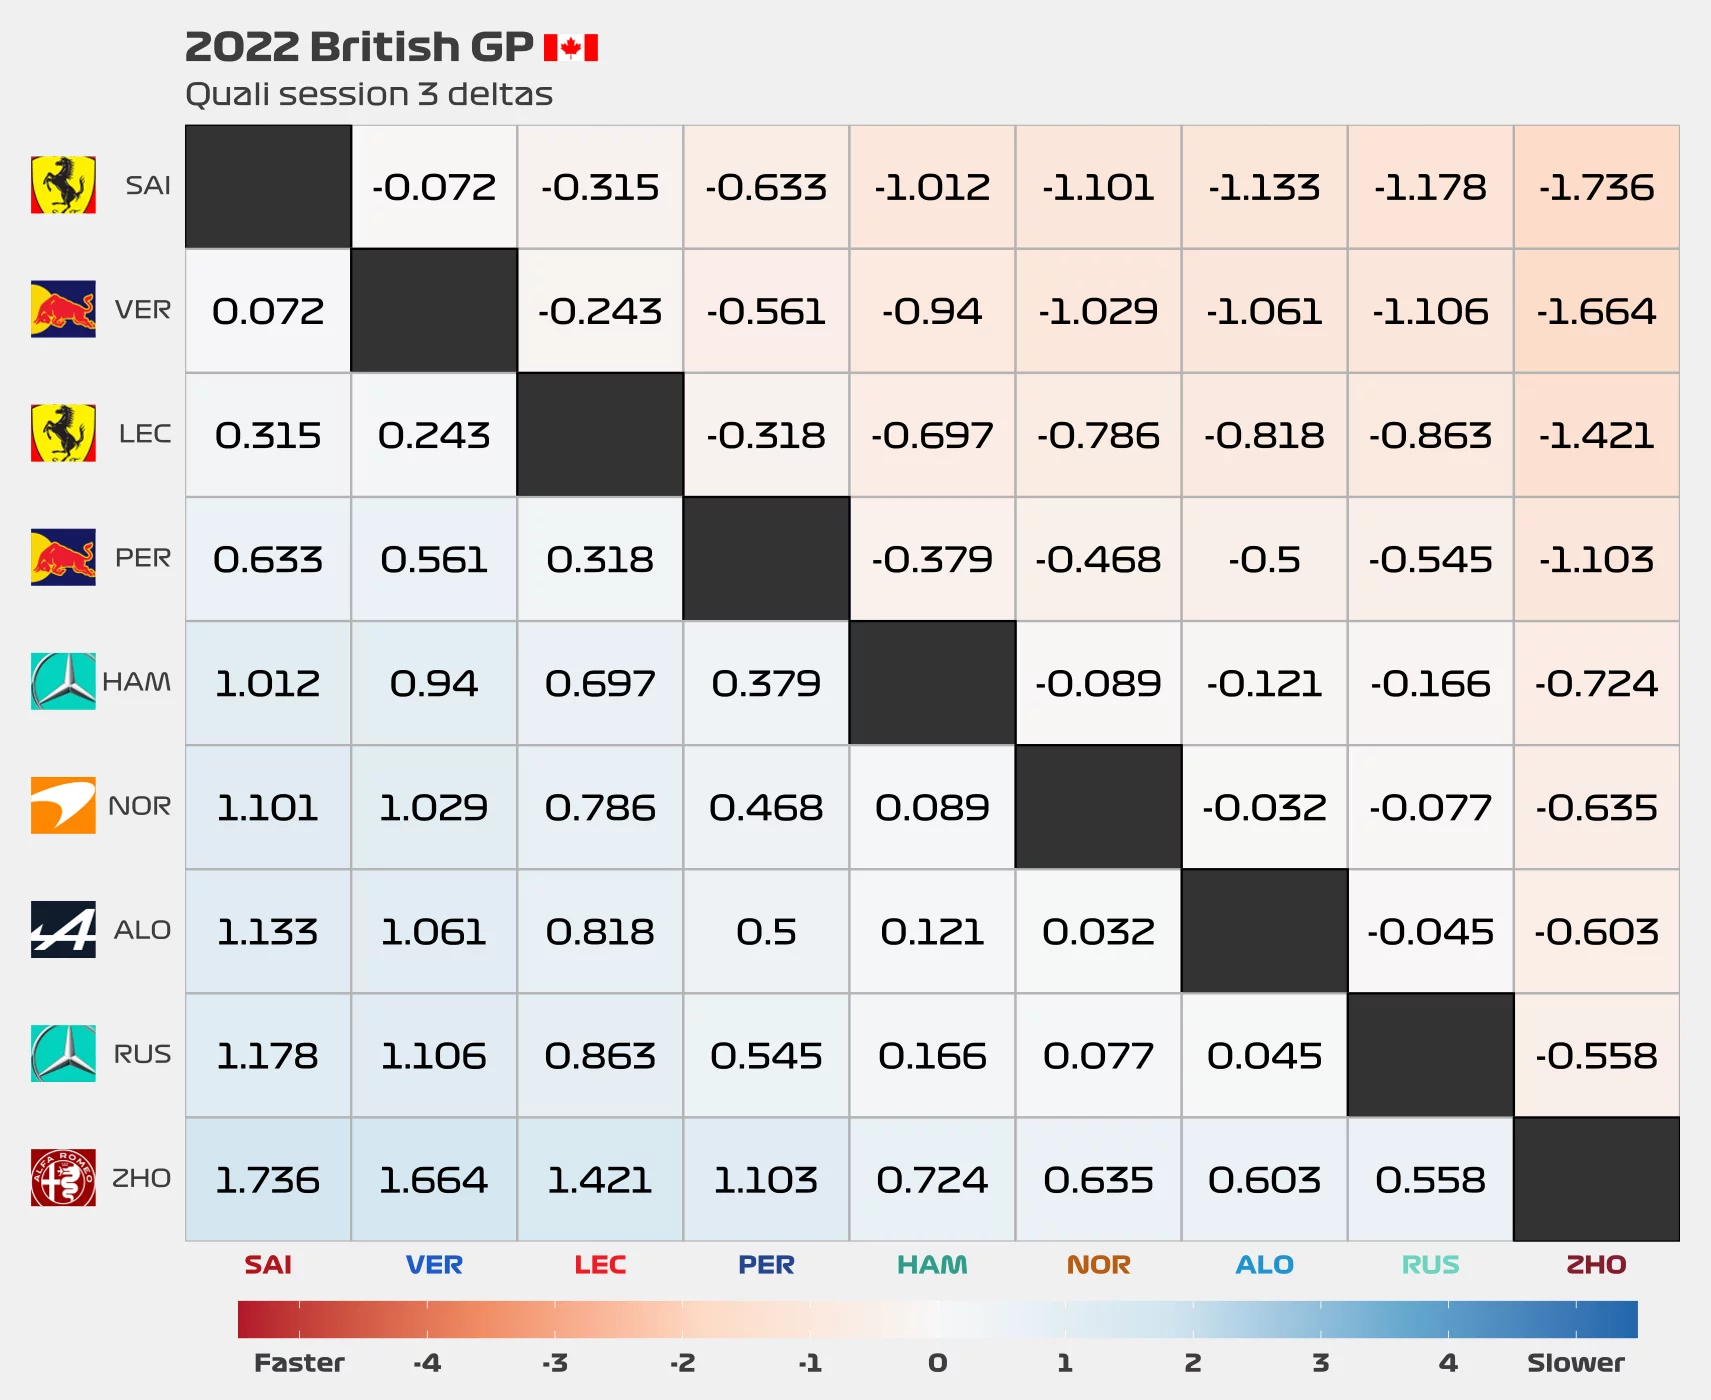
Quali session deltas
The quali session deltas plot shows all the deltas between the different drivers for all of the 3 quali sessions of the day.
You can read the charts like this:
- Choose a driver from the left side of the plot (y-axis)
- Choose a second driver from the bottom of the plot (x-axis)
- See where they intersect. The number that you see is the delta for their best lap in that quali session.
- Negative numbers mean the driver on the left side was faster than the driver he’s being compared to.
- Positive numbers mean the driver on the left side was slower than the driver he’s being compared to.
- For example: Leclerc on Q3 vs Pérez on Q3. The delta is of -0.282 seconds. This means that Leclerc’s best lap was 0.282 seconds faster than Pérez’s.

Quali session summary table
Just as before, I am adding a table that contains most of the information about the quali session. For this particular race, the chart only contains data from laps that I considered valid flying laps. If a driver had a very slow flying lap because of a spin or a mechanical problem, then that lap was not included here.