I posted my qualifying delta between teammates article not so long ago and it went on to have decent success. A day ago there was a post on Reddit that analyzed quali performances—specifically for Lewis vs Russell—but mentioned the gaps for the rest of the teams. The numbers didn’t make a lot of sense in my mind, so I decided to analyze them and see how the original author came up with them.
The article is Mark Hughes: The theories behind Hamilton’s qualifying defeats, posted by the digital-only motorsport channel The Race.
Before starting, I will make something very clear. I respect everyone in the media, especially those who do data analyses. Working with data is difficult and very time-consuming, and it’s very easy to make mistakes. Mark Hughes has posted technical articles for a long time. He’s one of the few journalists who still delves into technical data, which is something that I appreciate. Having said that, his article was conflicting for some reasons which will be discussed in the next few paragraphs.
Red flags
Lap time deltas
It has been generally accepted that using raw deltas to compare performances between tracks with different lengths and characteristics is a bad idea. Not adjusting for track length will usually bias the result, causing problems with the final data analysis. However, in many cases, these numbers will usually not be drastically different from the raw delta numbers. Why? Because the time deltas between drivers are usually pretty small, to begin with, so even if you adjust, the results will change once again by a very small margin. Still, this is a practice that in my opinion shouldn’t be accepted. At times you will get lucky with the results, but sometimes you will get spurious results that can alter public perception of events that have happened.
Adjusted for the various lap lengths
A very similar issue to the previous one. Adjusting for lap lengths is fine and is usually done by converting to percentages so that each delta is relative to the track in question. However, here we were presented with deltas on a time scale, not a percent scale. How were these deltas adjusted? There are many ways to standardize the data, but they all have downsides and can cause spurious results. It is my opinion that whenever data is being manipulated, mentioning the methodology is critical to validate the results. In this case, I have no idea how were these lengths “corrected,” which will always be a red flag in my book. Don’t do this.
Comparable sessions only
Another tricky one. Mentioning that only “comparable sessions” were used for the analysis means that some sessions were deemed as “not comparable,” therefore being removed from the final analysis. This is an issue since we don’t know which sessions were removed and why. What if they deem a session to be “not comparable” while I deem that same session as comparable? This will cause the final results to be different, and in some cases, will completely change their interpretation. They already know which sessions were removed from the analysis, so why not state them? It requires a simple disclaimer at the end saying which sessions were removed.
Conflicting information
The article focuses on the delta between Hamilton and Russell. If we consider only quali sessions, then the balance is 7 to 1 in favour of Russell. If we include the sprint quali sessions, then we would see Russell leading Hamilton 8 to 2.
In the text we see the author repeat that Russell is 7-1 in qualifying, and yet, the table with the deltas presents information that includes data from quali and sprint quali sessions. The text also mentions that “the Mercedes drivers are the second-most closely-matched pair on the grid,” but this includes sprint quali sessions as well. If only quali sessions are considered, then the delta must only include quali sessions. If sprint quali sessions are included, then Hamilton is not down 7-1, but 8-2. And yet, the flow of the text is based on data that includes quali and sprint quali. Just, why?
Analysis
Let’s start by comparing their data with the raw quali data. Since they mentioned “comparable sessions only,” I have to assume that they used the maximum quali session in each race in which both drivers from the same team participated.
Their data vs raw data
Raw data vs data provided by The Race
| Team | Average delta | Average delta (The Race) | Delta between sources |
|---|---|---|---|
| McLaren | 0.335 | 0.042 | 0.293 |
| Mercedes | 0.103 | 0.062 | 0.041 |
| Alpine | 0.133 | 0.104 | 0.029 |
| RB F1 Team | 0.141 | 0.104 | 0.037 |
| Ferrari | 0.038 | 0.156 | -0.118 |
| Aston Martin | 0.116 | 0.218 | -0.102 |
| Sauber | 0.556 | 0.265 | 0.291 |
| Haas | 0.300 | 0.276 | 0.024 |
| Williams | 0.286 | 0.277 | 0.009 |
| Red Bull | 0.312 | 0.302 | 0.010 |
Ok, something is weird. The raw average deltas are very different than the ones presented by The Race. Is this due to their “correction?” It’s extremely doubtful unless they made a catastrophic mistake. Most likely this is caused by their “comparable sessions only” adjustment. Let’s try to decipher what happened for each team.
First of all, the delta at McLaren is completely off. My best guess is that they removed the sprint quali session from the Chinese GP because apparently, Piastri had some gearbox issues. We’ll remove that session for the British team and recalculate the results.
At Sauber, we get something very similar. The delta between my data and their data is almost 3 tenths, which means that they must have removed at least one session. Their largest gap was found at the sprint quali of the Chinese GP, which was a rainy session. The gap between both drivers was of 2.5 seconds, but I couldn’t find anything regarding damage to Zhou’s car. I don’t believe this lap should be removed at all. Rain creates bigger gaps between drivers, but rain is a part of motorsport. Some drivers will adapt better than others, so in my opinion, this is a comparable session between both drivers. In any case, we’ll remove it to see if we can get closer to the numbers provided by The Race.
While doing research, I also found that apparently, Zhou picked up front wing damage at the quali session of the Australian GP. I will remove this data point too since apparently damage makes sessions “not comparable,” even though they’re also a part of racing.
Let’s recalculate the table before moving on.
Processed data after removing laps for Sauber and McLaren vs data provided by The Race
| Team | Average delta | Average delta (The Race) | Delta between sources |
|---|---|---|---|
| McLaren | 0.033 | 0.042 | -0.009 |
| Mercedes | 0.103 | 0.062 | 0.041 |
| Alpine | 0.133 | 0.104 | 0.029 |
| RB F1 Team | 0.141 | 0.104 | 0.037 |
| Ferrari | 0.038 | 0.156 | -0.118 |
| Aston Martin | 0.116 | 0.218 | -0.102 |
| Sauber | 0.267 | 0.265 | 0.002 |
| Haas | 0.300 | 0.276 | 0.024 |
| Williams | 0.286 | 0.277 | 0.009 |
| Red Bull | 0.312 | 0.302 | 0.010 |
Alright, so the numbers are starting to make more sense. It seems we’re on the right track. Time to move on to the rest of the teams.
At Aston Martin, it appears that the writer has removed the quali from the Australian GP. Alonso messed up his lap, went up onto the gravel, and apparently picked up an “unknown problem”. I honestly don’t see how is this session not representative. He made a mistake, and even if he damaged the car, that’s on him. I don’t think it’s fair to punish Stroll and say that the session didn’t count because Fernando made a mistake. Still, even after removing this data point, it appears that the writer removed another session. I’m not really sure which session was this one, but it has to be one in which Stroll beat Alonso, otherwise the numbers won’t match.
At the Miami GP, Alonso said that they made some set-up changes but didn’t mention any problem whatsoever so that rules out removing that session. Alonso complained about traffic at the Monaco GP, but once again that’s part of racing so I don’t see why would anyone remove that session either. I couldn’t find anything related to car issues at the Emilia Romagna GP either, so that leaves us with very few options.
I have to assume that the article removes the Miami sprint quali. If we remove that data point then we get to an average of 0.210, which is very close to the 0.218 provided in the table. I don’t know why would we remove that data point though. Alonso did little running before the sprint quali session, but I mean, is that enough to say that it’s not a valid “comparable session?”
Finally, we have Ferrari. Out time is very different from the time provided by The Race so we know that they removed some laps. The Race has Leclerc beating Sainz by an average of 0.156 seconds, while we have him winning by just 0.038. Since we’re just focusing on the comparison between Leclerc and Sainz, we removed the Saudi Arabian GP since Sainz couldn’t participate due to health issues.
Leclerc mentioned that he didn’t maximize the performance at the Australian GP, but said nothing regarding car damage. Charles also said that he was just slow at the Japanese GP, so once again I don think that session was removed either. That only leaves us with the sprint quali session of the Chinese GP, and I guess the writer could say that the justification is that a rainy session isn’t comparable. I would completely disagree with this, but I don’t know how else can we get close to the numbers shown in the article. I will remove that data point and see what we get.
Processed data after removing laps for Sauber, McLaren, Aston Martin & Ferrari vs data provided by The Race
| Team | Average delta | Average delta (The Race) | Delta between sources |
|---|---|---|---|
| McLaren | 0.033 | 0.042 | -0.009 |
| Mercedes | 0.103 | 0.062 | 0.041 |
| Alpine | 0.133 | 0.104 | 0.029 |
| RB F1 Team | 0.141 | 0.104 | 0.037 |
| Ferrari | 0.086 | 0.156 | -0.070 |
| Aston Martin | 0.210 | 0.218 | -0.008 |
| Sauber | 0.267 | 0.265 | 0.002 |
| Haas | 0.300 | 0.276 | 0.024 |
| Williams | 0.286 | 0.277 | 0.009 |
| Red Bull | 0.312 | 0.302 | 0.010 |
What about Mercedes? Our raw average delta has Russell leading Hamilton with a gap that is almost twice as big as the one provided by the race. Let’s take a look at the data.
The only round we can remove to make the delta remotely comparable to the one provided by Mr Hughes is round 5, which is the Chinese GP quali session. Lewis made a bad mistake during his last flying lap, locking up the tires before T14. This error was definitely expensive, but then again, it was a human error. I don’t see any way to justify this data point, but as I’ve said, this is the only session that can be removed to that the numbers match the ones provided on the original article.
Processed data after removing laps for Sauber, McLaren, Aston Martin, Ferrari & Mercedes vs data provided by The Race
| Team | Average delta | Average delta (The Race) | Delta between sources |
|---|---|---|---|
| McLaren | 0.033 | 0.042 | -0.009 |
| Mercedes | 0.060 | 0.062 | -0.002 |
| Alpine | 0.133 | 0.104 | 0.029 |
| RB F1 Team | 0.141 | 0.104 | 0.037 |
| Ferrari | 0.086 | 0.156 | -0.070 |
| Aston Martin | 0.210 | 0.218 | -0.008 |
| Sauber | 0.267 | 0.265 | 0.002 |
| Haas | 0.300 | 0.276 | 0.024 |
| Williams | 0.286 | 0.277 | 0.009 |
| Red Bull | 0.312 | 0.302 | 0.010 |
I was going to do this analysis for all of the teams, but I’m very tired and I just don’t have it in me anymore. The numbers don’t perfectly match, so perhaps a session here and there was removed, but without massive implications to the interpretation of the analysis.
Laps removed
It looks like at least the following laps were removed from the analysis provided by The Race:
- Sauber: Australian GP quali (damage to Zhou’s car) and Chinese GP sprint quali (rain)
- McLaren: Chinese GP sprint quali (Piastri with gearbox issues)
- Aston Martin: Australian GP (unknown problem?) and Miami GP sprint quali (little run before sprint quali?)
- Ferrari: Chinese GP sprint quali (rain?) and at least another lap, but I just couldn’t figure out which one.
- Mercedes: Chinese GP quali (Lewis locking up in his final lap?)
I don’t agree with many of the laps that were most likely removed. Perhaps you could justify removing Piastri’s lap at the Chinese GP sprint quali, and Zhou’s lap at the Australian GP quali, but I think those are the only two that I could say were “anomalies.”
Rain caused a big delta between Bottas and Zhou at the Chinese GP sprint quali, but they were both driving under the same circumstances, with Bottas just doing better than Zhou. Regarding some of the other laps that were most likely removed, I also found little justification for their removal.
Even after doing extensive research and testing to see which laps could have been removed, I still can’t get a good match to the numbers provided by Mark Hughes. The fact that after at least 12 hours of research and testing, I still can’t seem to find how this data was calculated, is pretty concerning if you ask me.
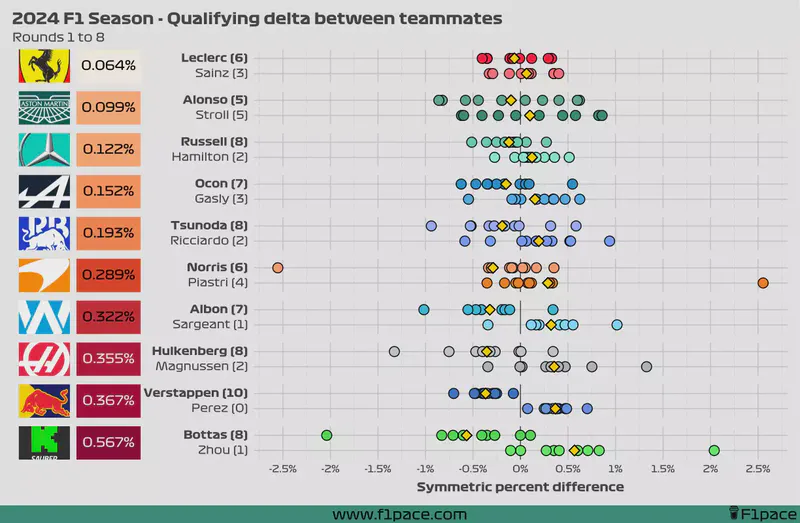
Overall qualifying delta
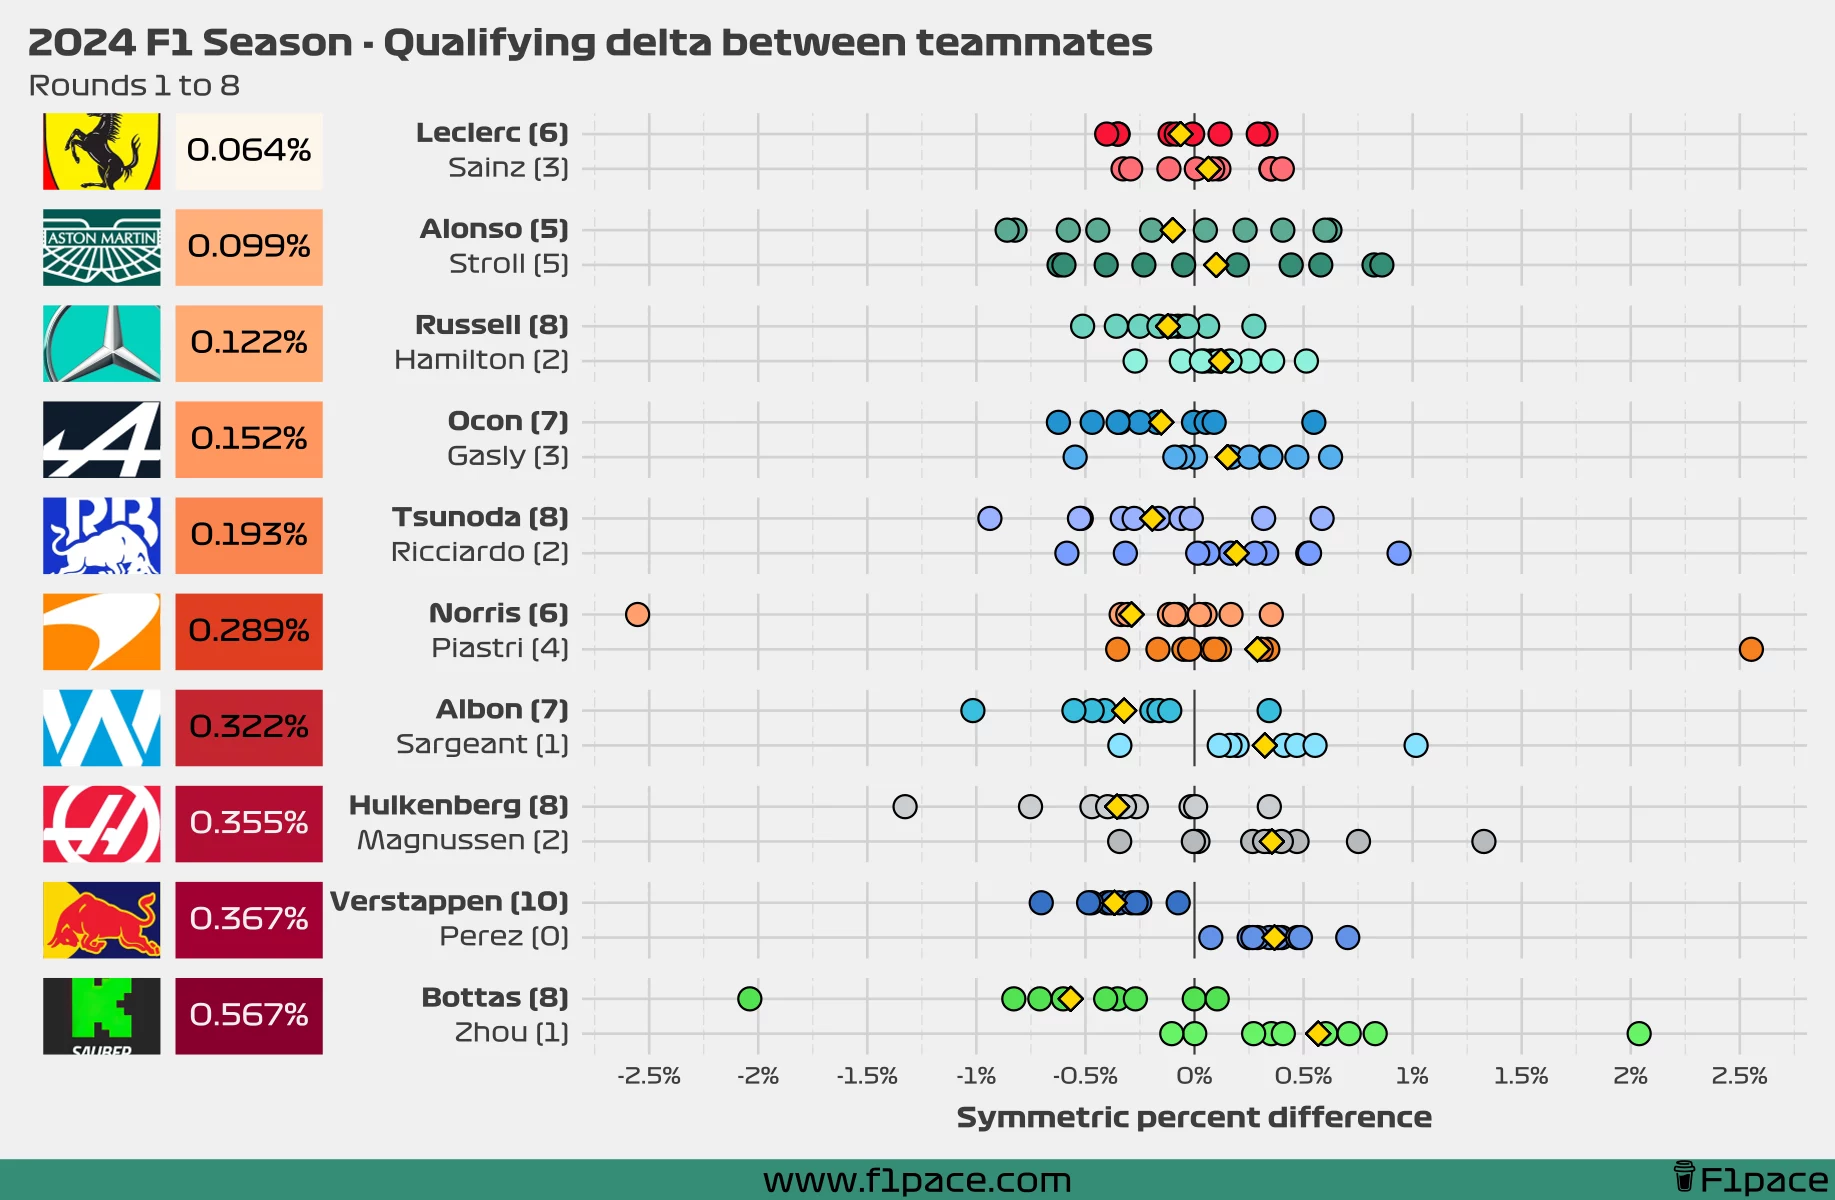
This is the chart that I would normally use to display the overall qualifying deltas between different teammates. Note that I rarely remove laps because I think that over the season things eventually balance out.
It’s also important to mention that for my analyses I rarely use the sprint quali session information. My reasoning is in fact quite simple. I just don’t think sprint quali sessions are nearly as important as regular quali sessions. Sprint quali only allows you to gain positions for the sprint race, which only gives a maximum of 8 points. Most teams won’t be near the front, so I doubt many will be pushing to the limit to get the chance to maybe get 1 point. Drivers are very competitive by nature, but they still know that it’s better to fight for more points at the race than it is to bin the car at sprint quali and have the mechanics rebuild it from scratch.
Since I’m only interested in a 1v1 analysis between teammates, I decided to keep only the official race drivers for this analysis. This means that I removed the data from Oliver Bearman since I’m only interested in the Leclerc vs Sainz battle for the Ferrari team.
Final (professional) remarks
I just find the whole article provided by The Race bizarre. The numbers don’t make a lot of sense, the text doesn’t match the stats provided in the table, and the whole article is in general quite shady. How hard was it to quickly mention which rounds were removed? I’m fine with not getting a ton of detail regarding how the laps were normalized, but at least tell me how these stats were calculated. Some of the results that they provide don’t match the original raw data at all. This can completely change the interpretation of the analysis, which is extremely concerning. You only need to take a look at at Mercedes’ delta. The gap balloons up from 0.060 to 0.103 when you don’t remove the Chinese GP lap. Was there any real reason to remove the lap? Is making a mistake during quali a good enough reason to say that the whole session is not comparable? This single session completely changes the interpretation of results.
Final (personal) remarks
I’ve started thinking about the article provided by The Race since I read it. The numbers just didn’t make sense to me and that’s why I decided to run my analysis. Spending 12+ hours working on this was exhausting, and even after all that work, I don’t know how some of these numbers were calculated. Some of the laps were removed for pretty much no reason, which seems incredibly questionable.
This blog has been a source of proper information for a long time. When I started this project in 2019 I had the objective of making this site educative, interesting, objective, and transparent. I’ve done this for a very long time, always doing my best to give you the best information available. I’ve spent hundreds and hundreds of hours working on this blog and I’m still not satisfied. And yet, articles like the one we just analyzed pop up and people read them, thinking that the data must be accurate. It’s so disappointing seeing something like this happen over and over again.