Hello. I decided to give it another go at the traffic-corrected plots with the predicted tire degradation. The race in Saudi Arabia had quite a few quirks though but I’ll explain those in the next sections. As usual, If you enjoy the content please help me with supporting the site with a donation, a comment, a share, or in any way that you can. Your support is what keeps me going so I really appreciate it.
Explanation
I created a model to generate a regression from the last GP long runs to see if I could determine which drivers were able to keep the tires alive for longer. This model is fairly flexible so unlike many other models out there that just draw a line, my model will actually create wiggly lines if the data requires it.
One of the main additions to my newest model is a fairly simple but important way of correcting for laps in which drivers were in traffic. We know that when drivers are in the dirty air they get slower and struggle to keep the lap times up, which skews the data that we’re trying to discover. With my model, I created a regression for the original data and a regression with the traffic-corrected predictions. You can see how the traffic-corrected regression only affects the laps in which the drivers were in traffic.
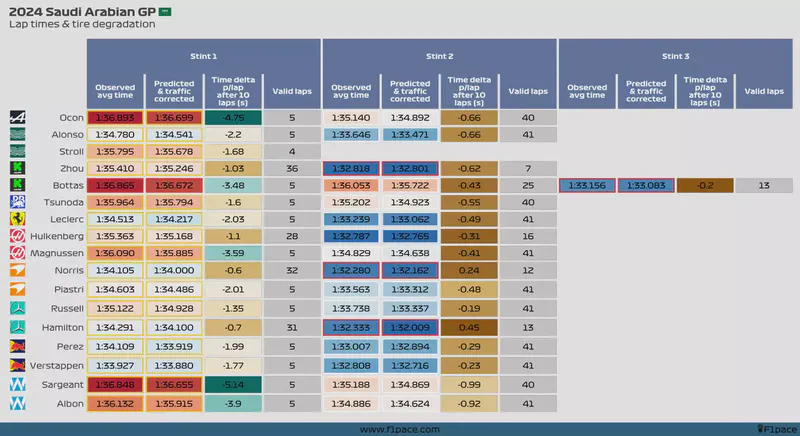
From this model I then calculated the average slope for each driver and each stint, obtaining an average measurement of how lap times increased every 10 laps. I decided to go with 10 laps because otherwise, the numbers would be quite small and hard to interpret. A negative or small delta per 10 laps means that the driver was getting faster or had a consistent run with times staying stable, while positive, higher delta numbers mean that the driver had more degradation and the lap times increased more as the tires got older.
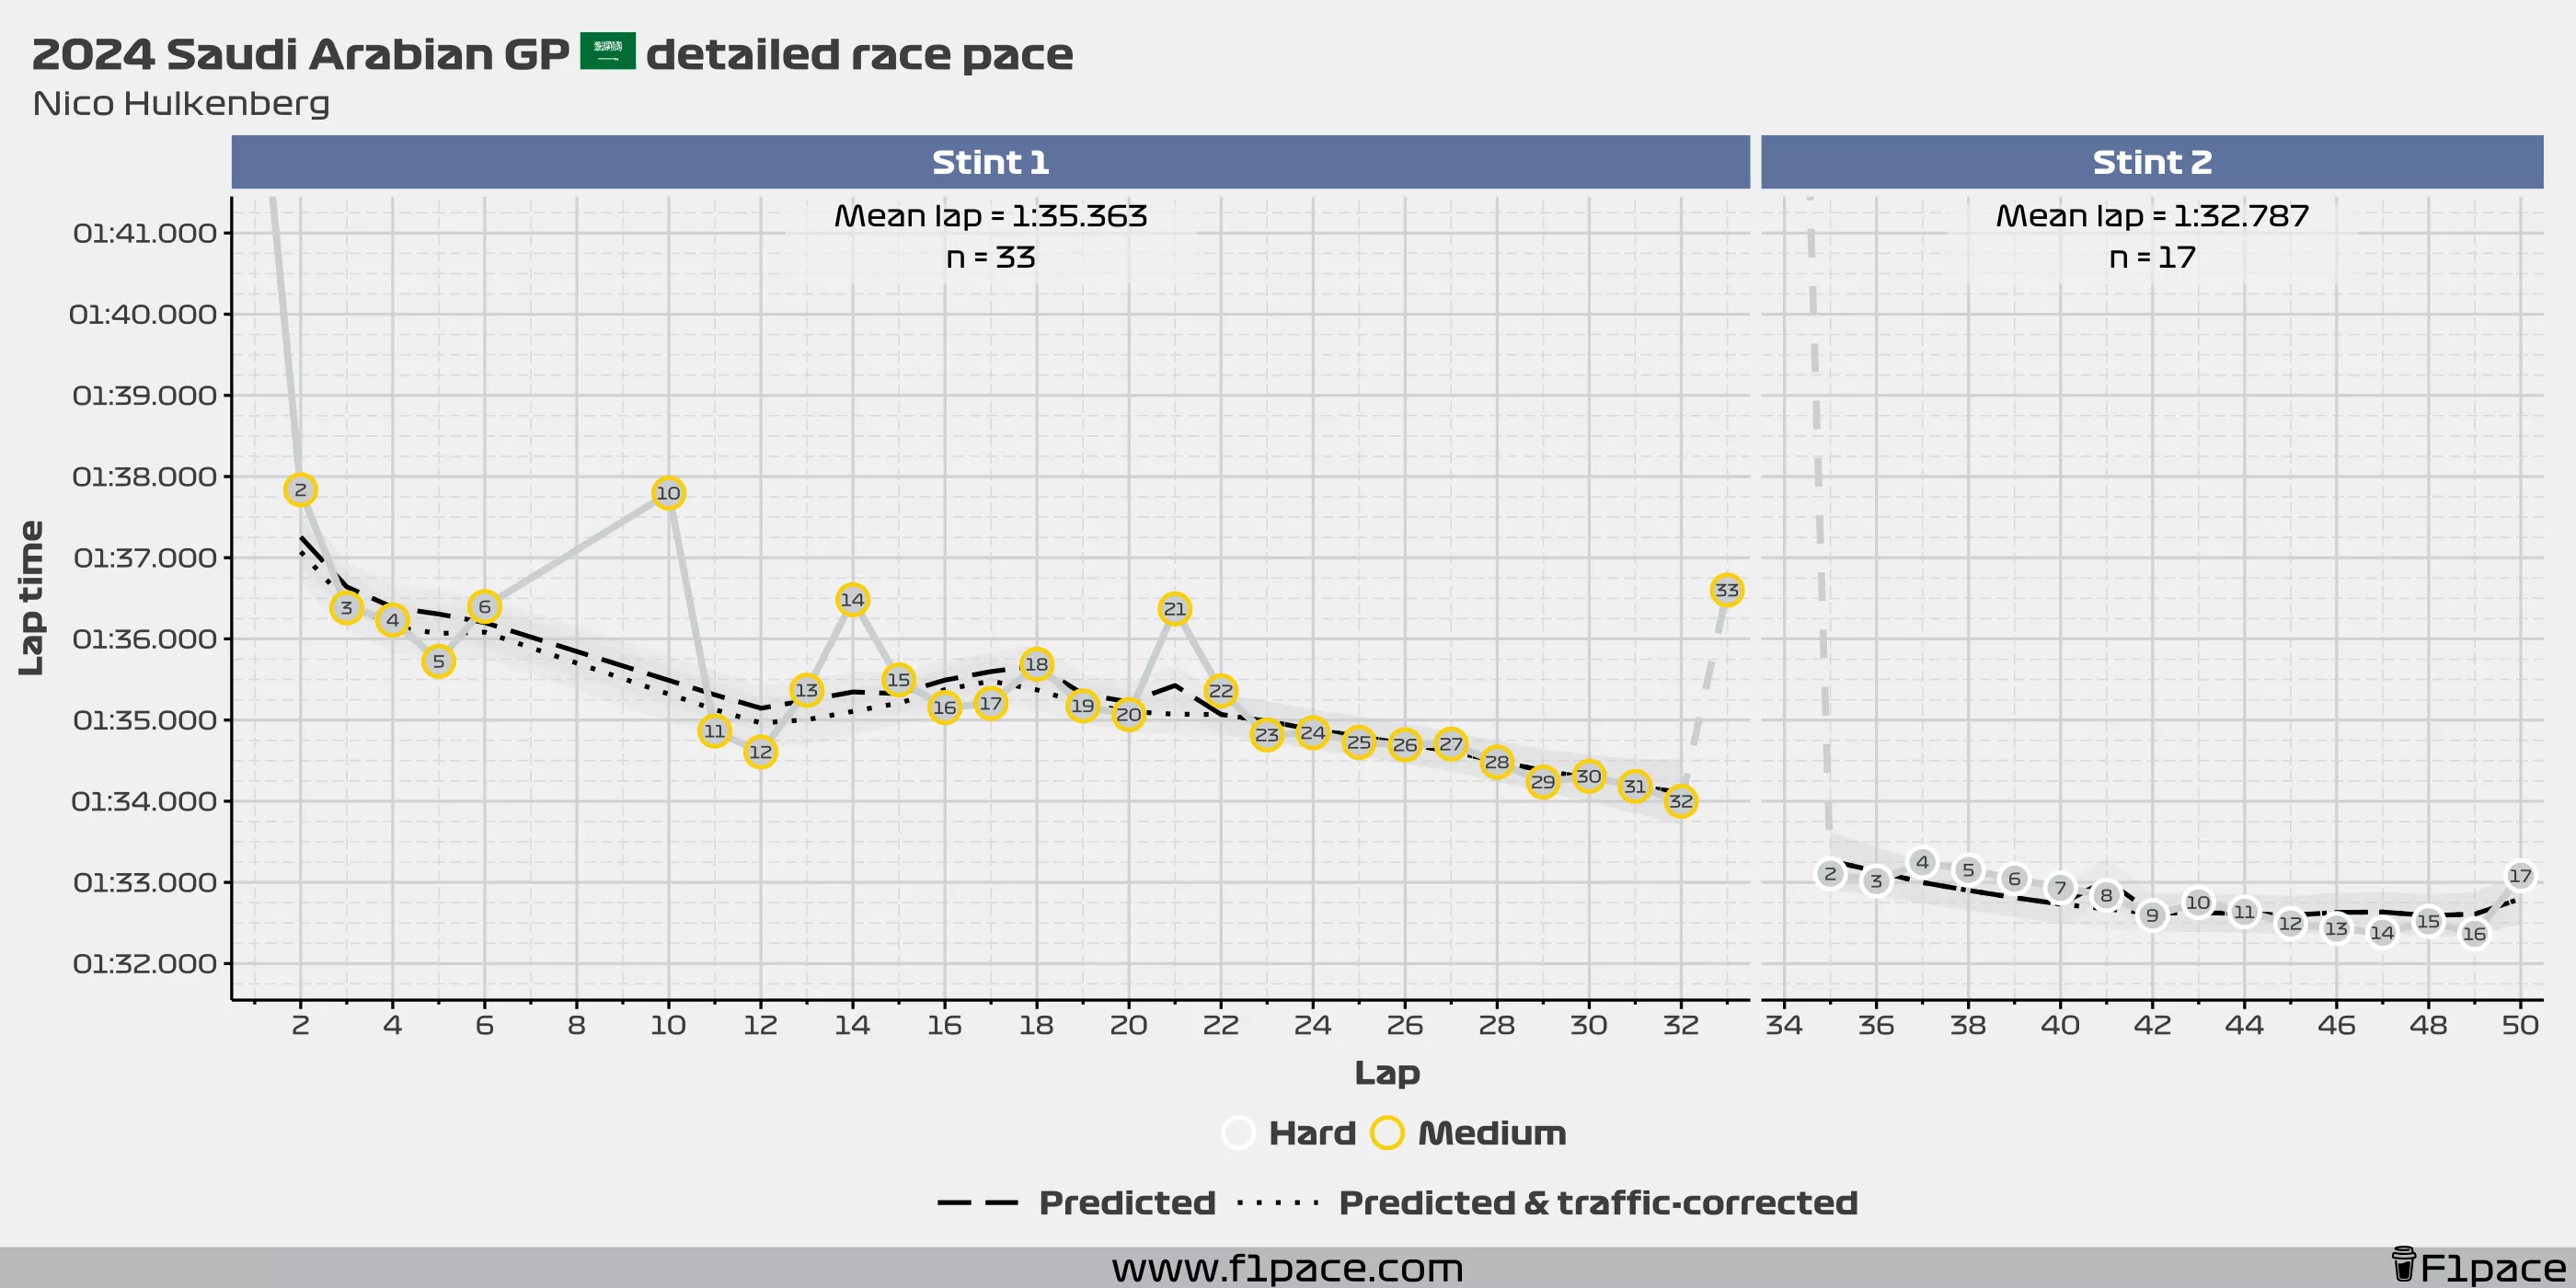
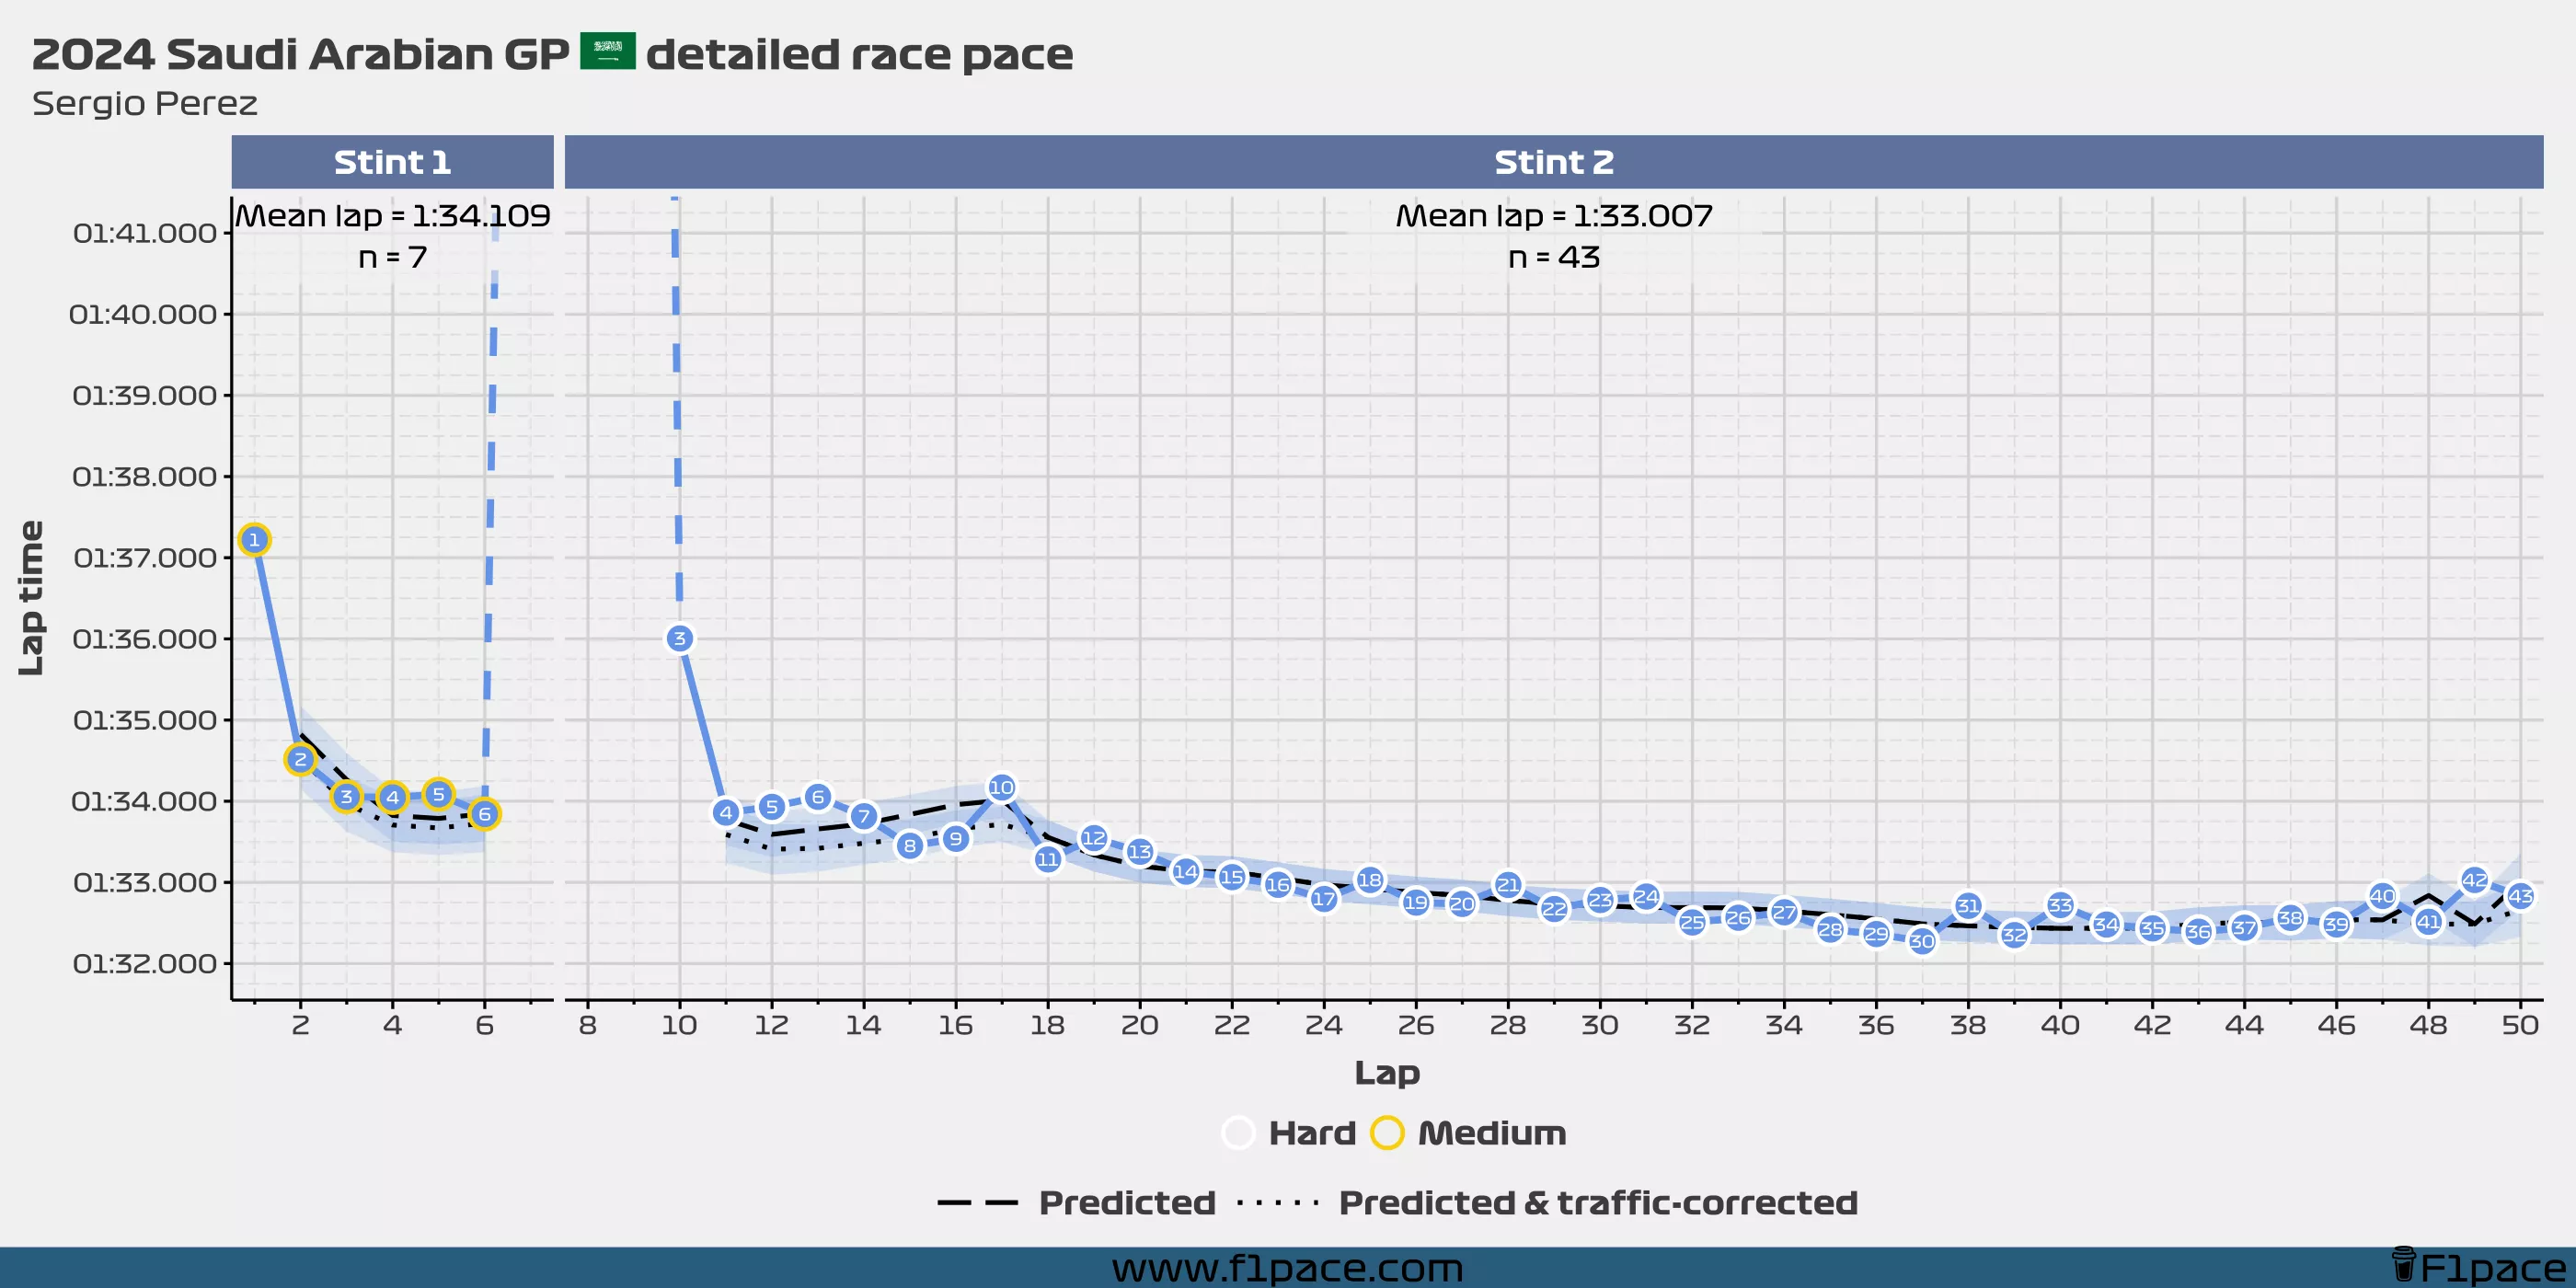
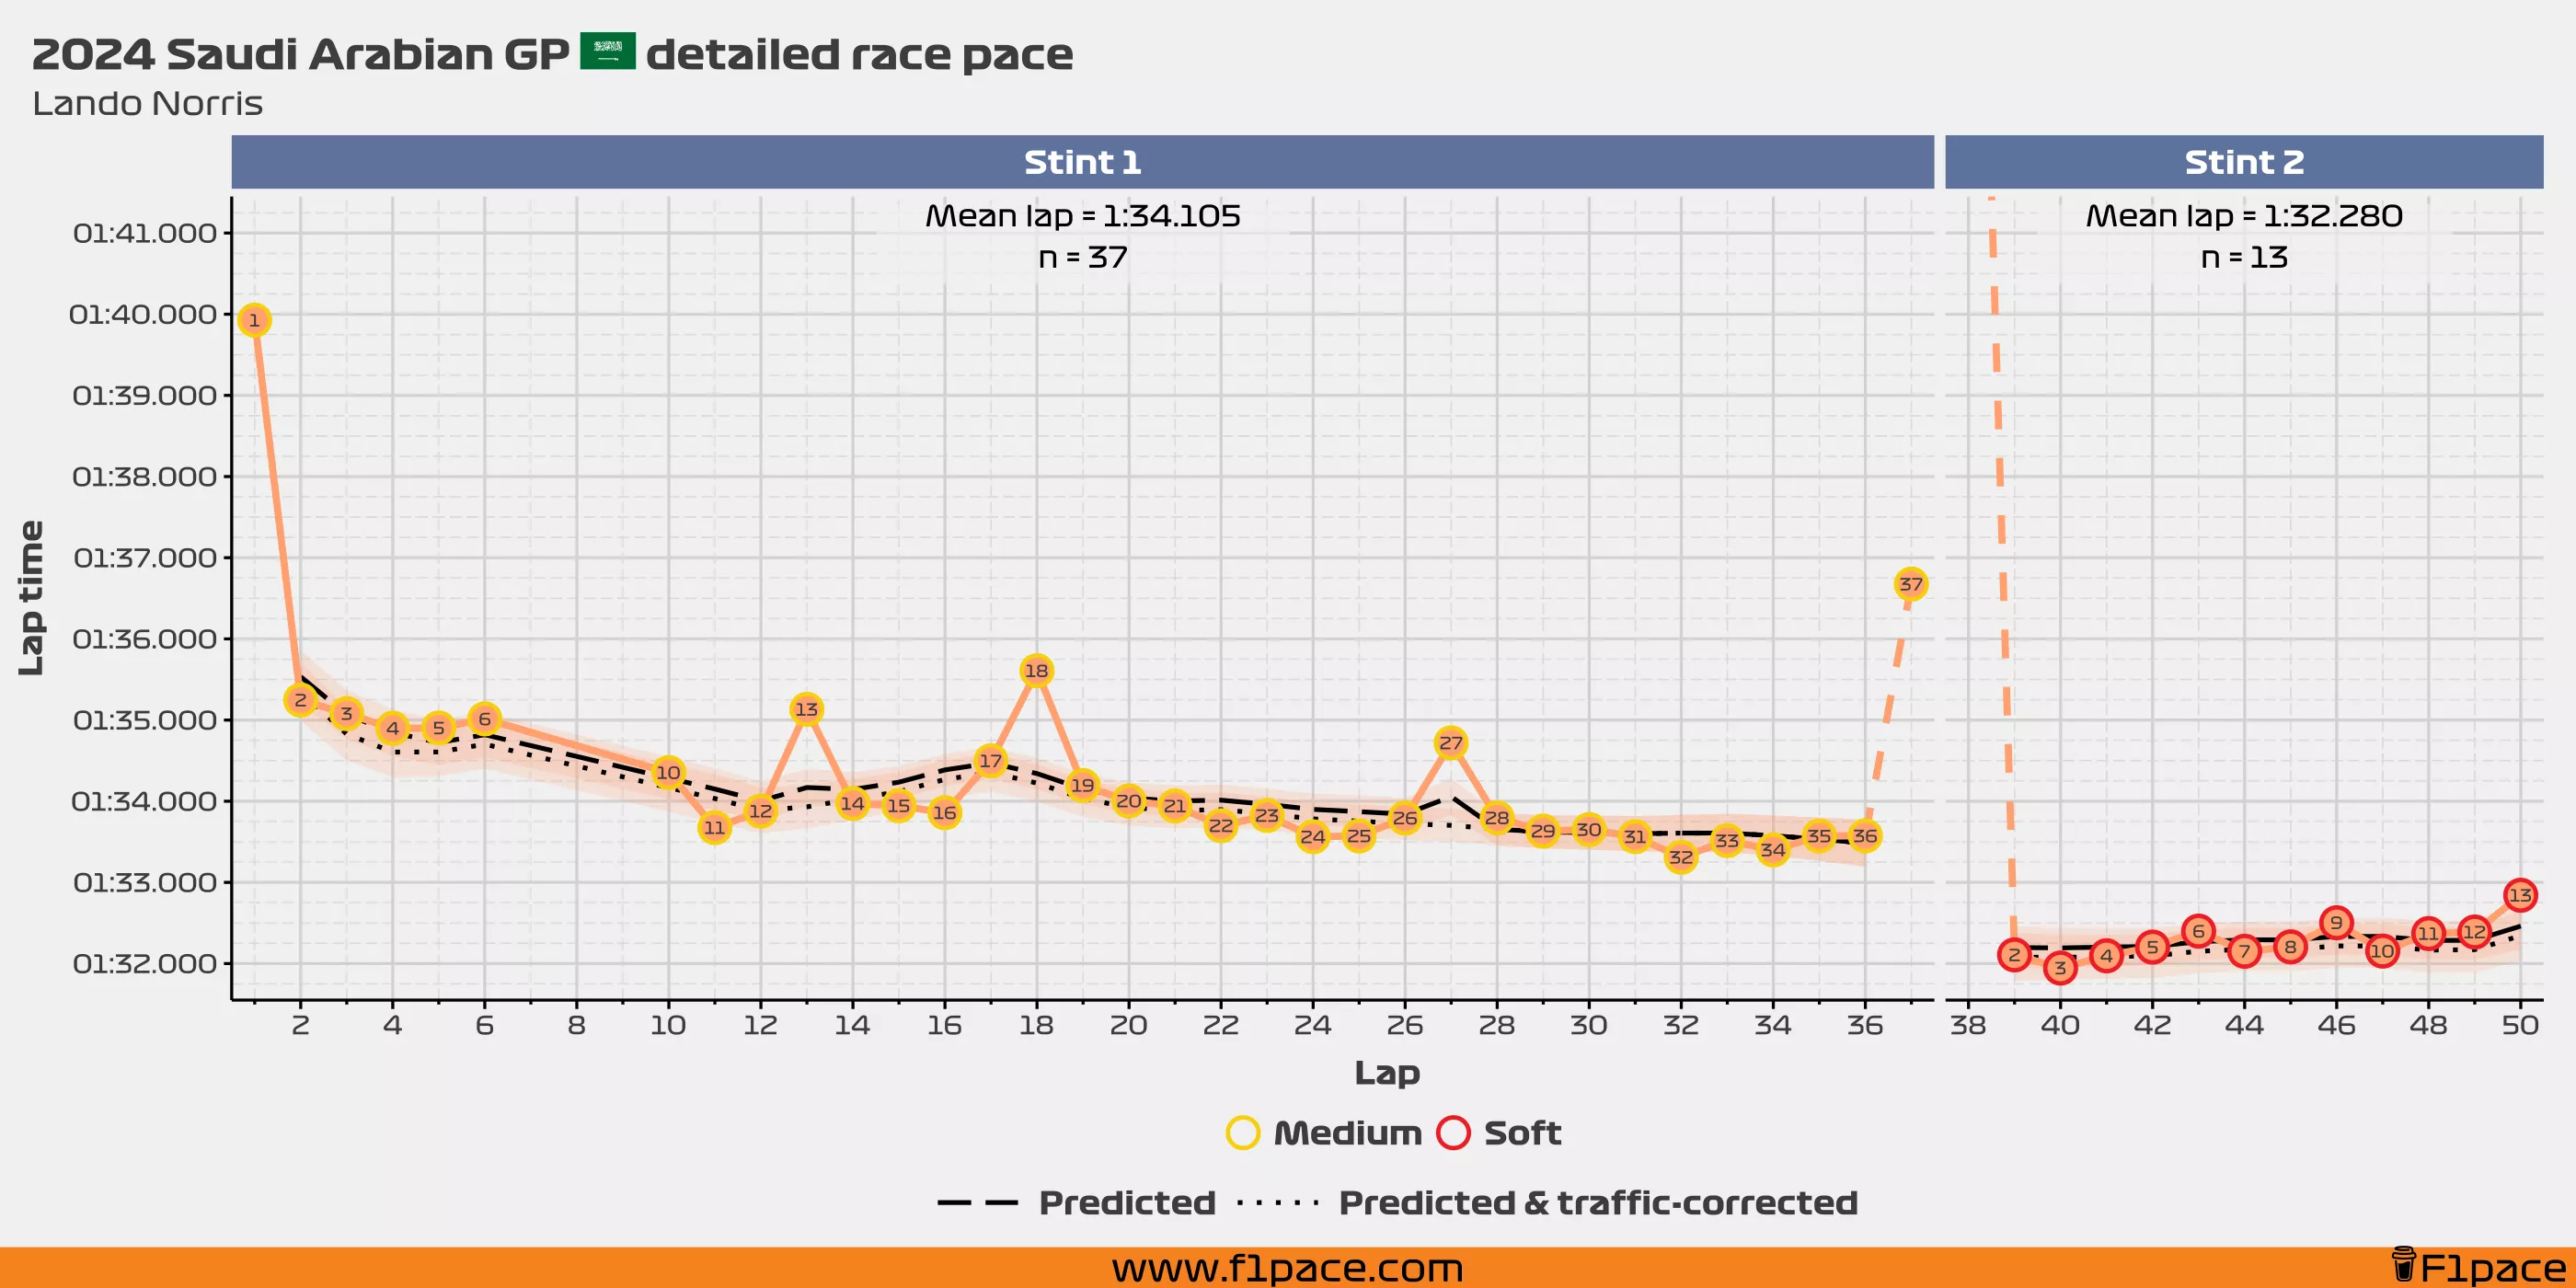
Regarding the traffic correction, the model made an average correction based on the data from all of the drivers. For this race, the model estimated that having traffic in front had a cost of around 3 tenths. However, having traffic in front and traffic behind had a penalty of only around 1 tenth. This makes sense when you think about it. If a particular driver had traffic in front and behind, most likely he was in a DRS train, meaning that he wasn’t losing that much time per lap. If, however, a driver had traffic in front but not behind, most likely he was chasing a driver for position, but couldn’t overtake due to additional factors such as top speed. Take for example Lewis Hamilton chasing Lando Norris. He most likely had a stronger race pace but didn’t have the speed to overtake Lando, meaning that he was losing time on every lap in which he was stuck behind the McLaren.
Example
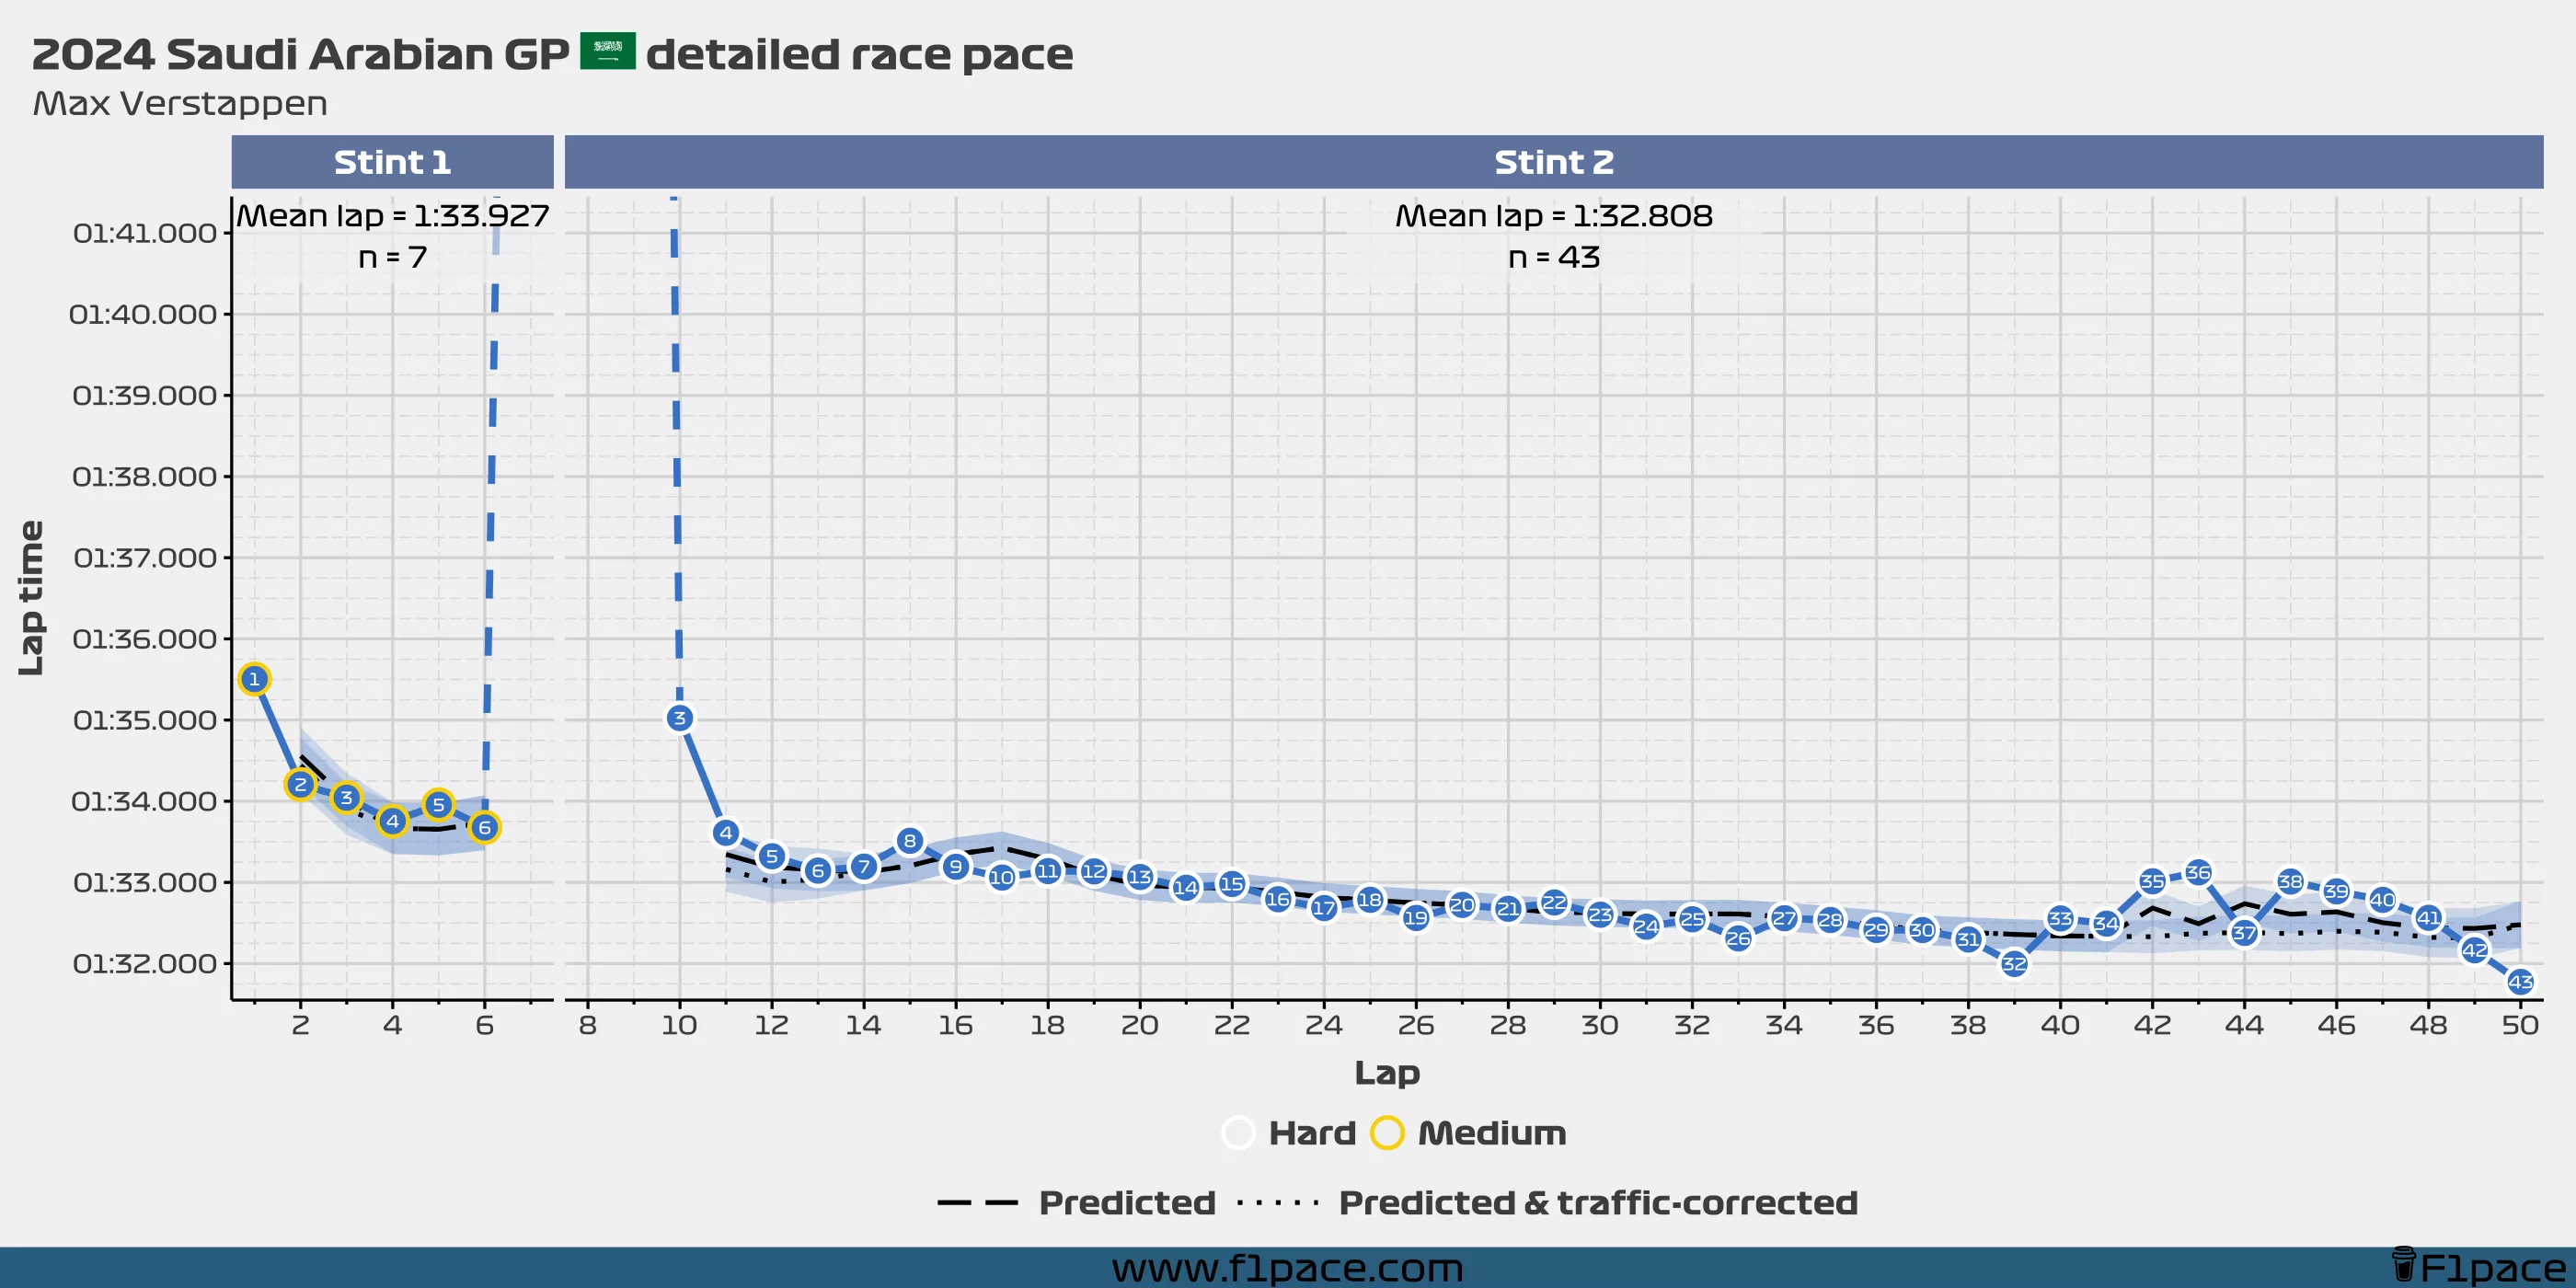
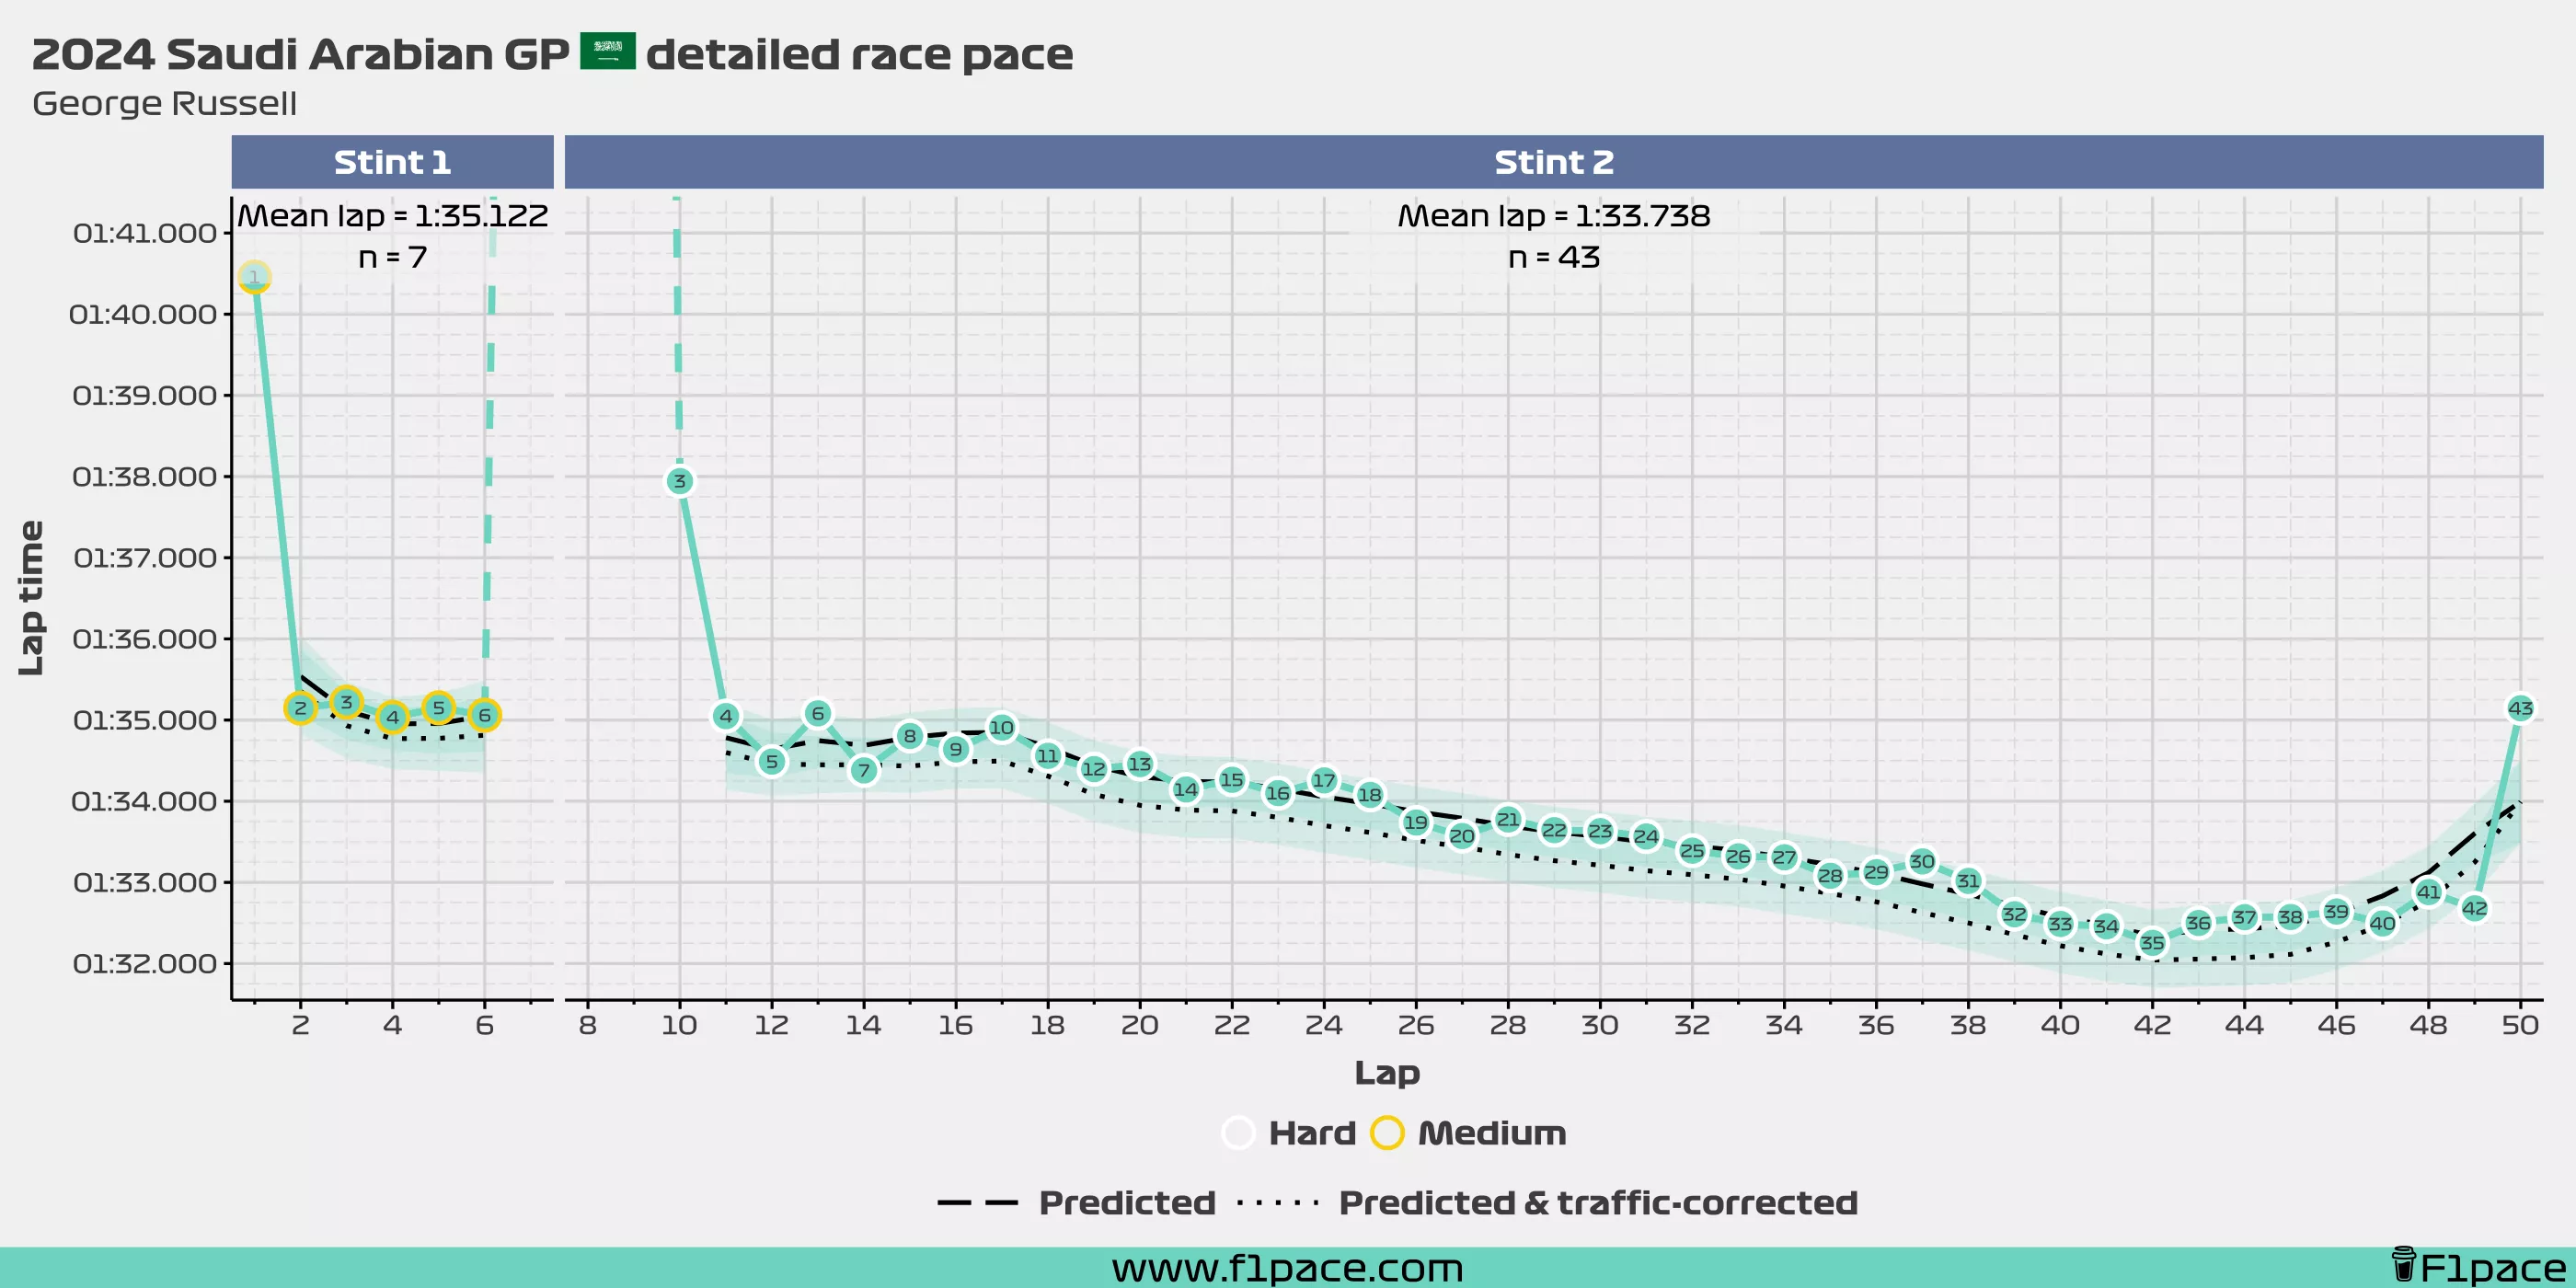
This is the data collected for Max Verstappen from the latest Grand Prix. The solid line and the points show the observed (real) data, while the dashed line shows the model predictions and the dotted line shows the prediction after correcting for traffic. It’s important to note that the predicted lines show the overall trend of the data and are not meant to be an exact prediction of each individual data point.
If you want to take a look at the rest of the runs with their corresponding predictions go to the “Long runs with predictions” section further down below.
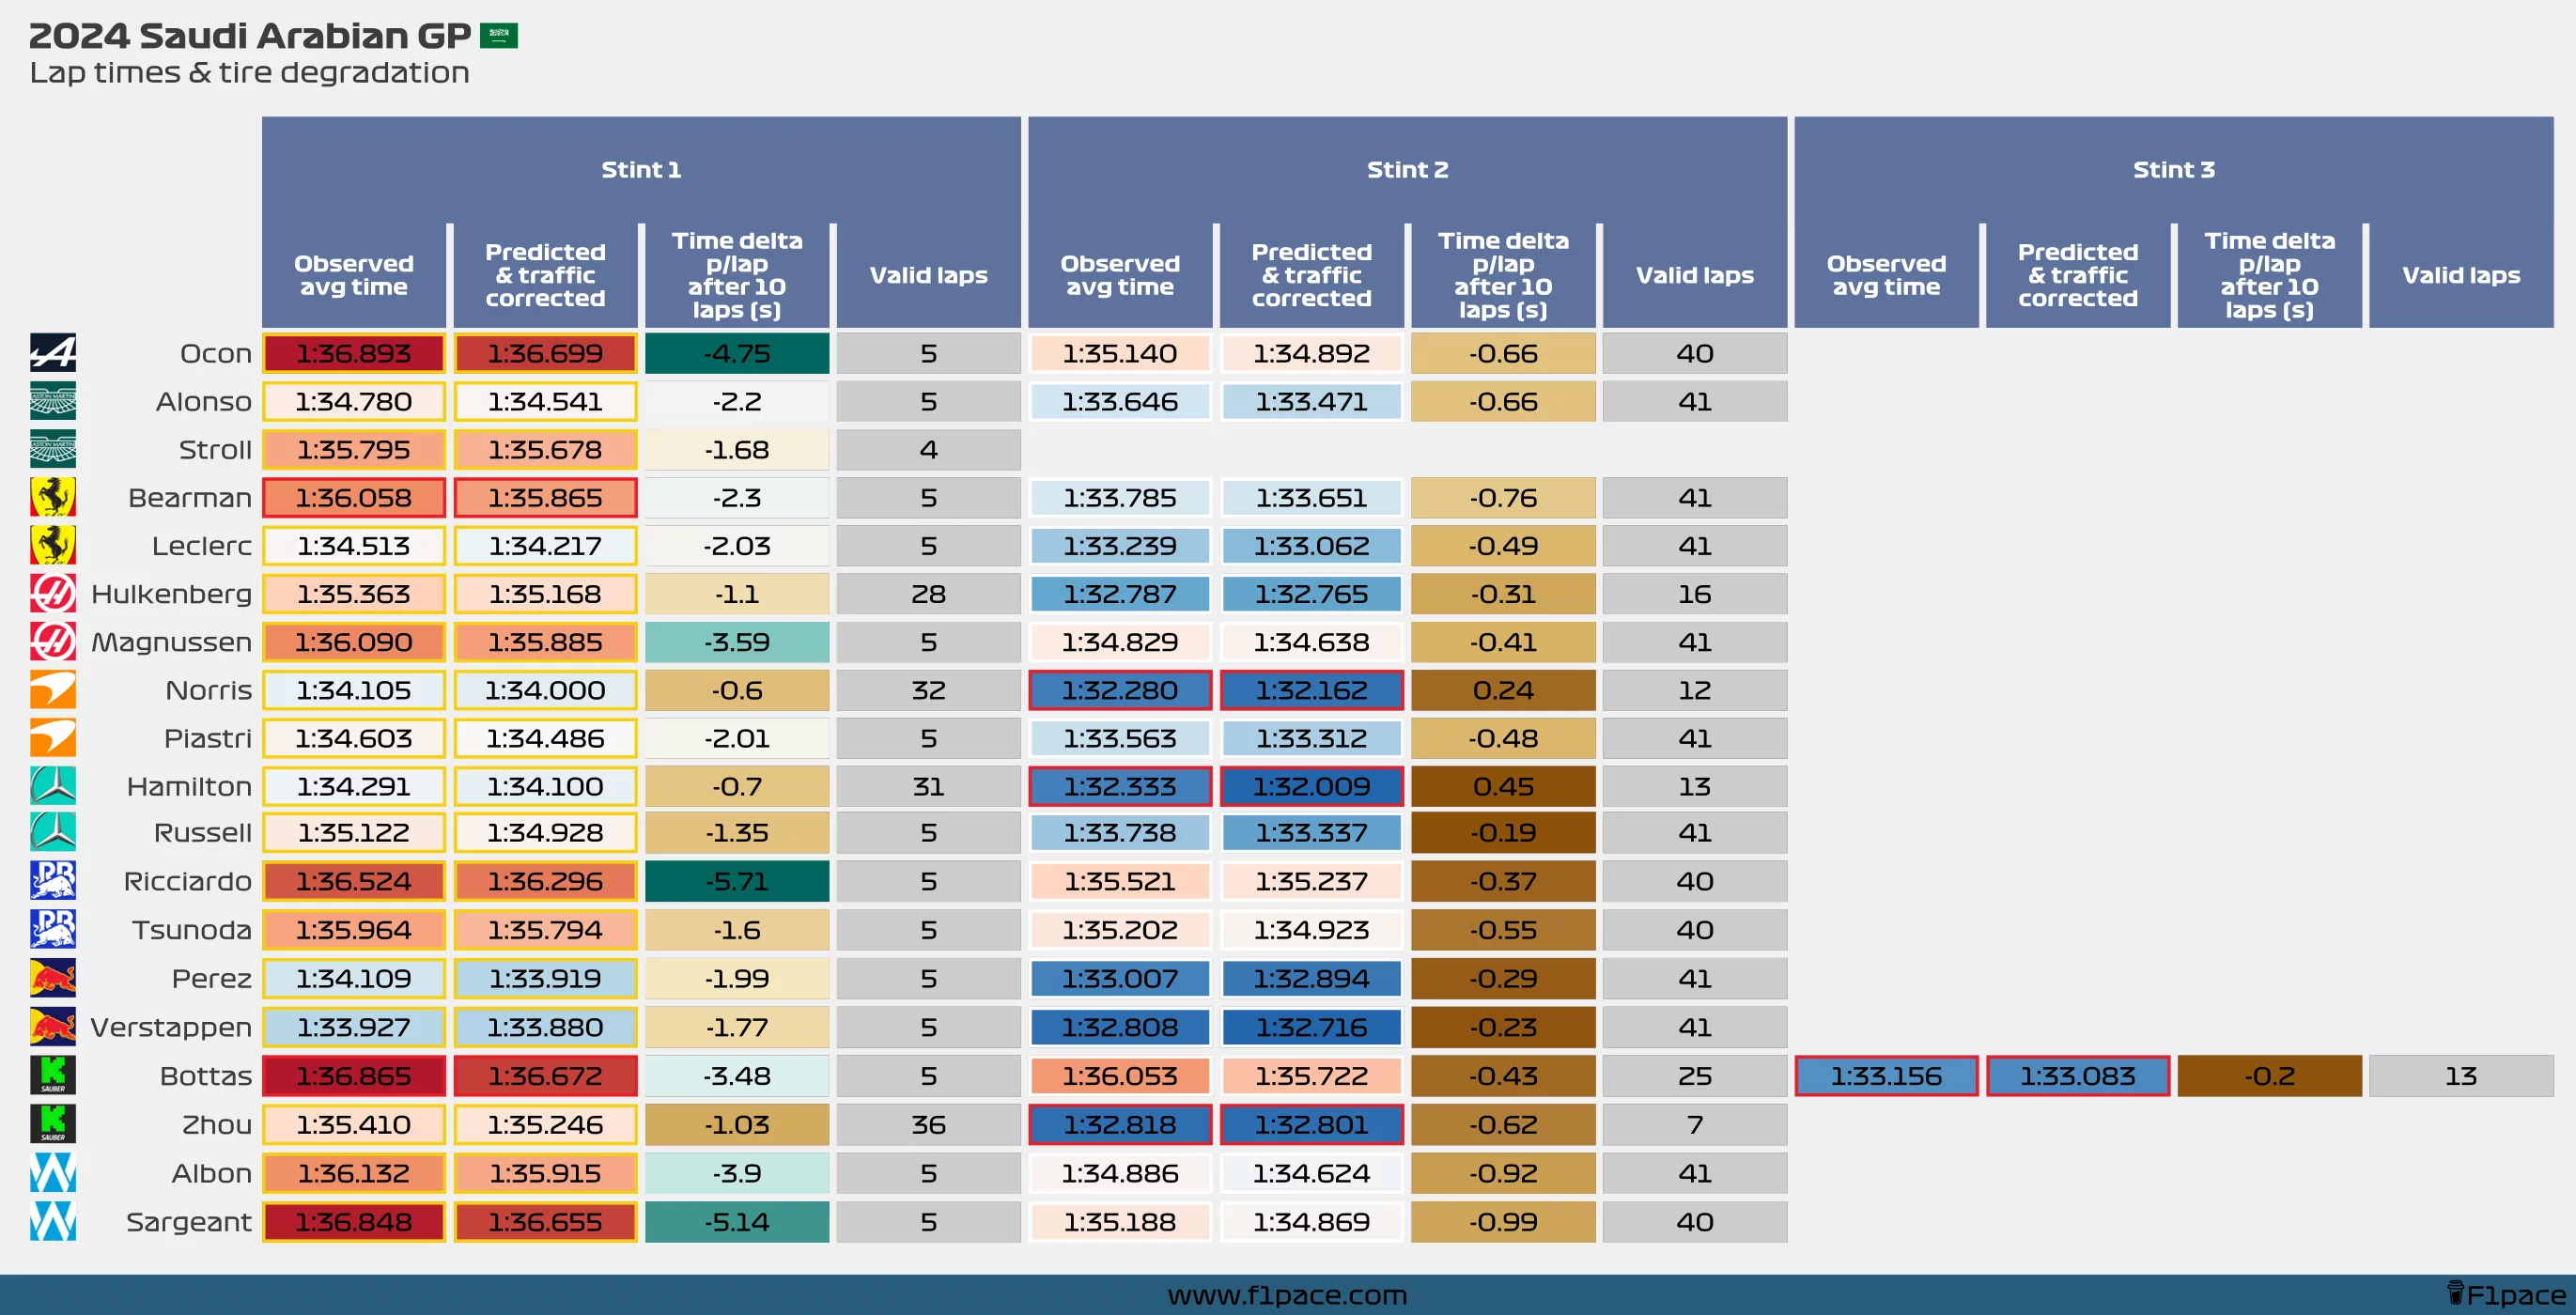
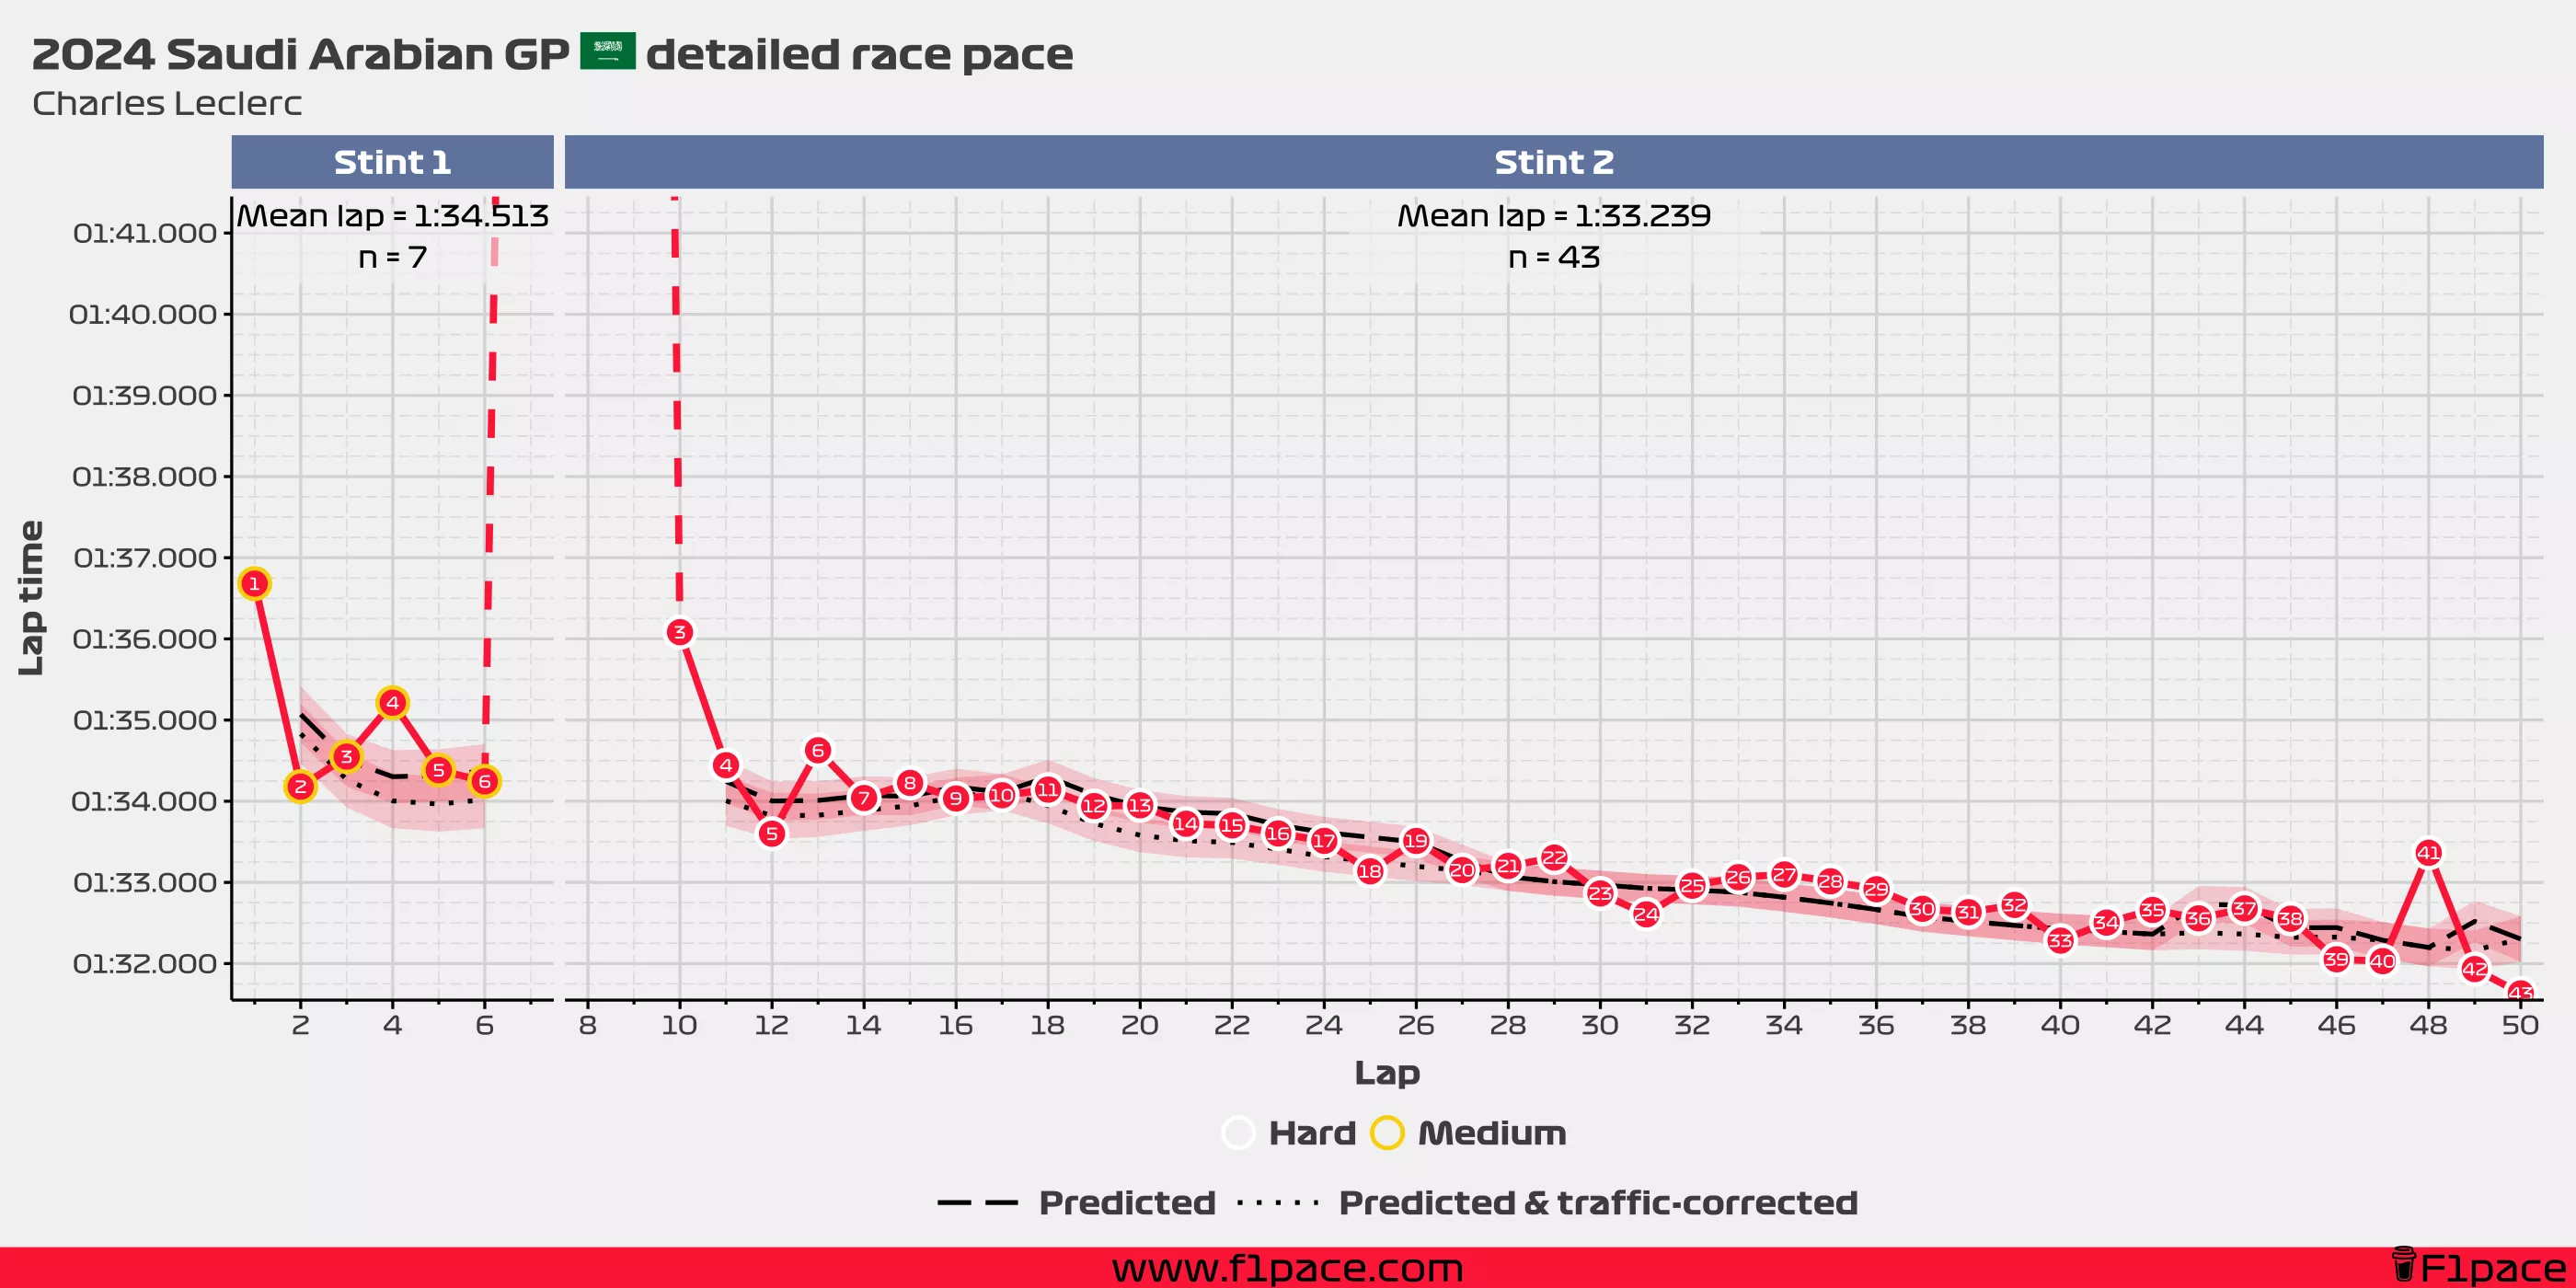
Lap times & degradation
I can’t estimate the actual tire degradation since I don’t have all of the data that the teams have, but I can estimate how much lap times were increasing as the tires were used. This is not a perfect measure but it’s as good as I was able to do for the moment.
As I mentioned before, smaller numbers mean that the lap times didn’t increase much over the course of a stint, perhaps even decreasing if tire degradation was very small, while big numbers mean that the lap times got much slower as the tires kept degrading. The valid laps in this case are only laps considered as complete, meaning full racing laps without going into the pits. In this case, I also removed the first lap since it was slower due to the standing start.
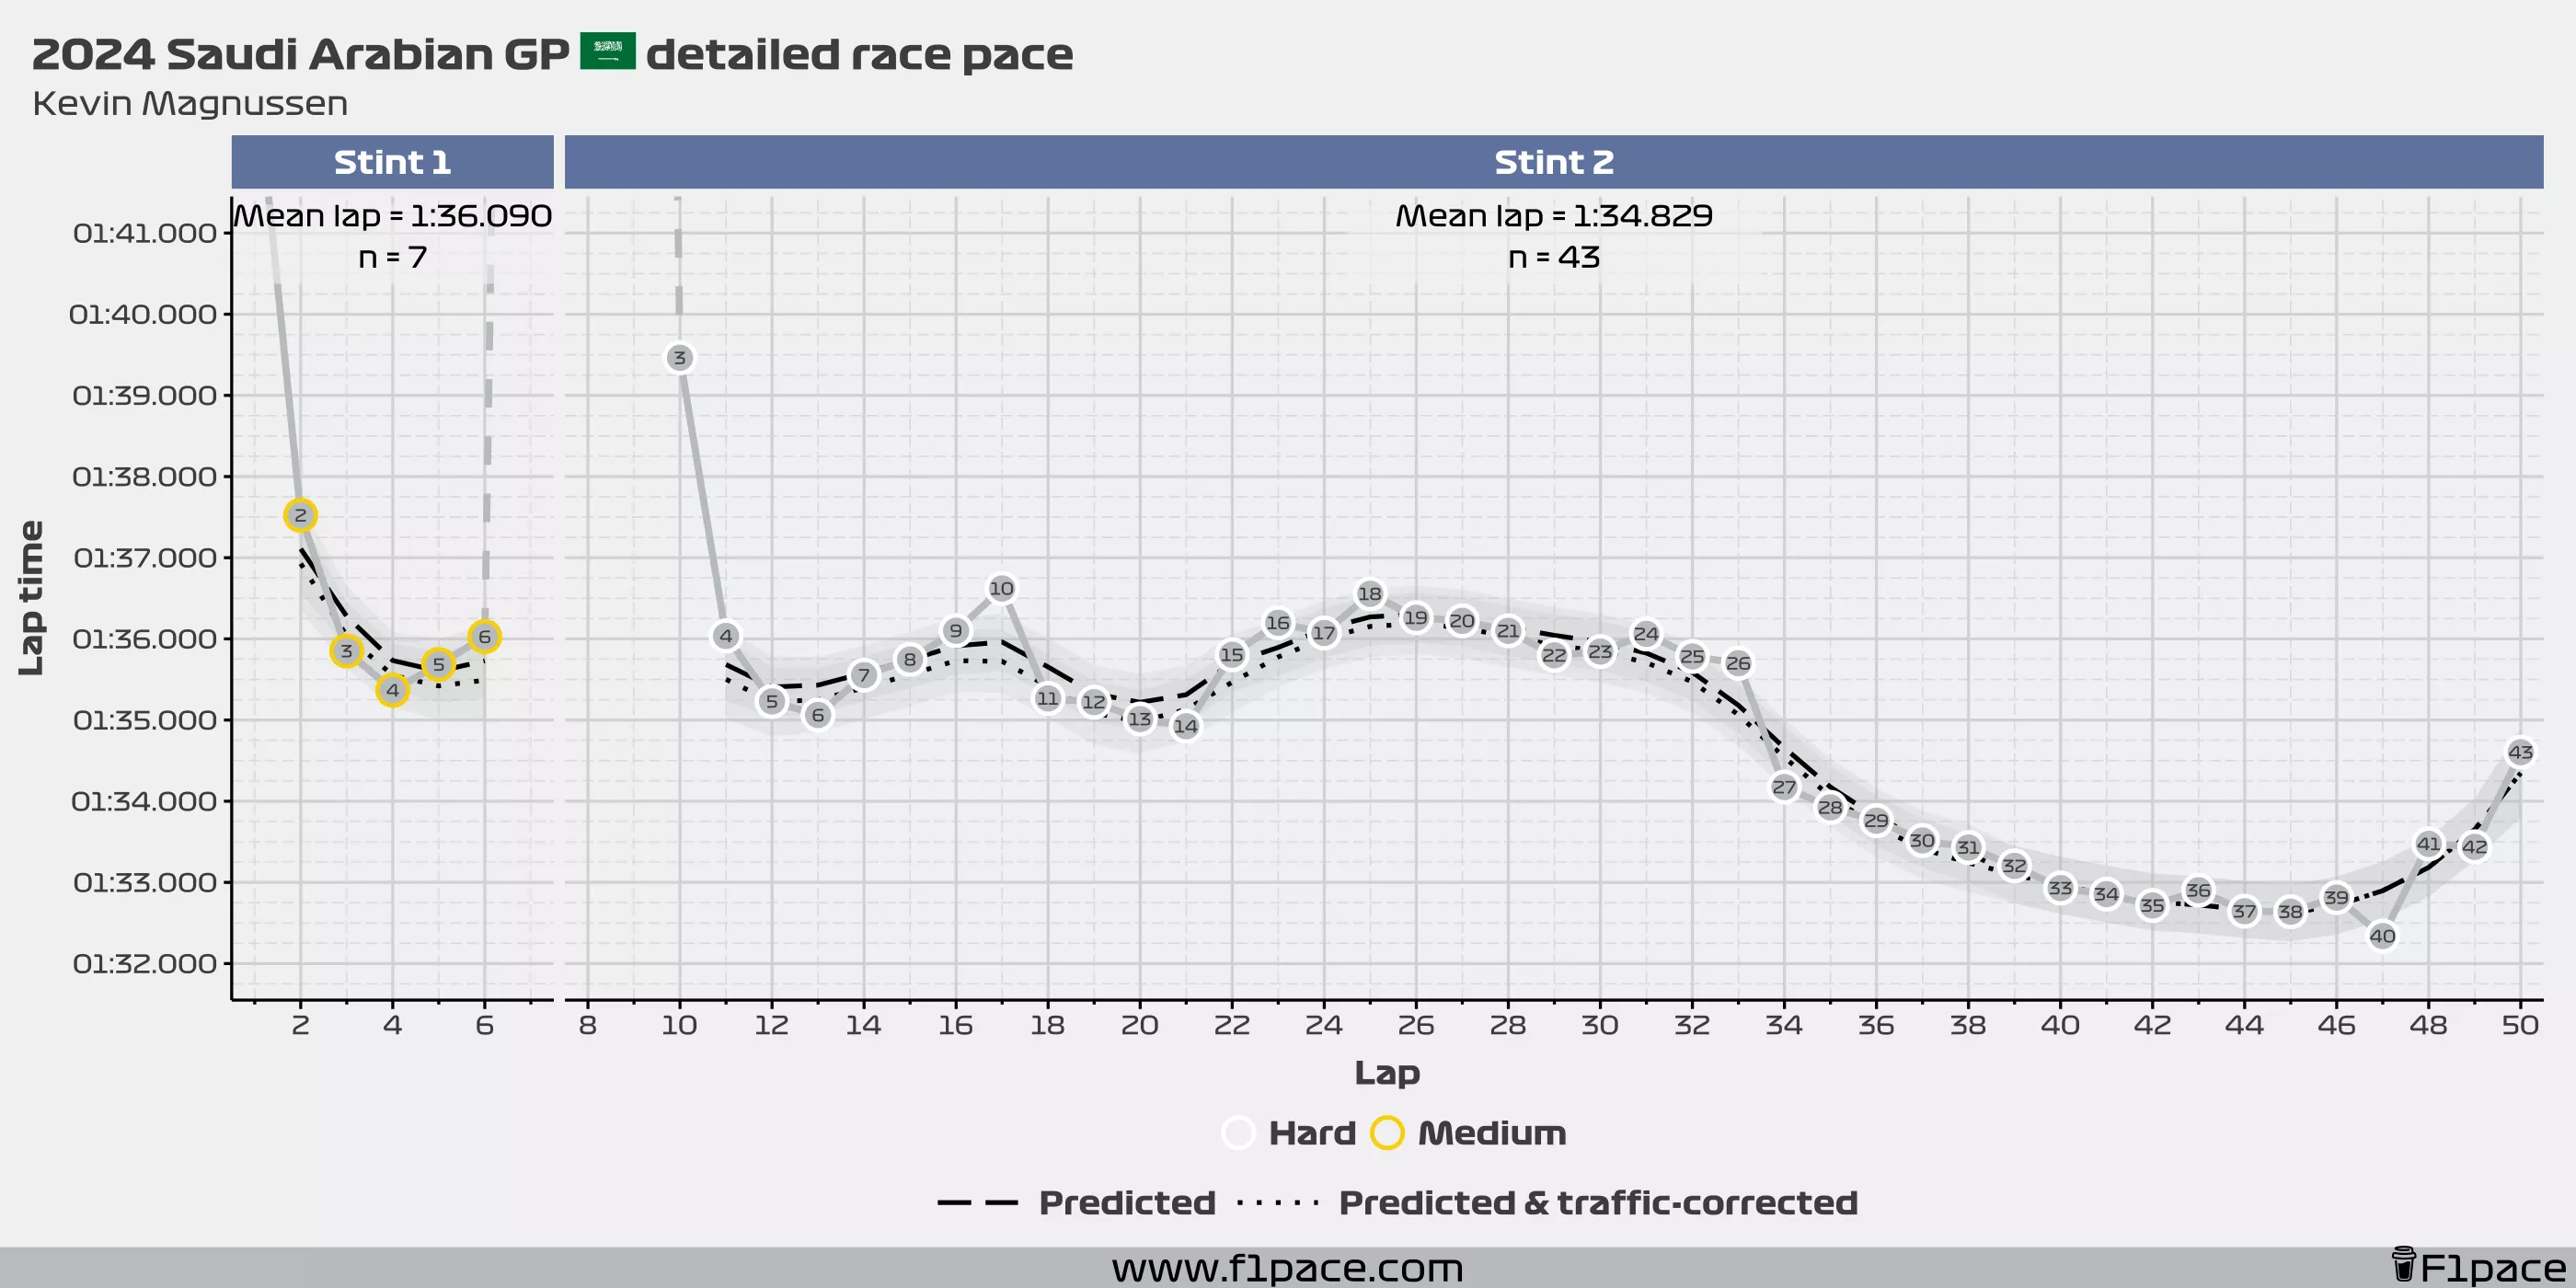
Note that for this particular race, many drivers were stuck behind Kevin Magnussen, which artificially lowered their race pace. In this case, I would take the calculated time delta per lap with a grain of salt.
Long runs with predictions
Red Bull
Mercedes
Ferrari
McLaren
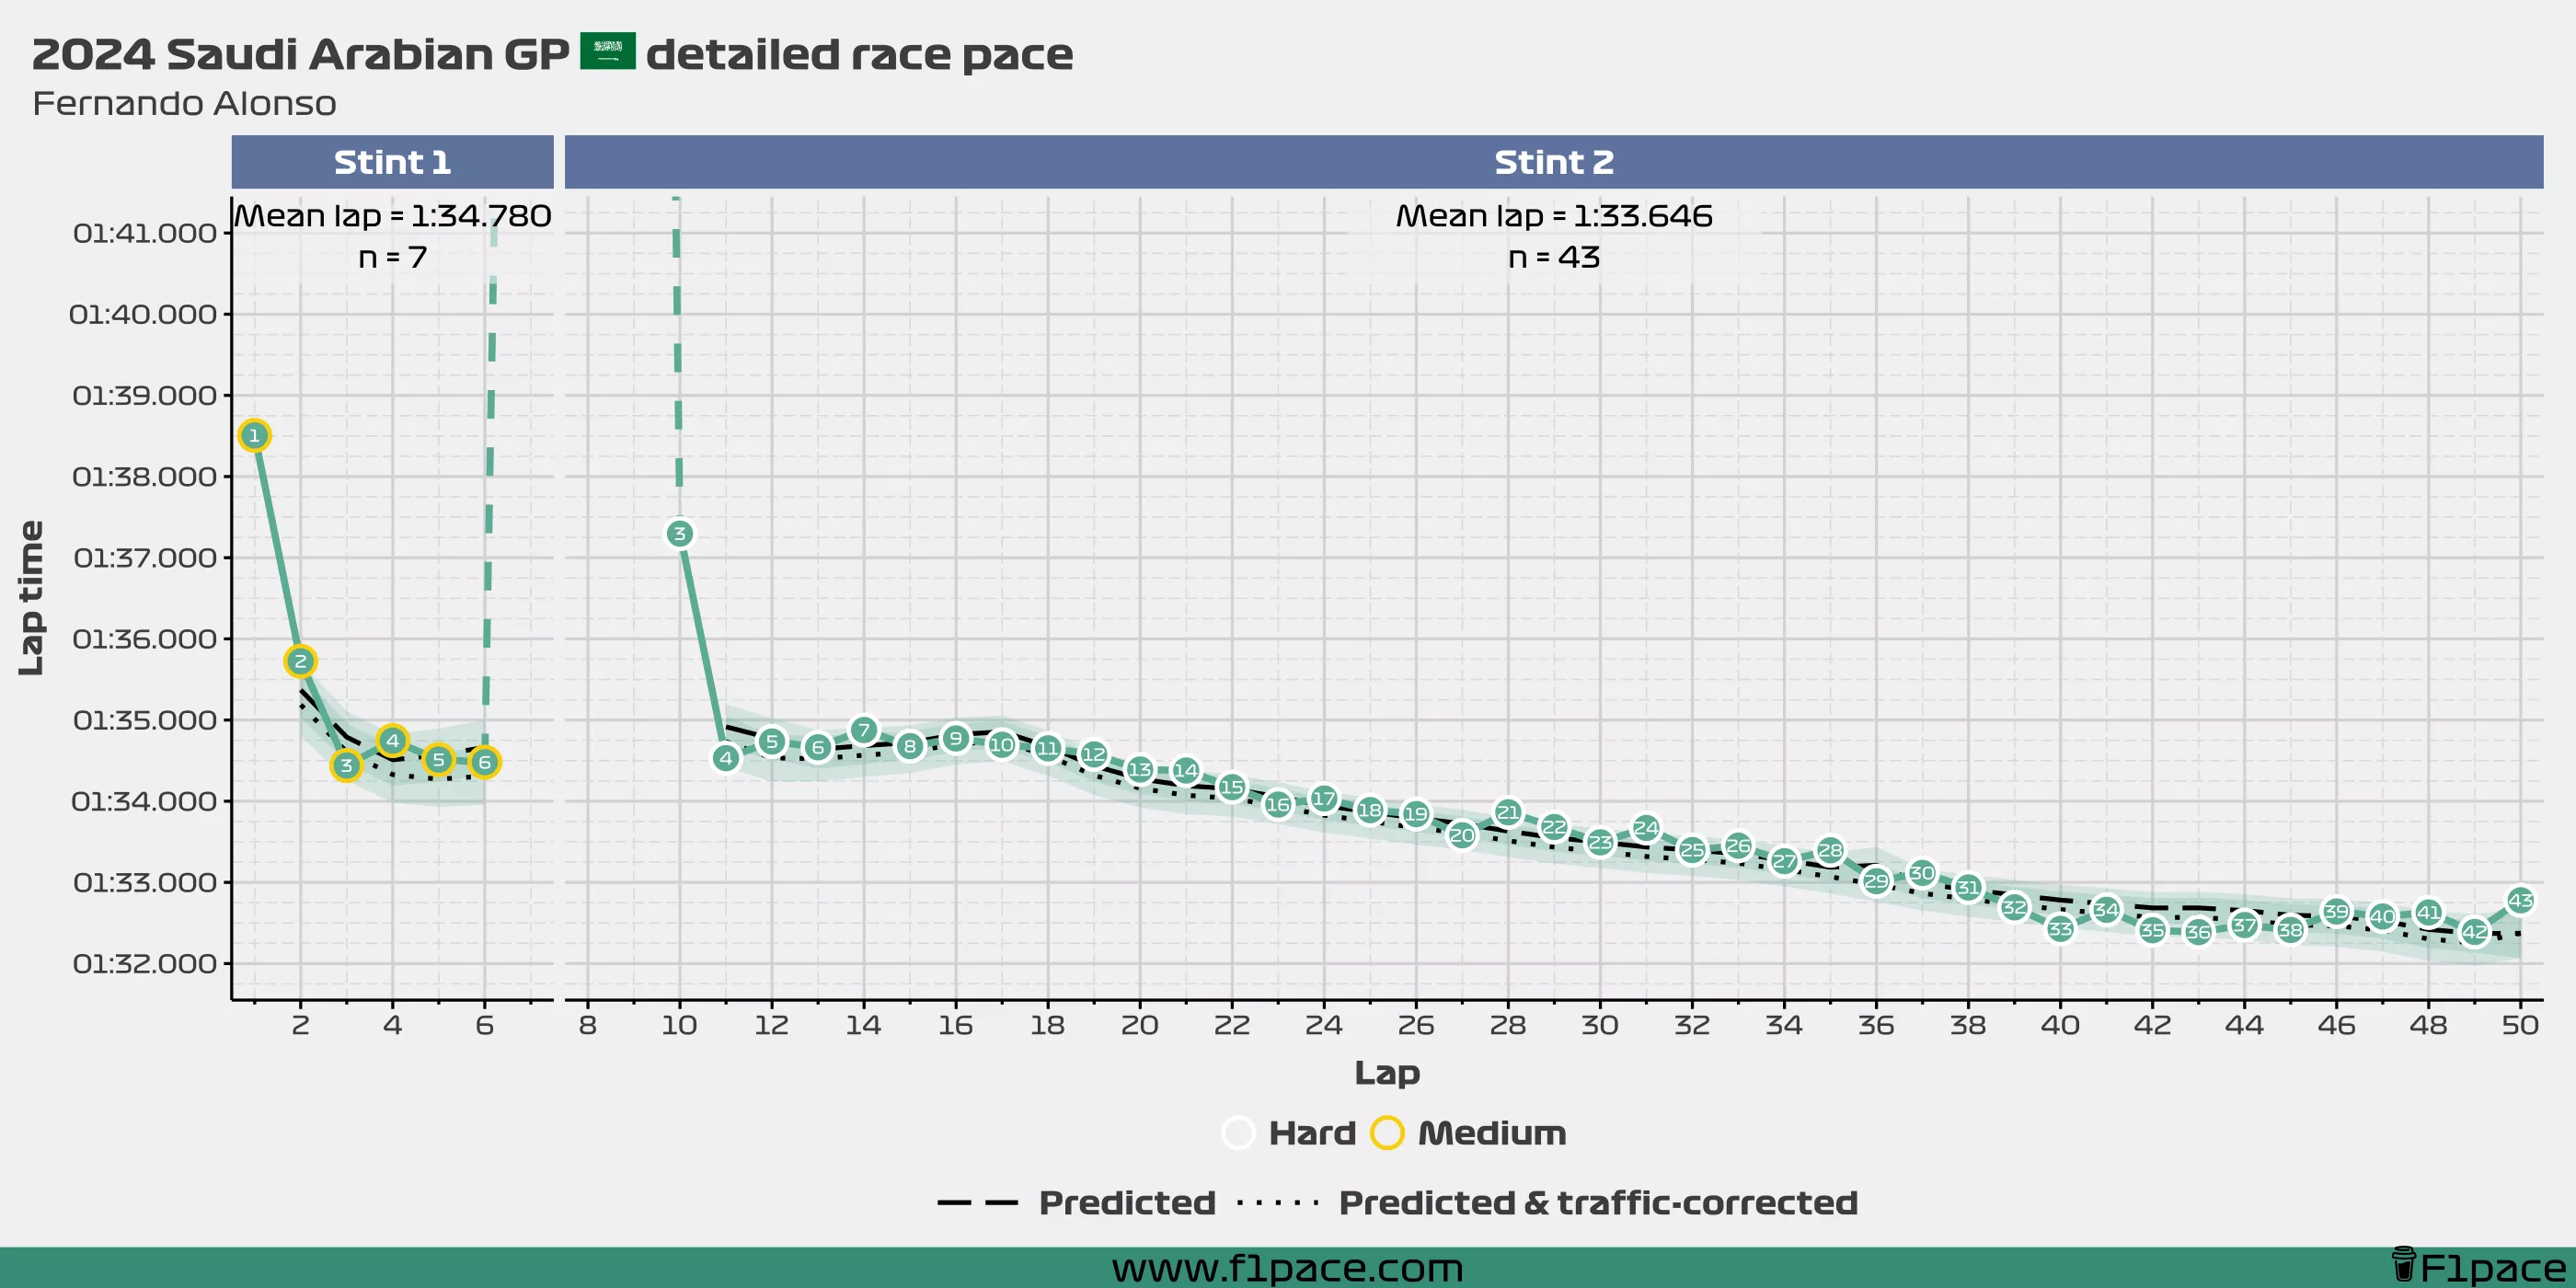
Aston Martin
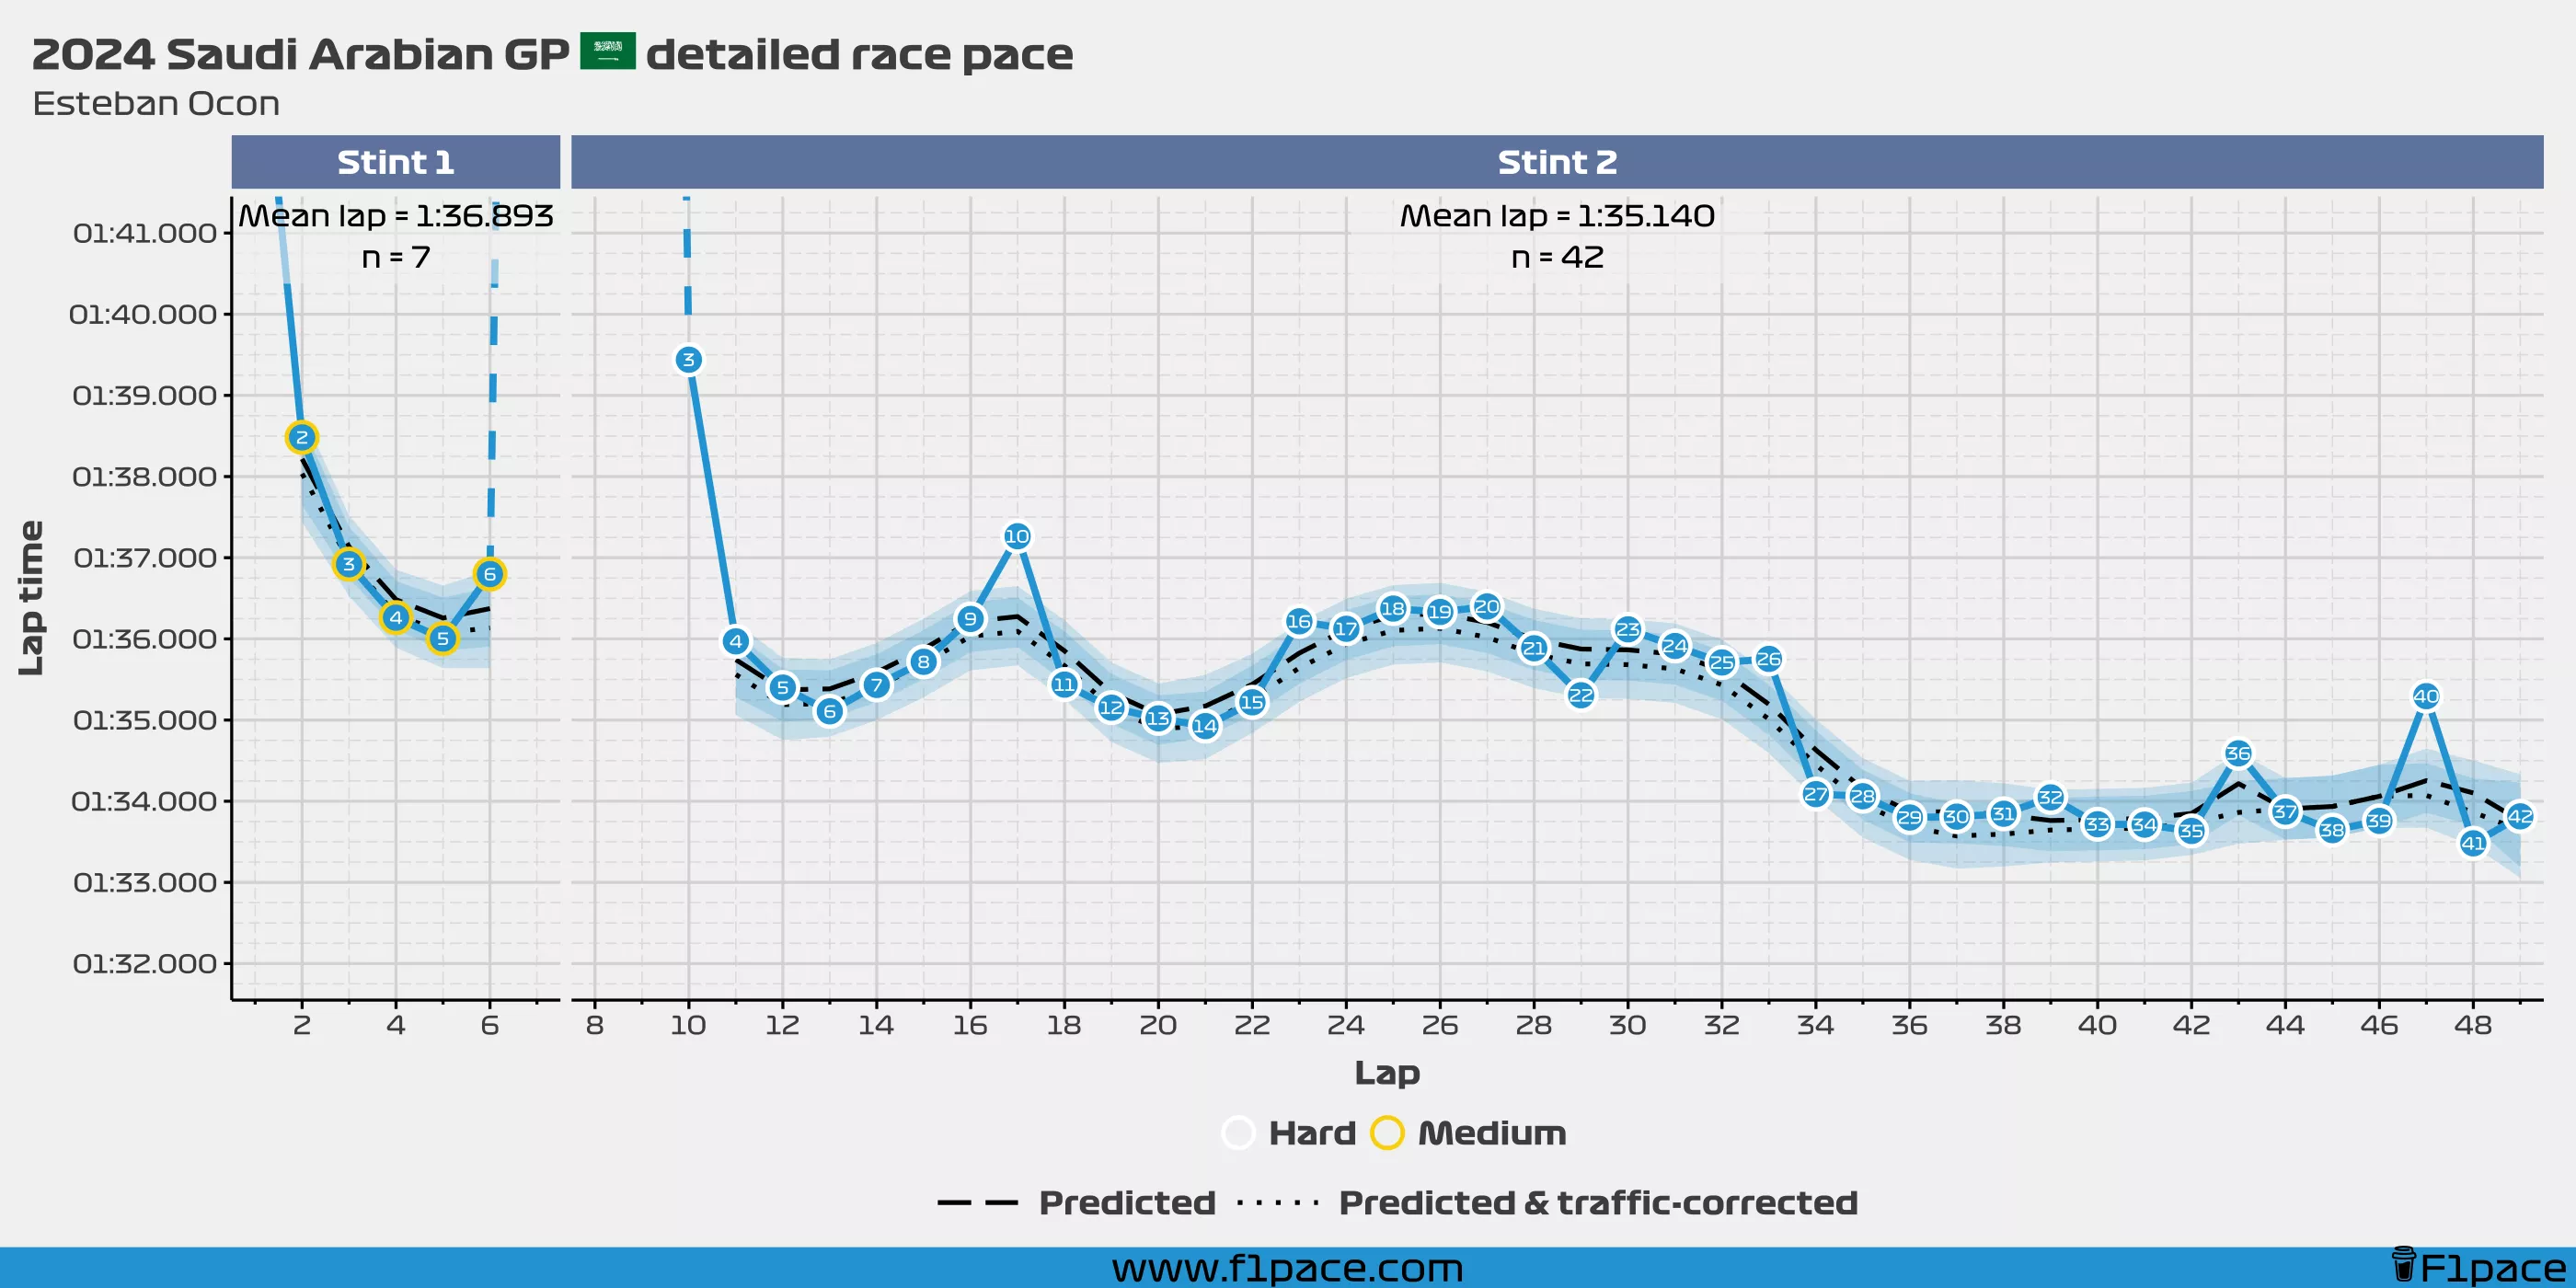
Alpine
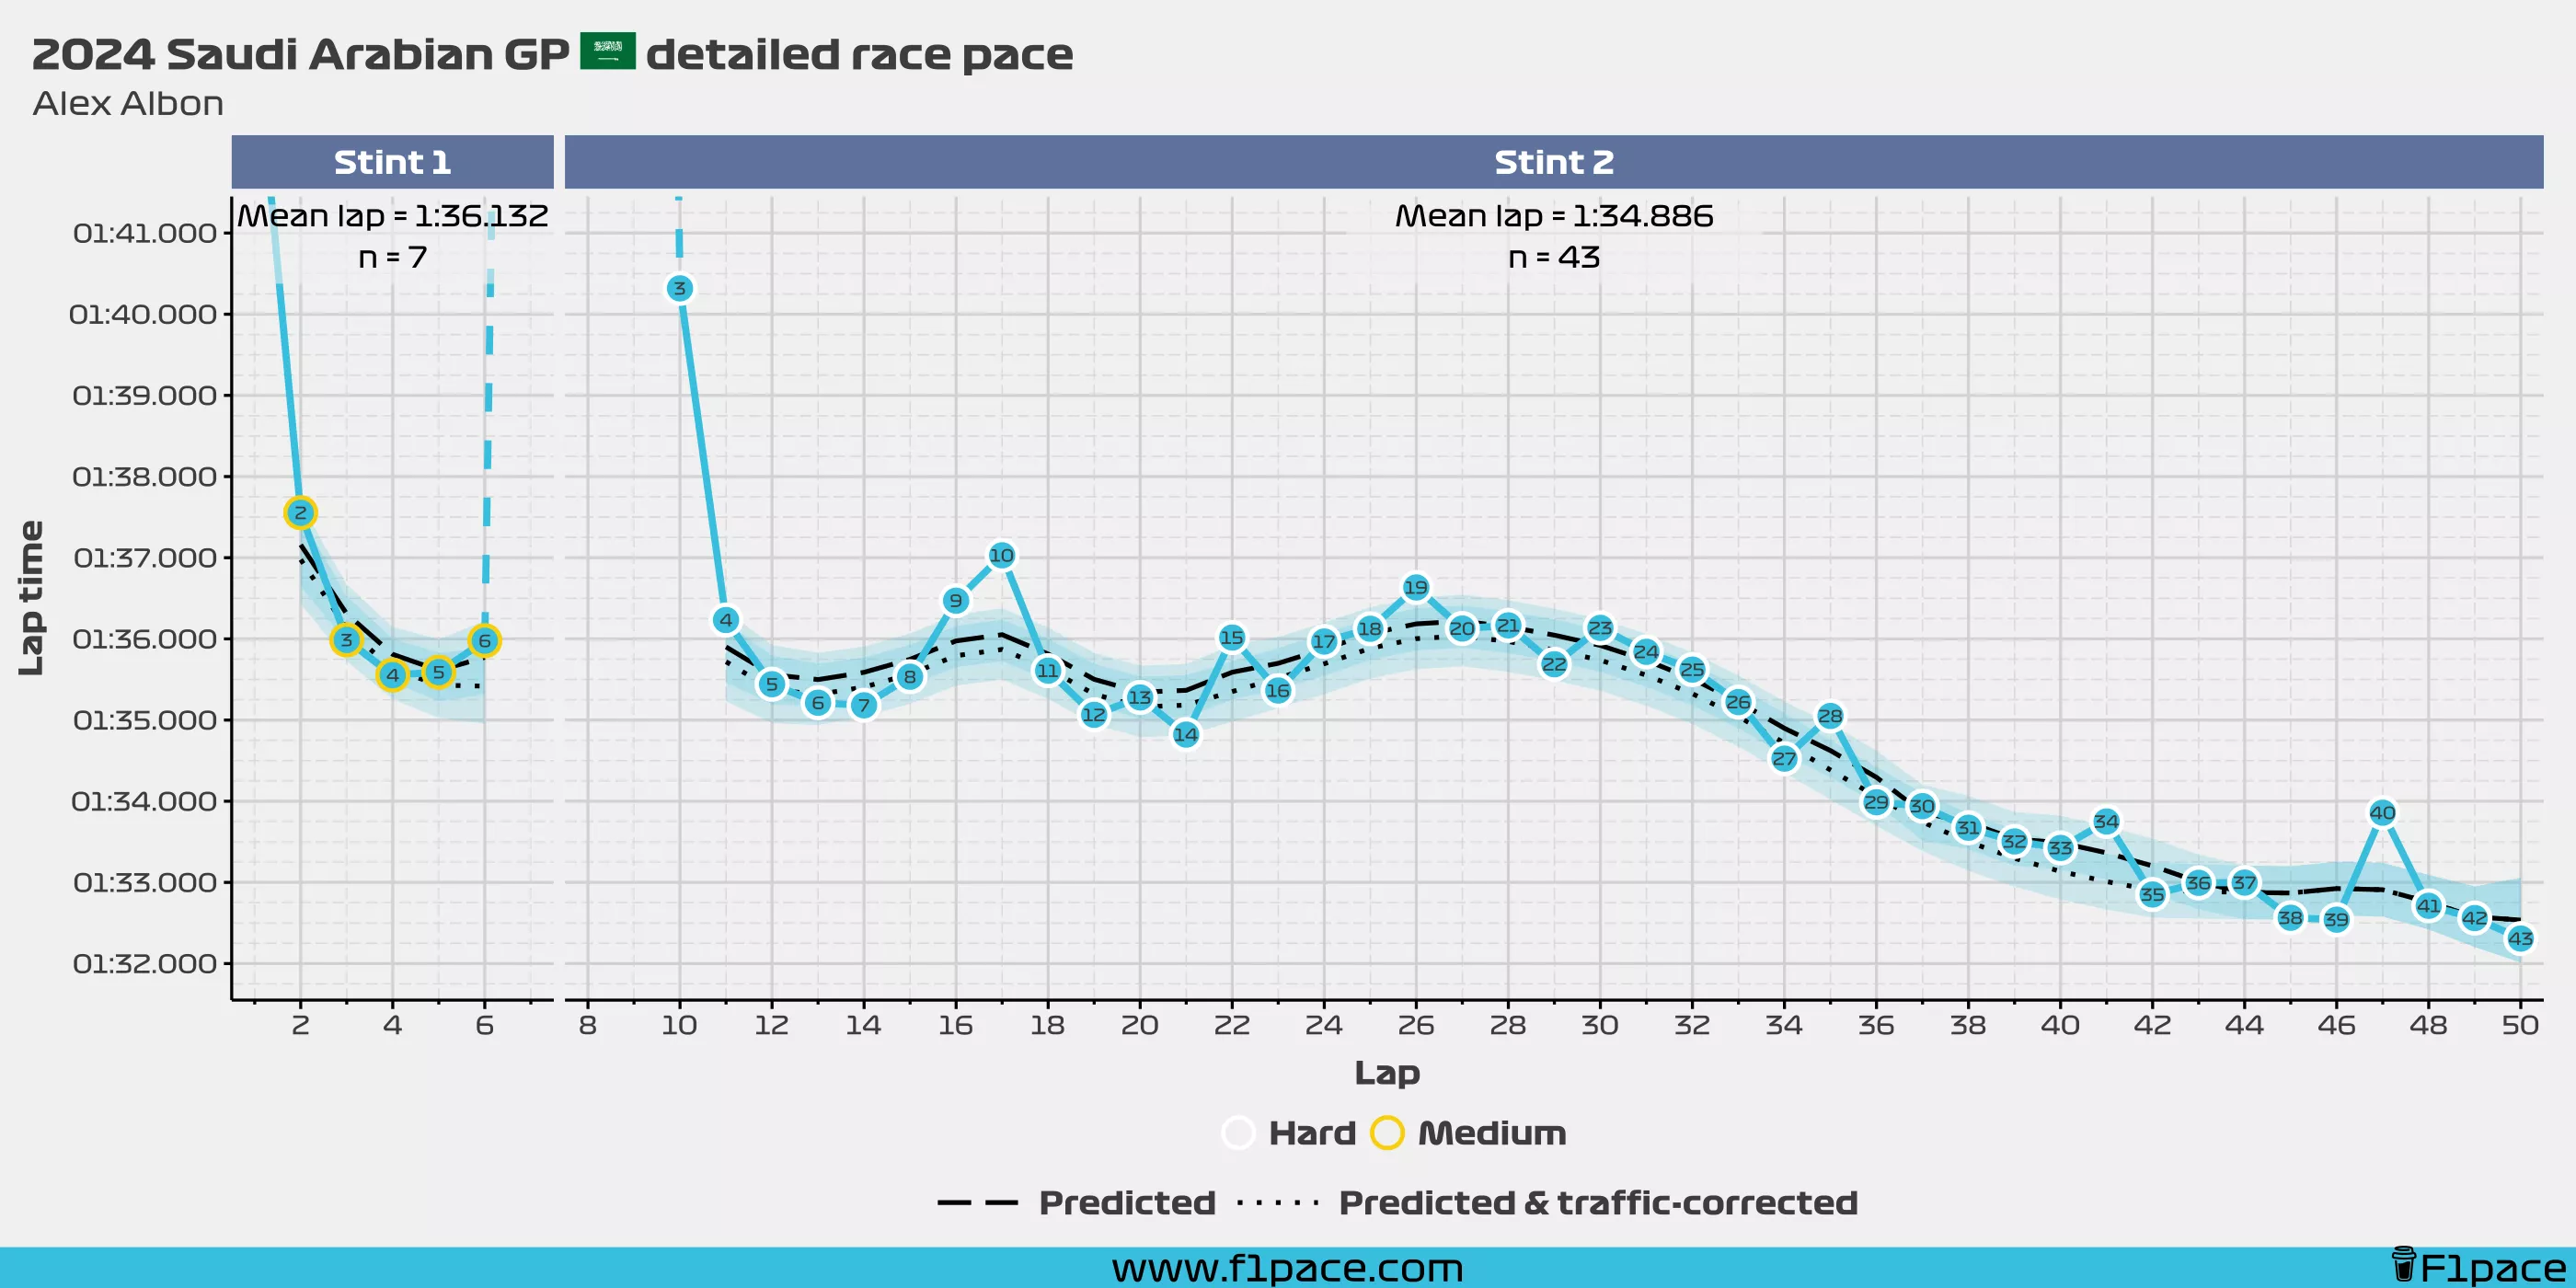
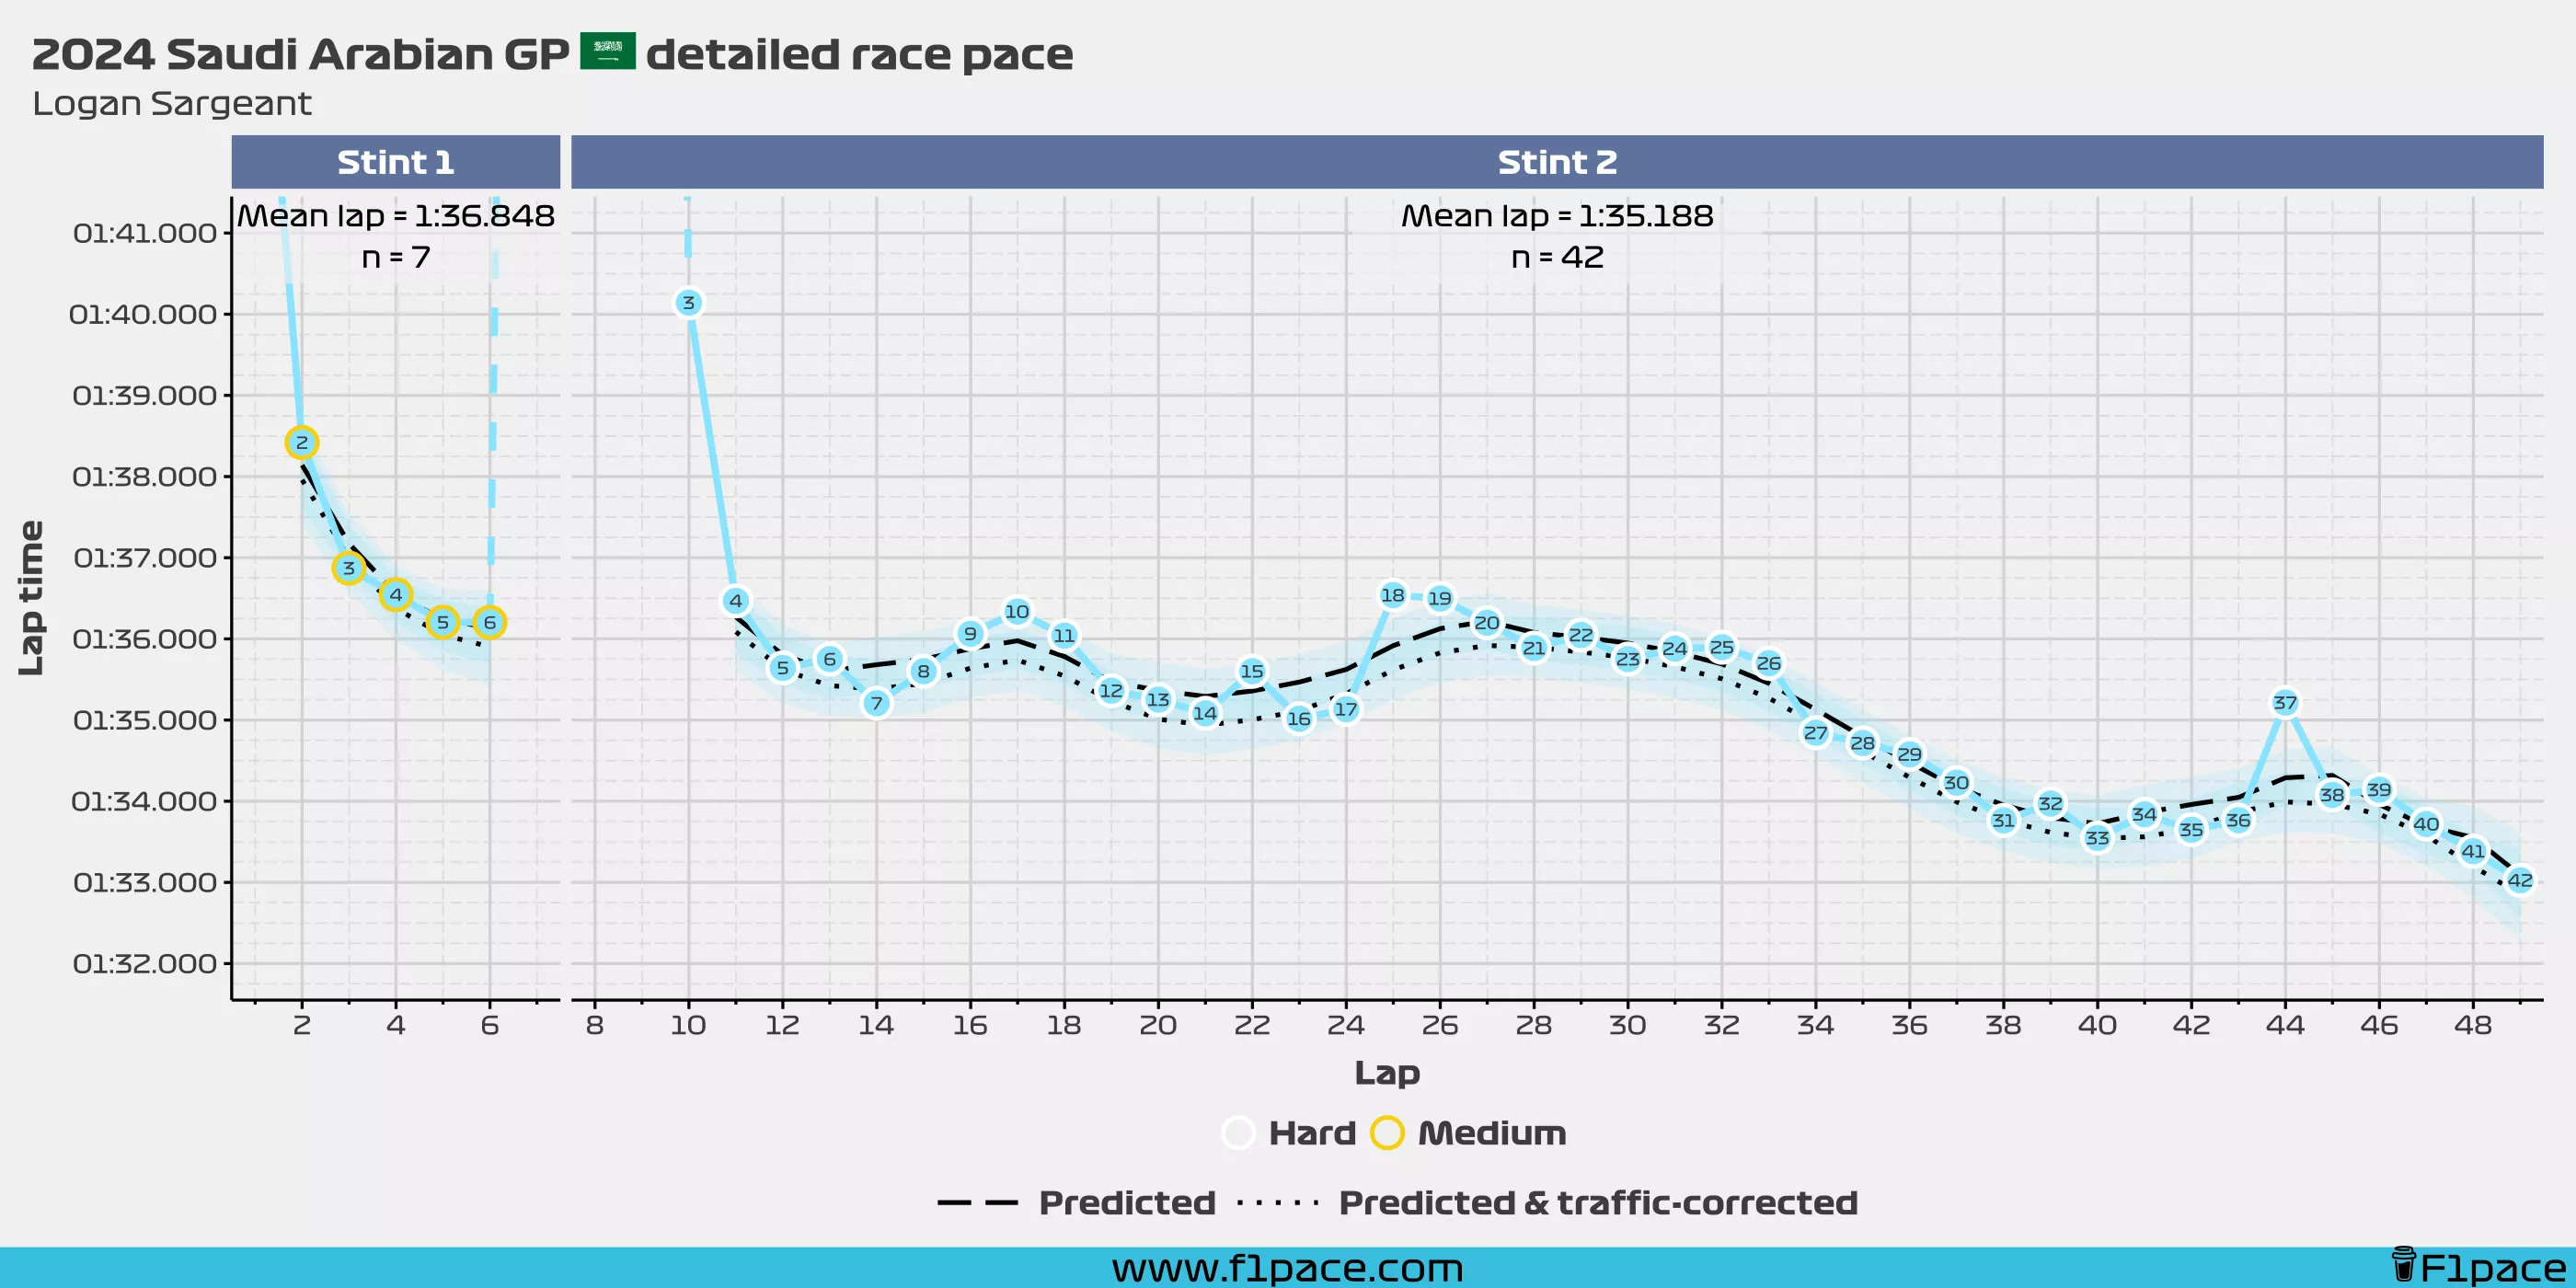
Williams
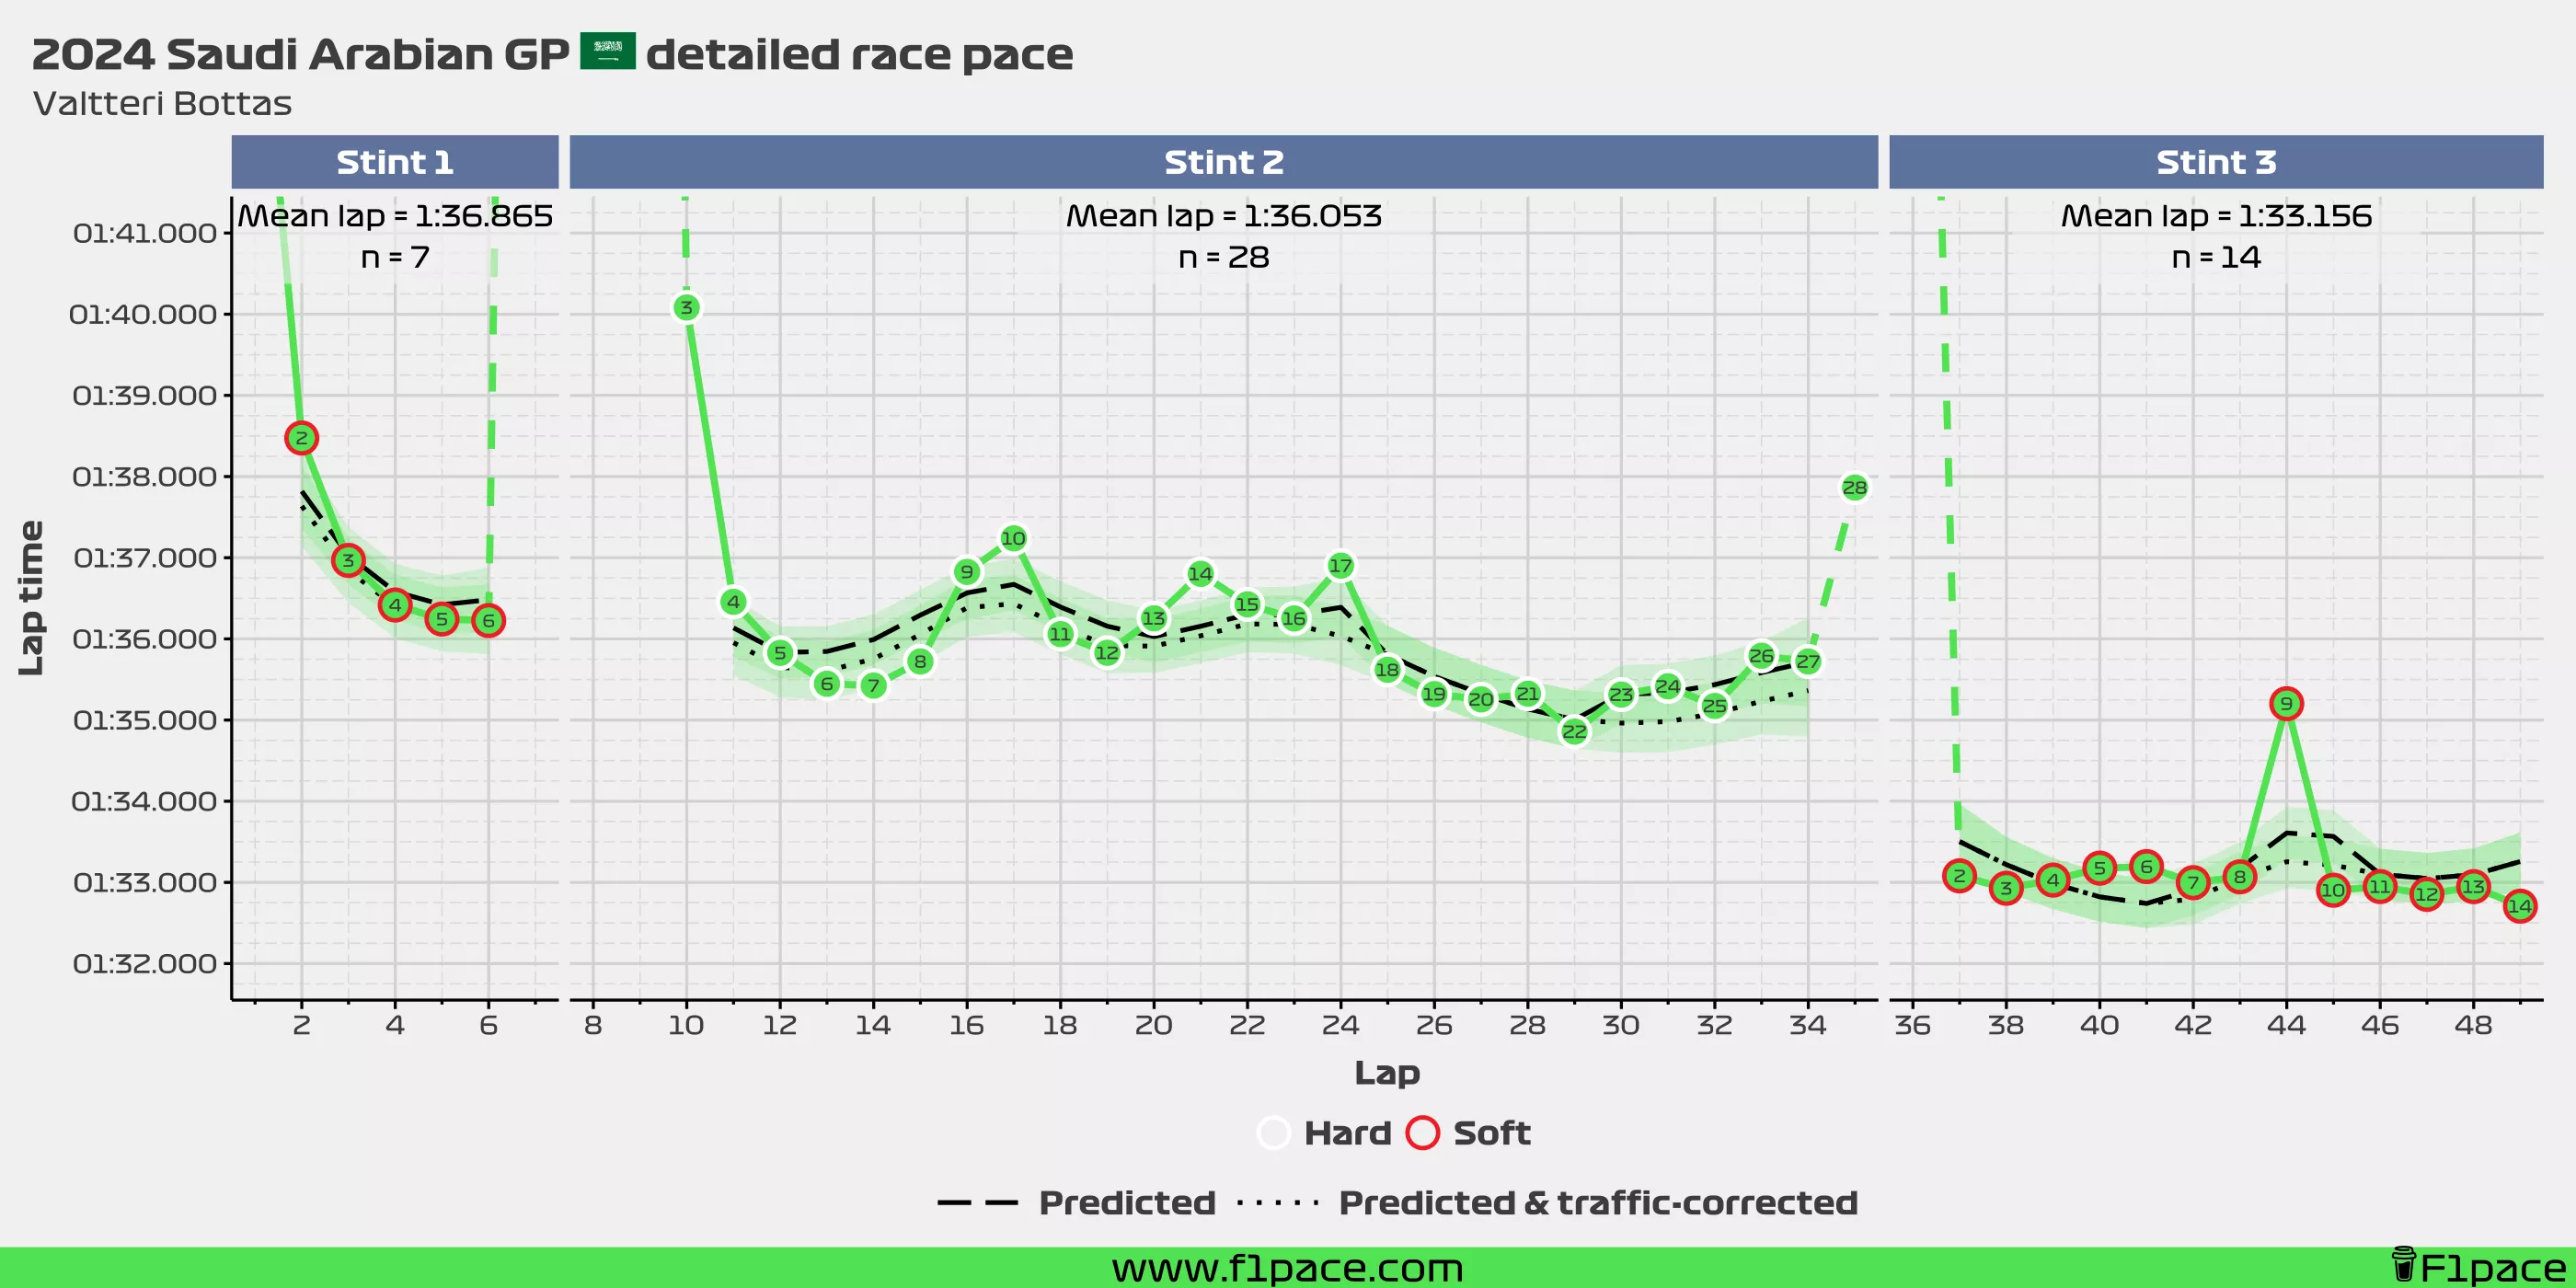
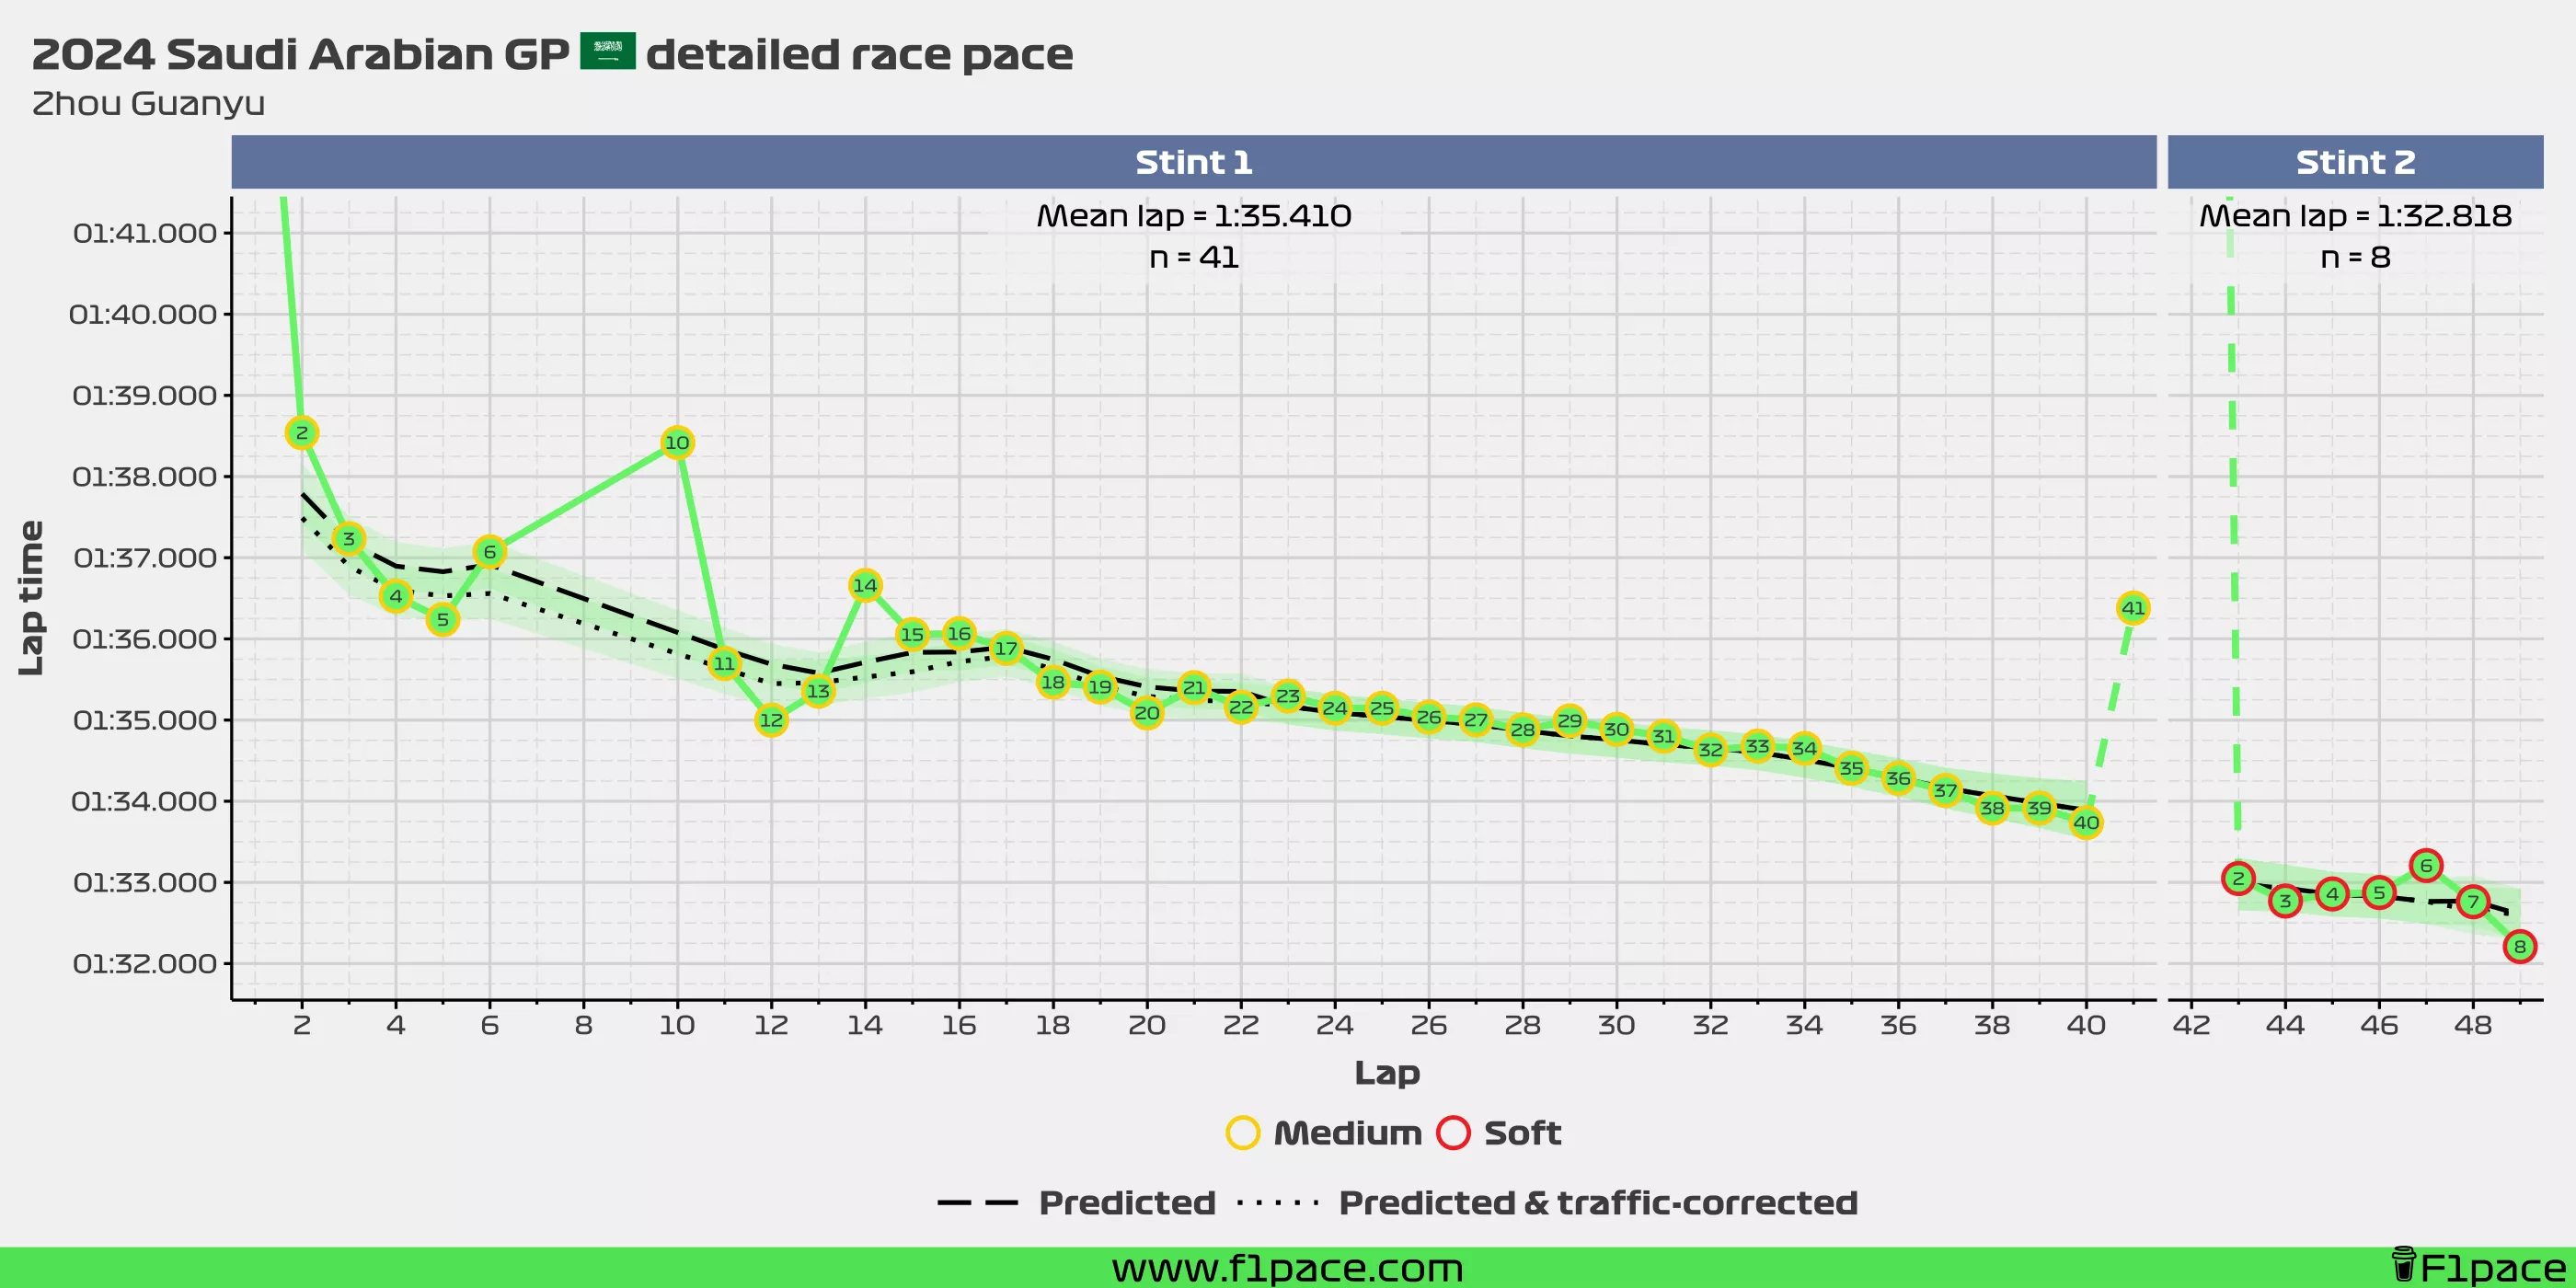
Sauber
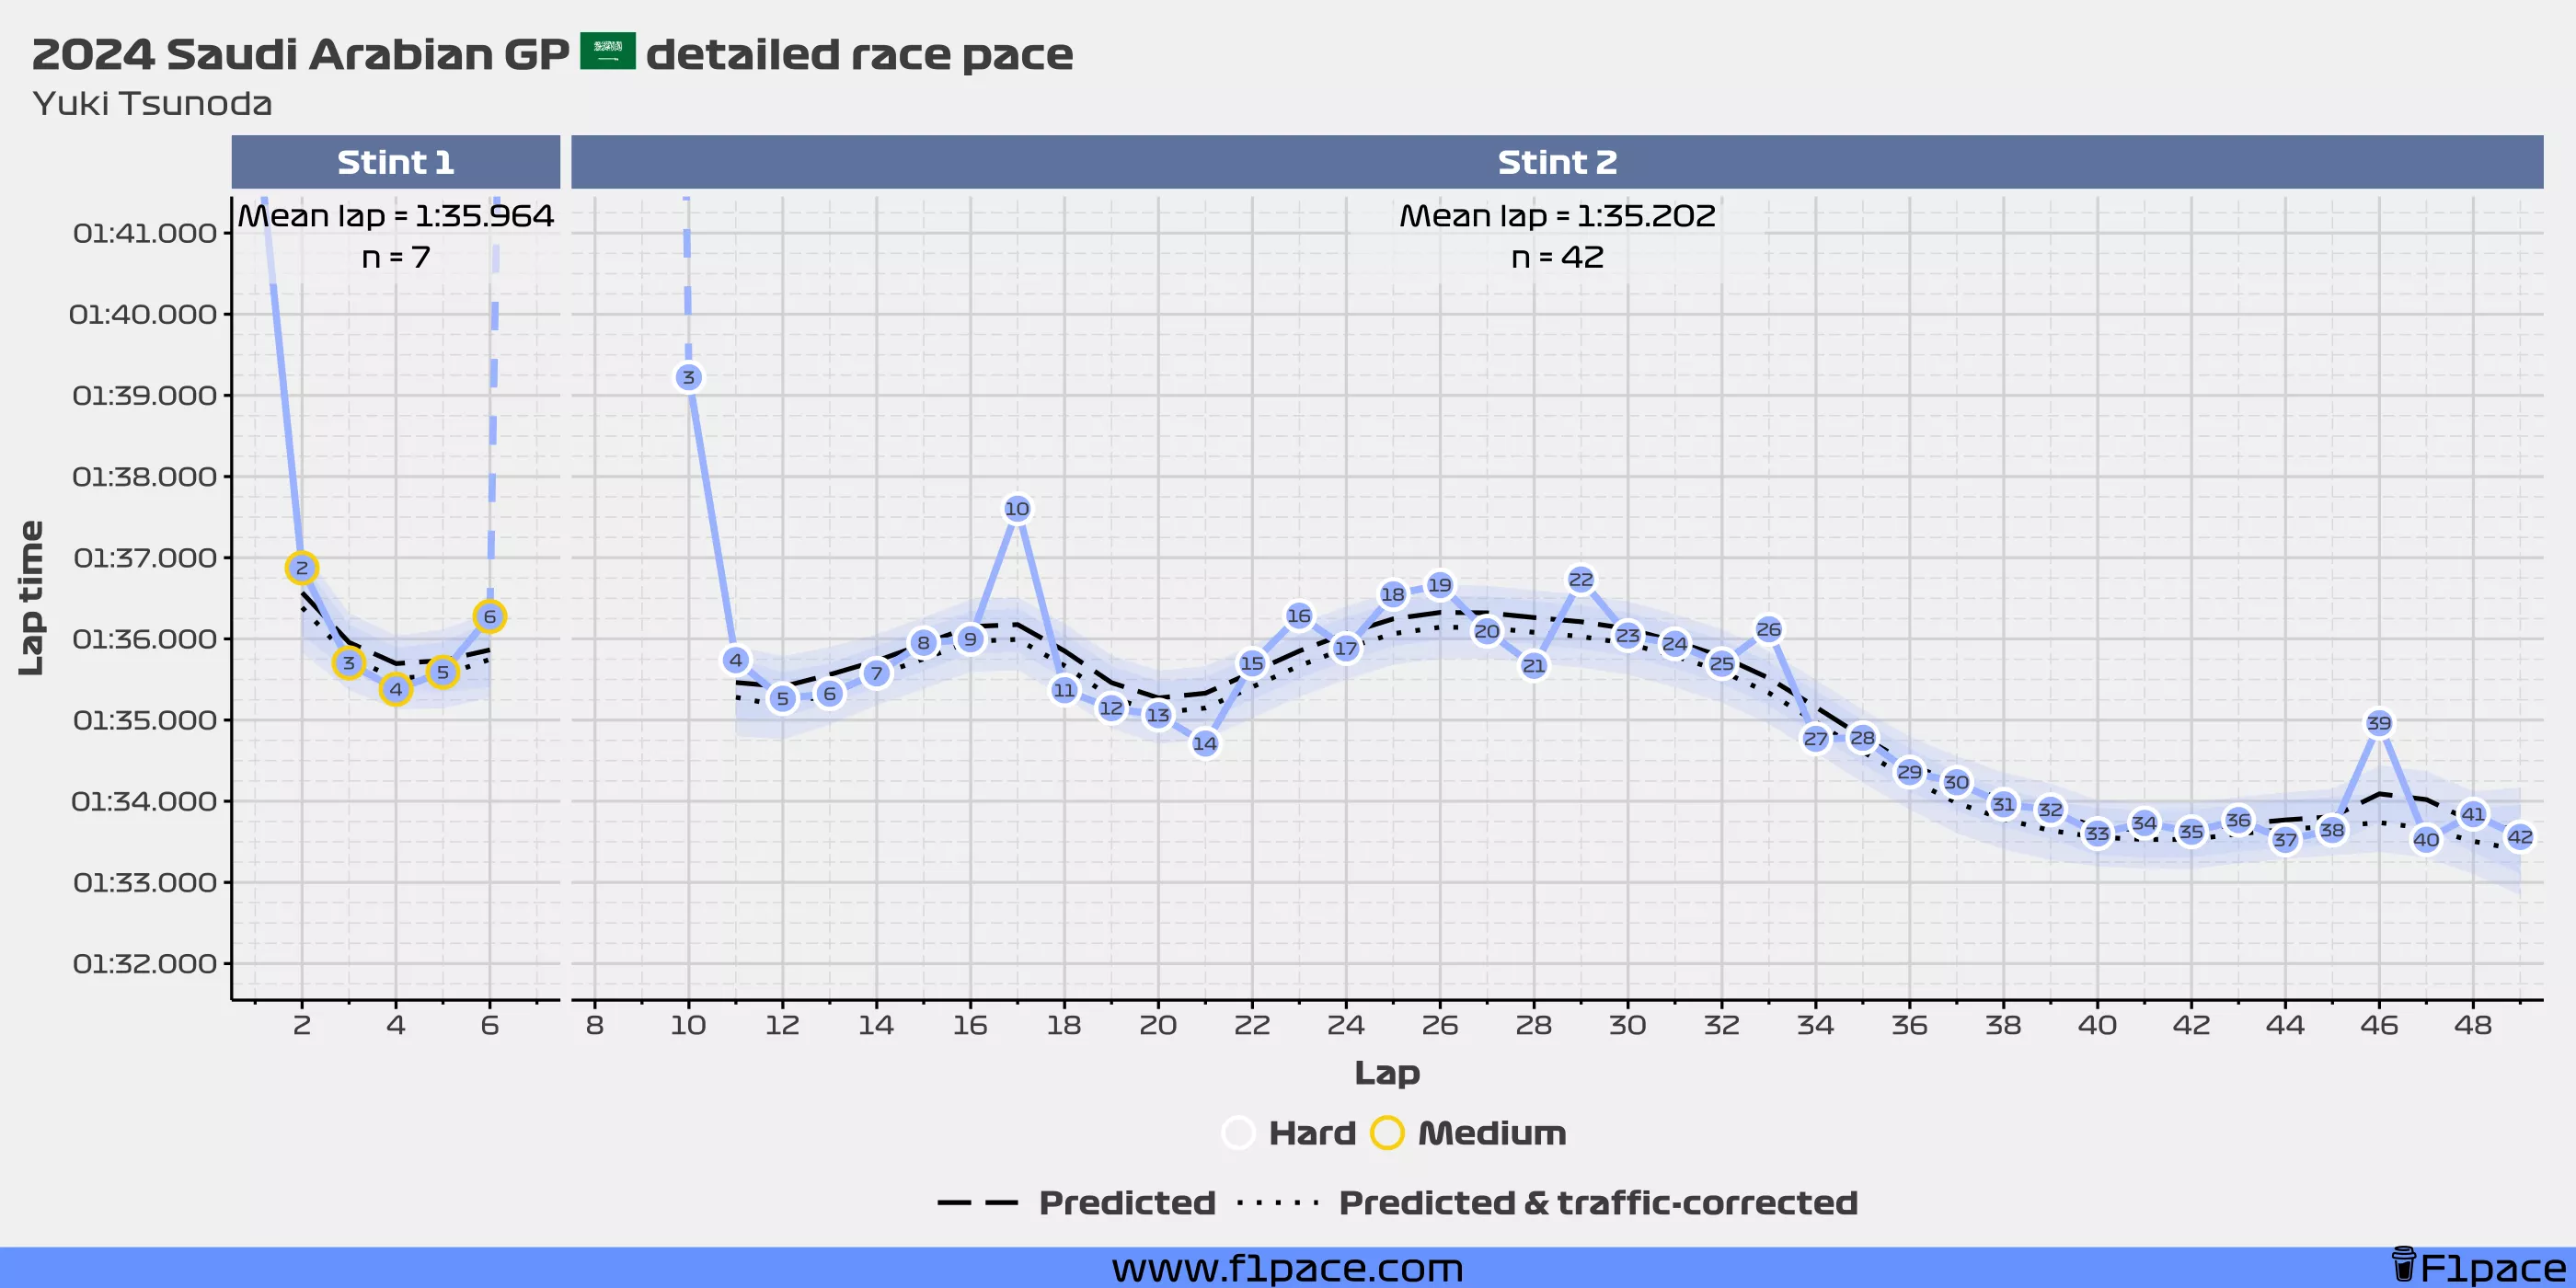
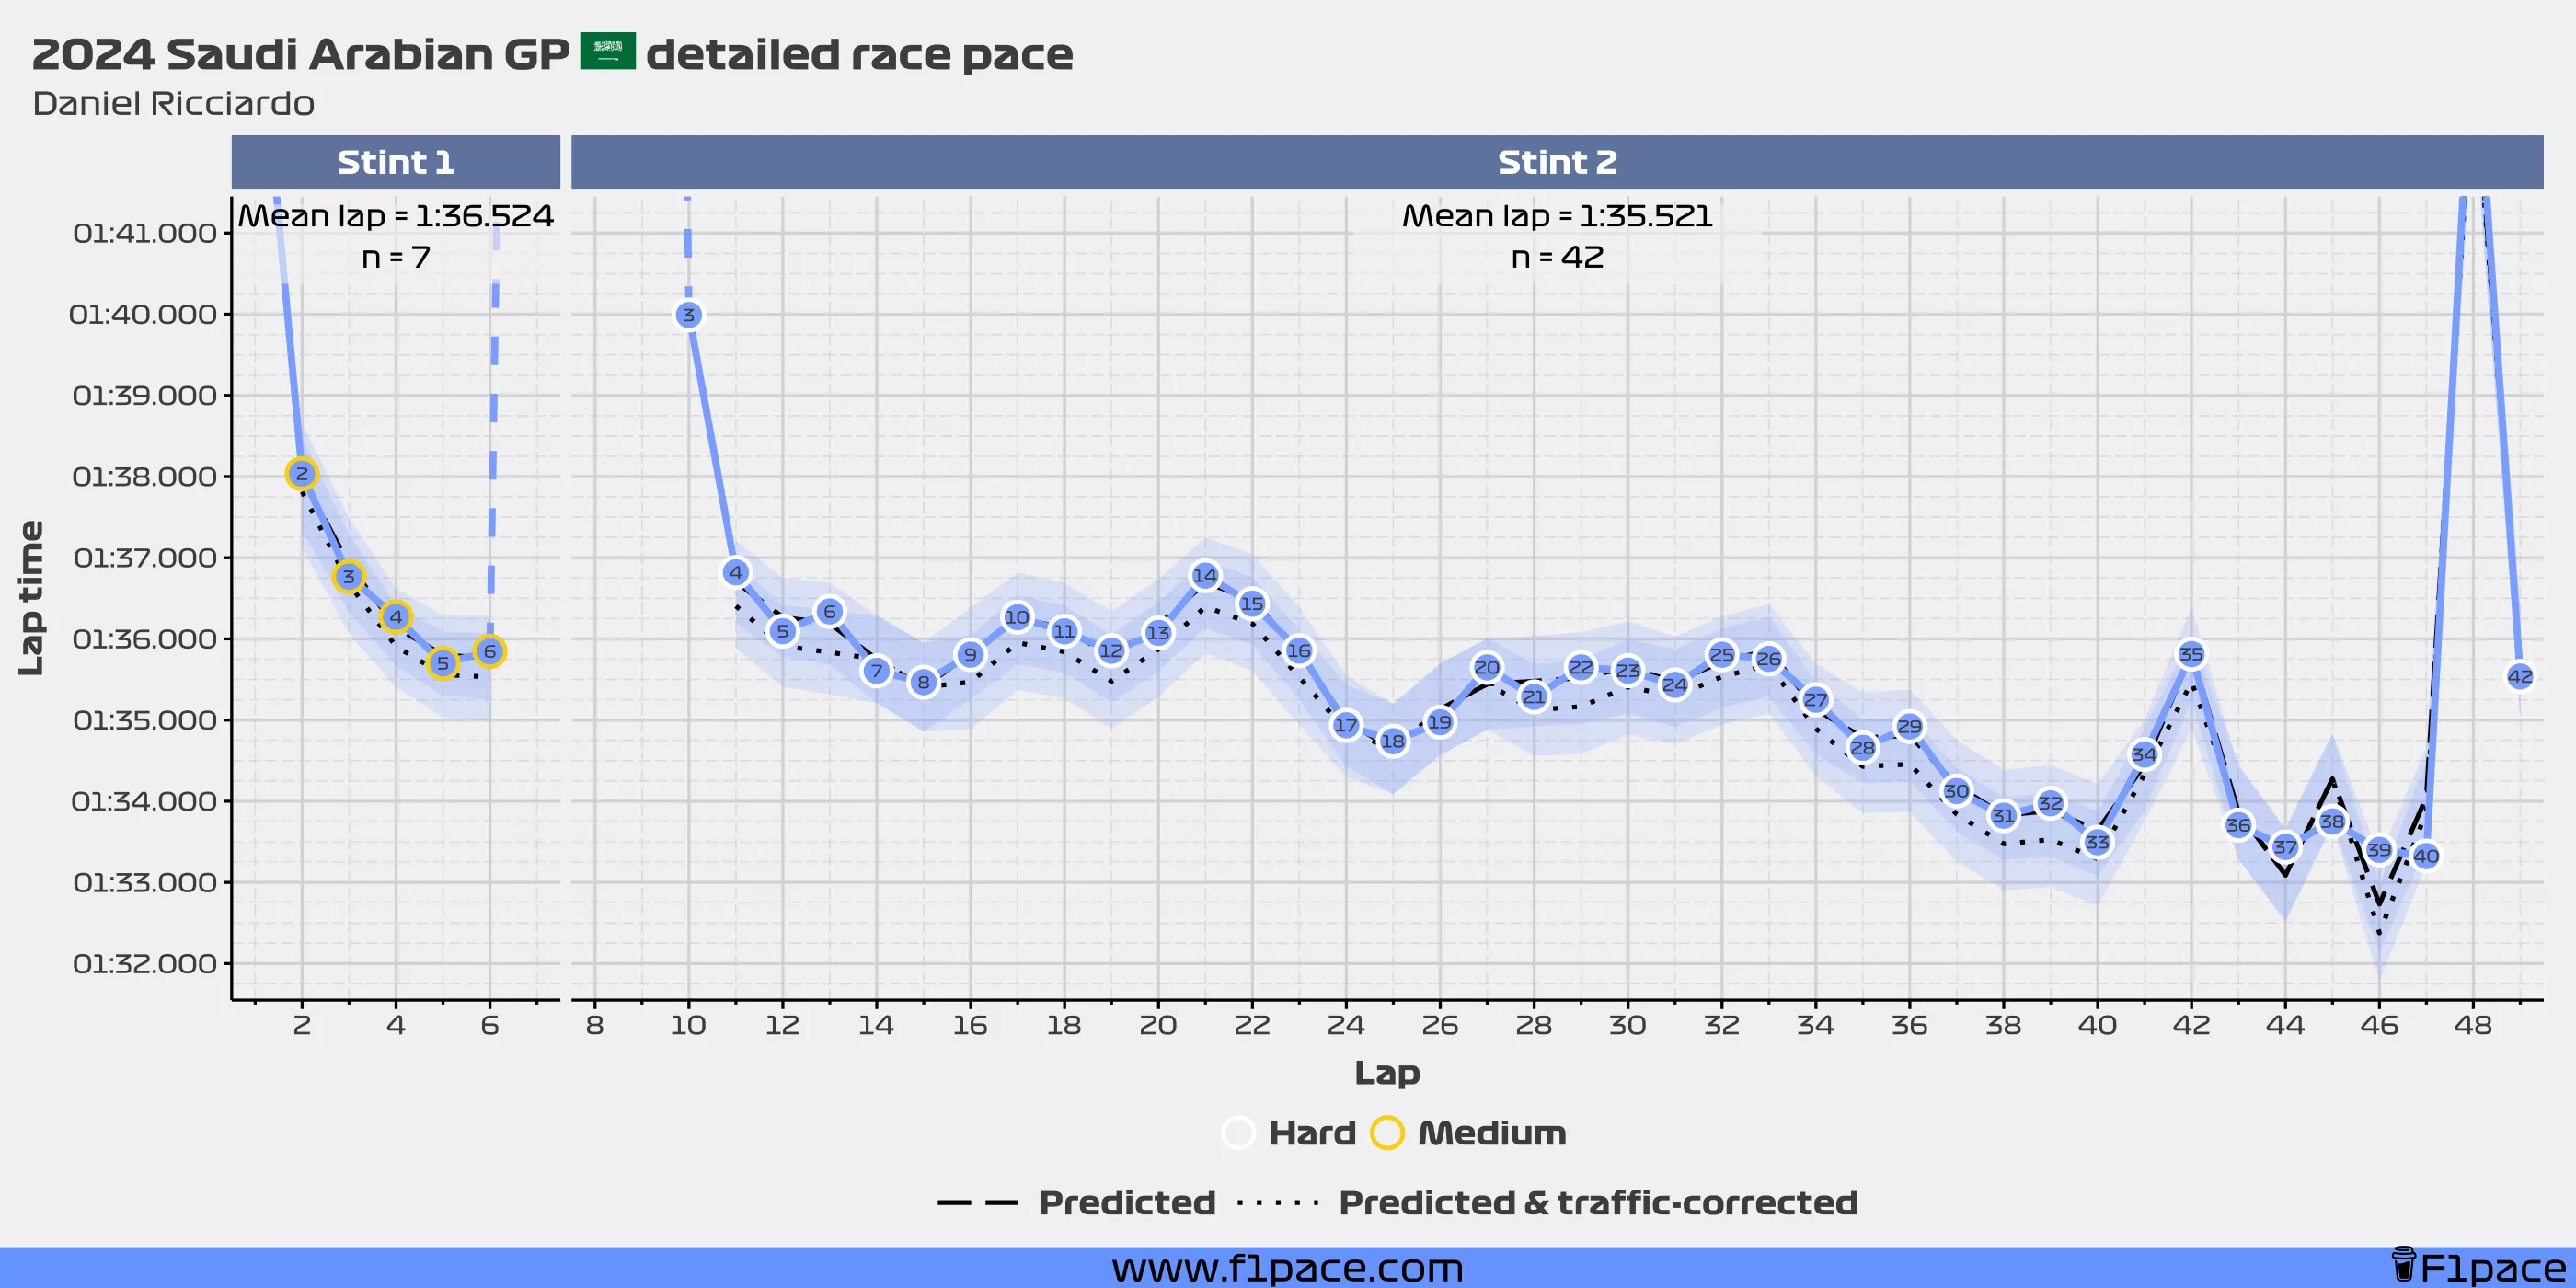
RB F1 Team
Haas