As I previously said, I don’t want to leave the site without content for so many days in a row. Because of that, I will continue with the trend of adding a bit of extra content during the week.
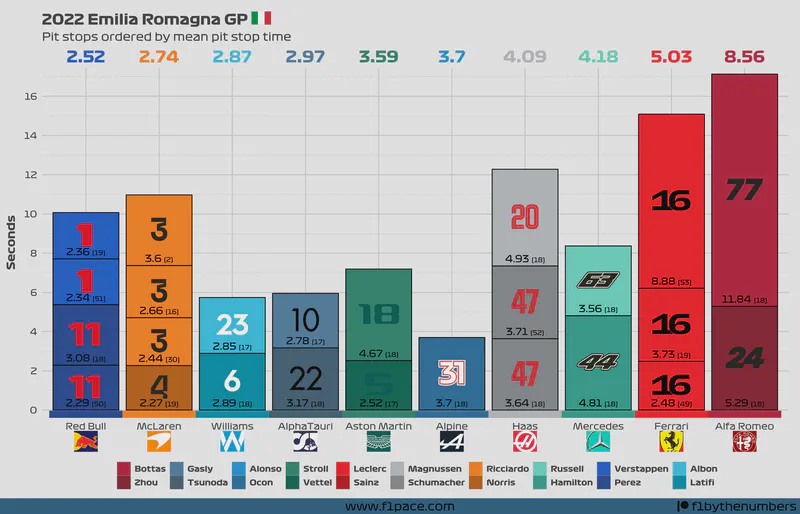
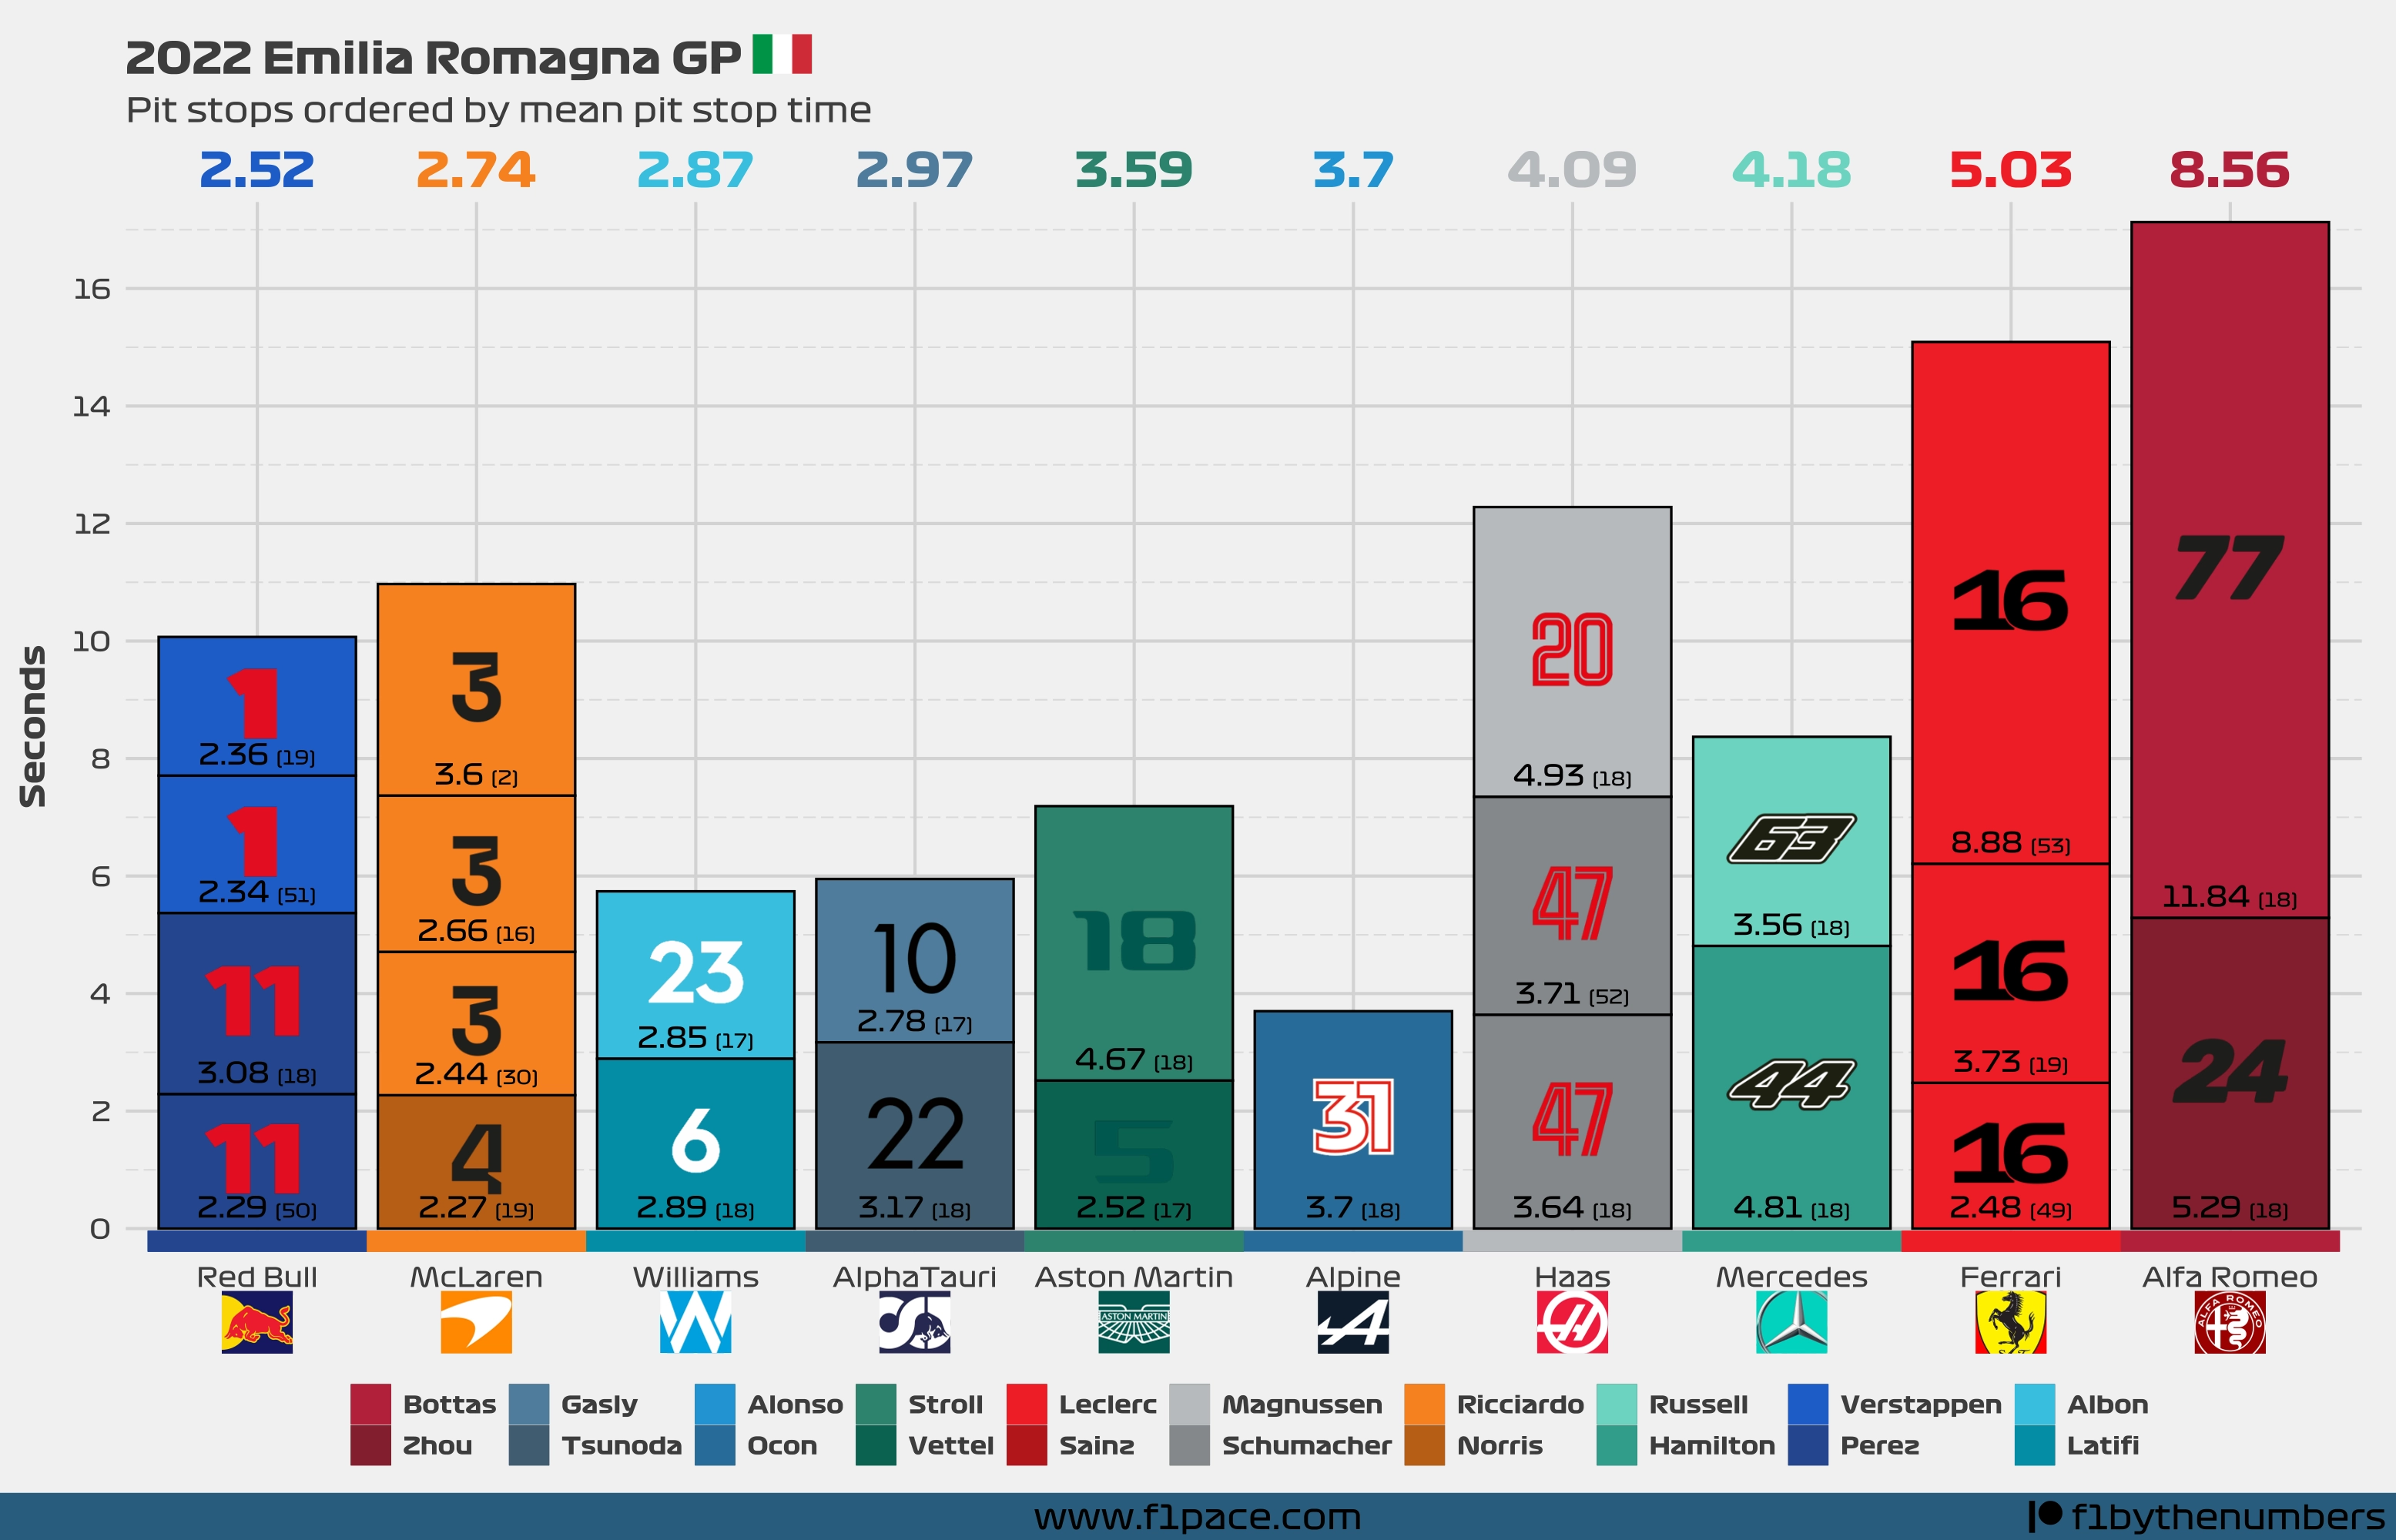
For now, I came up with the simple idea of adding a plot to visualize the pit stops that happened during the race. The chart itself is self-explanatory, but just in case, let’s see what information it has:
- The x-axis has each team that participated during the race.
- The y-axis has the total number of seconds.
- The bars are divided and stacked based on each pit stop for each team.
- The big numbers at the top show the average pit stop time for each team.
- The small numbers within each section of a bar represent the time for that particular stop.
- The number inside the parenthesis shows the lap when that pit stop was made.
- The driver number within each section of a bar is just for looks ;)
Caution
A shorter total bar isn’t necessarily better. Teams with fewer pit stops will tend to have shorter bars. The mean time is the most important metric to take from this chart.
Final remarks
I hope you are enjoying the content. I plan on adding more charts of pit stop data in the next few weeks. Let me know in the comments below if you’re interested in that. As usual, if you like the content, please share it on social media. If you want to support me you can click on the “buy me a coffee” button below to give me a donation.