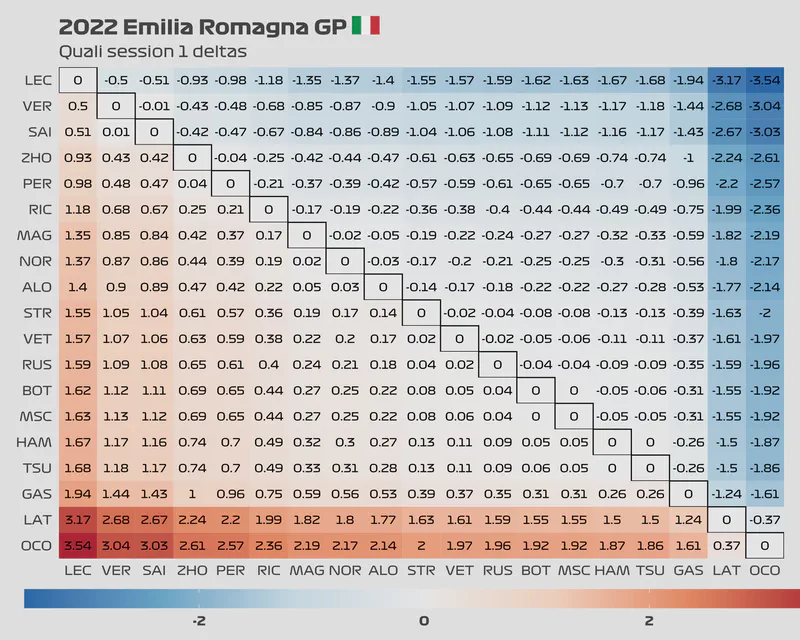
Quali session deltas
I am still not sure of what data to post for the quali sessions. I came up with an idea to create charts to see the deltas between all the lap times of all drivers
You can read the charts like this:
- Choose a driver from the left side of the plot (y-axis)
- Choose a second driver from the bottom of the plot (x-axis)
- See where they intersect. The number that you see is the delta for their best lap in that quali session.
- Negative numbers mean the driver on the left side was faster than the driver he’s being compared to.
- Positive numbers mean the driver on the left side was slower than the driver he’s being compared to.
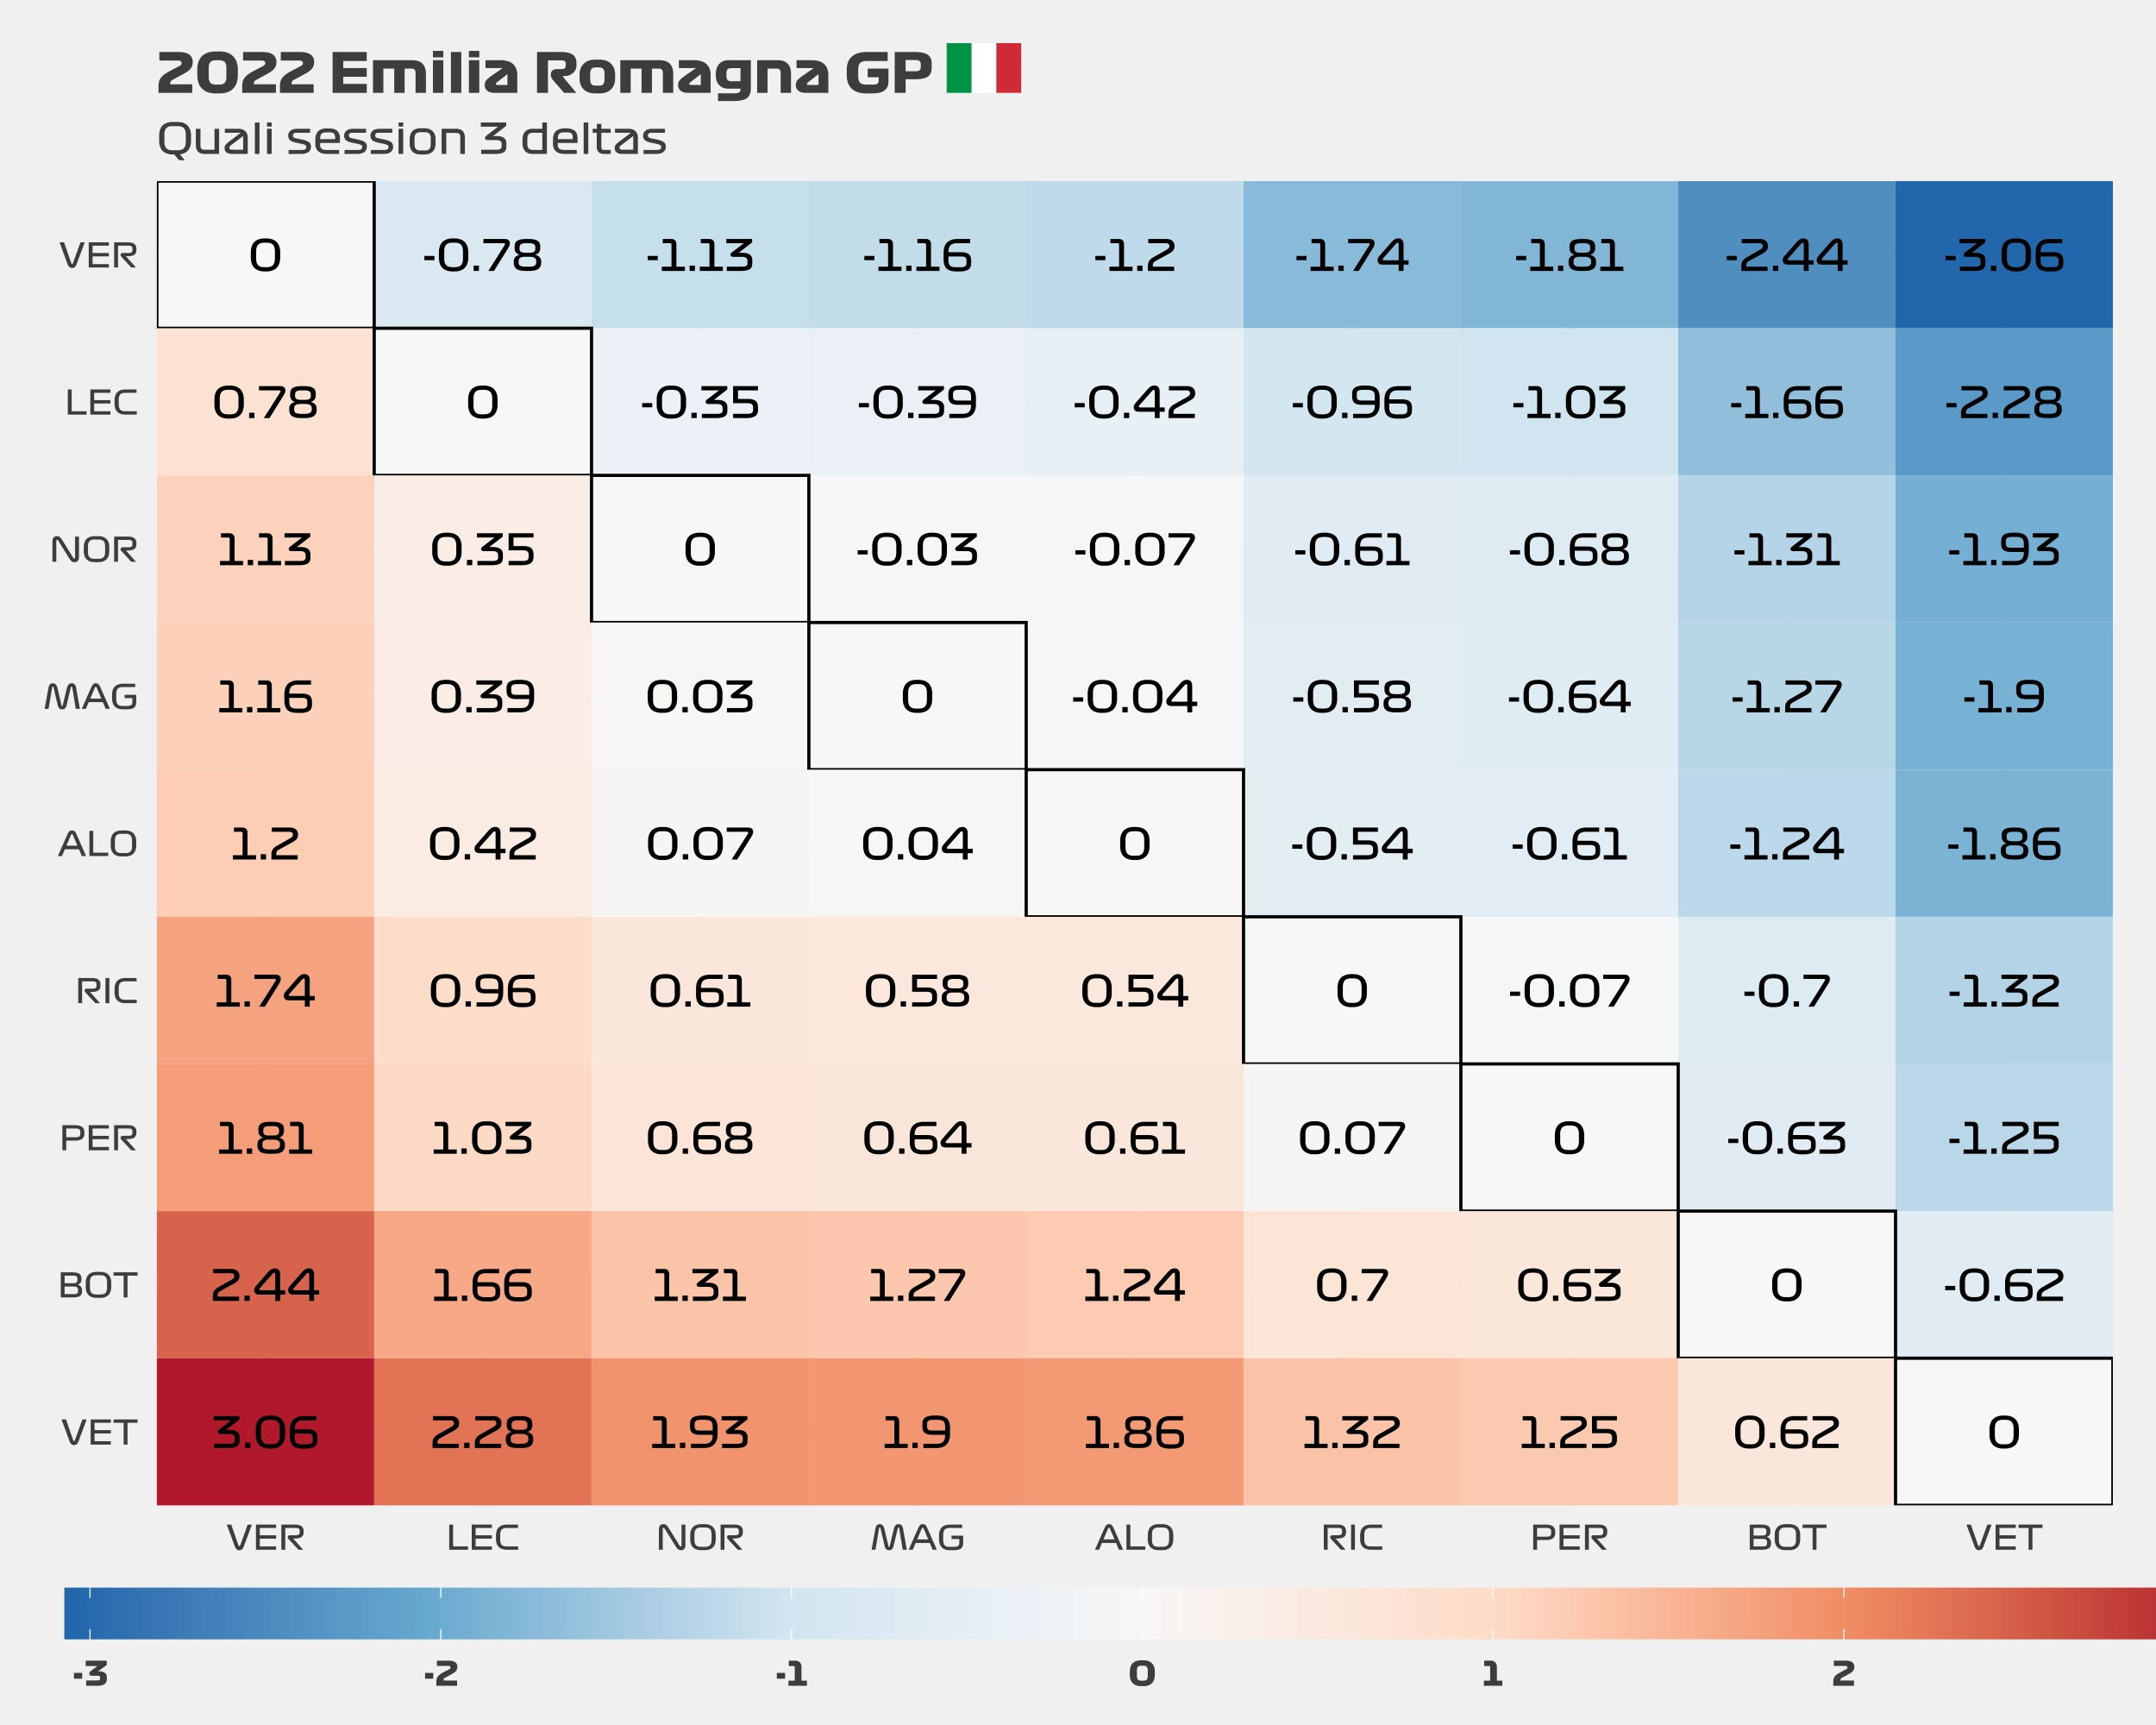
- For example: Verstappen on Q3 vs Leclerc on Q3. The delta is of -0.78 seconds. This means that Verstappen’s best lap was 0.78 seconds faster than Leclerc’s.
Quali session summary table
Just as before, I am adding a table that contains most of the information about the quali session. For this particular race, the chqart may contain some laps that were not really flying laps. I normally filter the laps based on the minimum lap time + a value that I determine to be appropriate. With changing conditions it’s hard to do this so I decided to instead keep more laps instead of deleting valid laps.