Even though I always post the race pace charts, I never really talk about cumulative race pace, or overall race pace, over several races. The reason I don’t usually do it is because it’s hard to compare race pace between races. Every track is different, with widely different lap times. You can’t directly compare the race pace of Max Verstappen in Spielberg to the pace of Leclerc in Spa. One has an average lap time of around 1 minute, the other one of close to two minutes.
Some people try to compare them using percentages, but I don’t feel like that really works since it doesn’t take into consideration the spread of the data. You would expect the lap times to be closer between drivers on some tracks, and further away on some other circuits.
The best way to generate a proper comparison is to standardize the data. The formula to do that is the following: $$ Z = \frac{ x - \mu}{\sigma} $$ $$ Z = Z\ score \\ x = Lap\ time \\ \mu = Average\ lap\ time \\ \sigma = Standard\ deviation $$ The formula is quite simple. To get a standardized lap time, all that needs to be done is:
- Get a lap time.
- Subtract the average lap time of the race.
- Divide the result by the standard deviation of the lap times of the race.
This process is repeated for all the laps that were done for a race. The result is a collection of standardized lap times. We then repeat the same process in each race that has taken place. Since all the lap times were standardized, they can indeed be compared between different races. Nice.
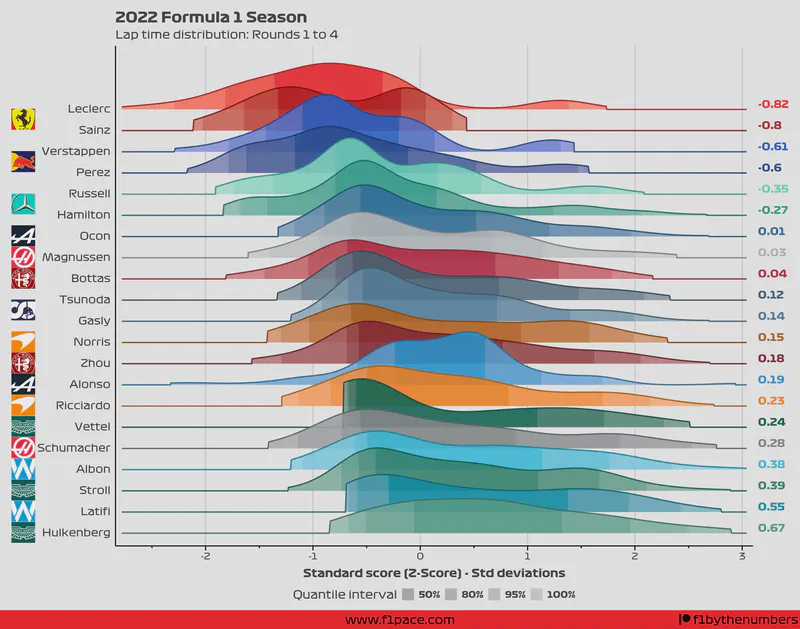
So, what is the result for the first 4 races of the season? Take a look at the following image.
The interpretation is harder since the units are now not in seconds, but in number of standard deviations from the mean. So, if I could explain this chart I would do it like this:
- The curves, or slabs, represent the density of all the lap times done over the number of races specified in the title.
- The higher the slab, the more laps were done around that specific Z-score.
- The density is smoothed, meaning that is not a perfect representation of the data. It should, however, accurately represent the distribution of the laps.
- A Z-score of 0 represents the average time over the first 4 races of the season. If a driver has a Z-score of around 0, then his race pace was close to the average race pace.
- Negative Z-scores represent faster lap times than the average.
- Positive Z-scores represent slower lap times than the average.
- Assuming a normal distribution—something that I’m doing here—most of the laps should fall between -1 and 1.
- Lap times under -1 are very fast compared to the mean, while times over 1 are very slow compared to the mean.
- The quantile intervals represent the number of laps done within a Z-score range. For example, the 50% quantile interval shows where 50% of the laps for a driver were done around the average time.
- If the quantile interval ranges are narrow, then most of the lap times were very consistent and not spread out.
- The average Z-score is shown on the right side of the chart.
While this chart has some limitations, mostly in terms of interpretation, it should allow you to compare the race pace of the drivers throughout the season.