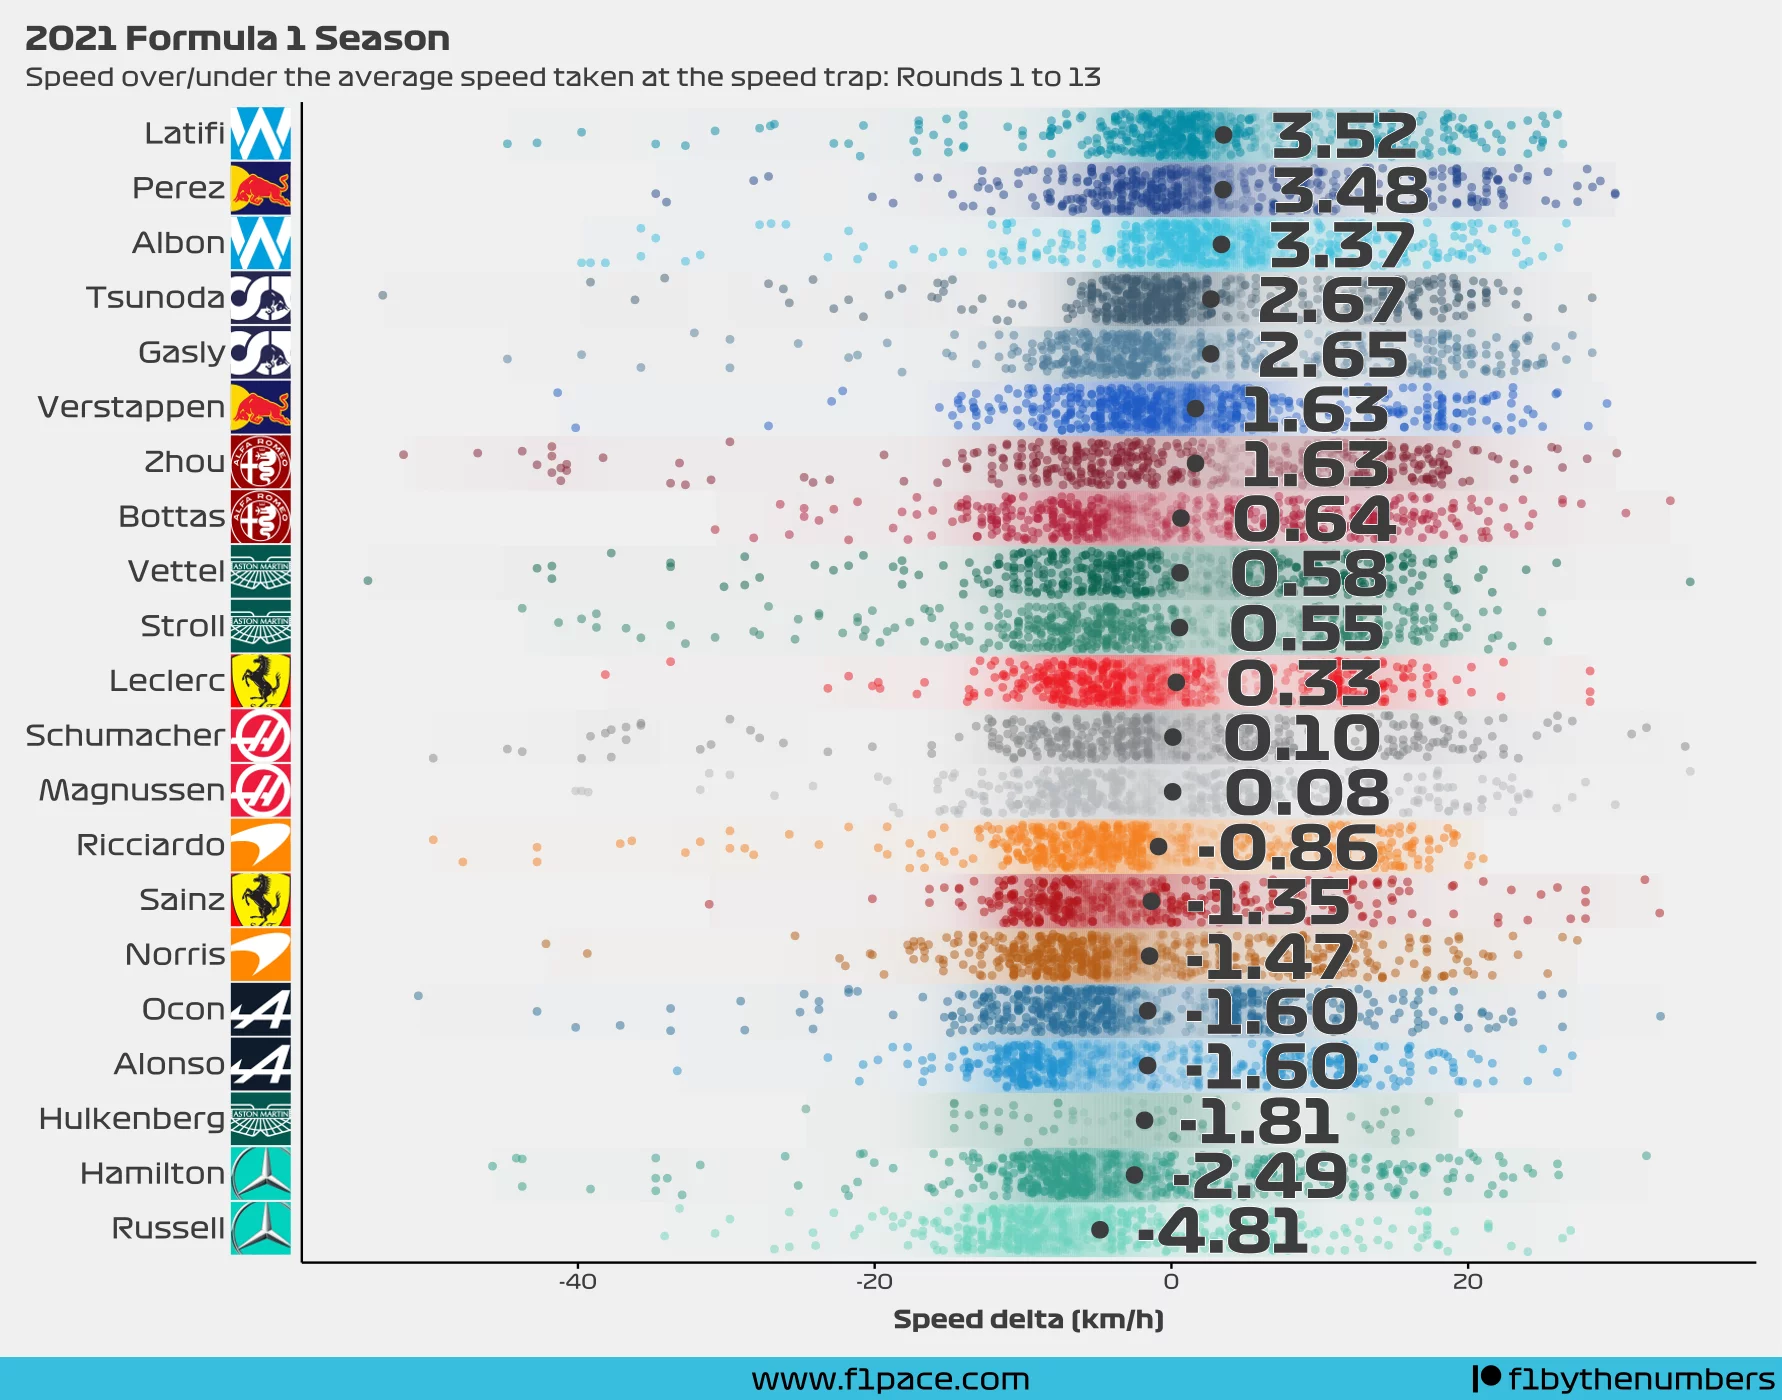
This is a simple mid-season update. The chart shows the speed of each driver as measured at the speed trap for the first 13 races of the season. To allow a proper display of the data, I got the average speed at the speed trap for each race, and then each data point was compared to that average speed for each of the first 13 races of the season.
In the end all of these data points, which are around 500 for each driver, are averaged to get an overall speed over/under the average speed taken at the speed trap.

