Quali session deltas
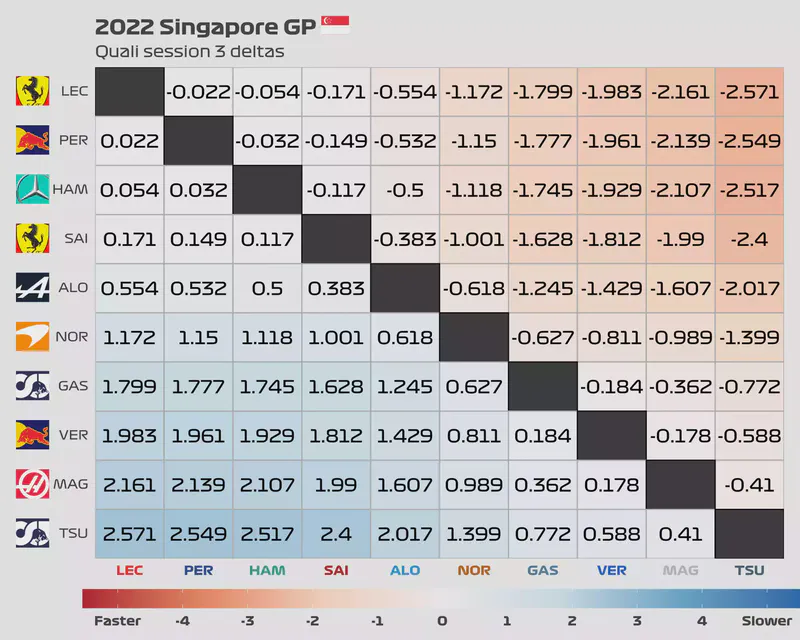
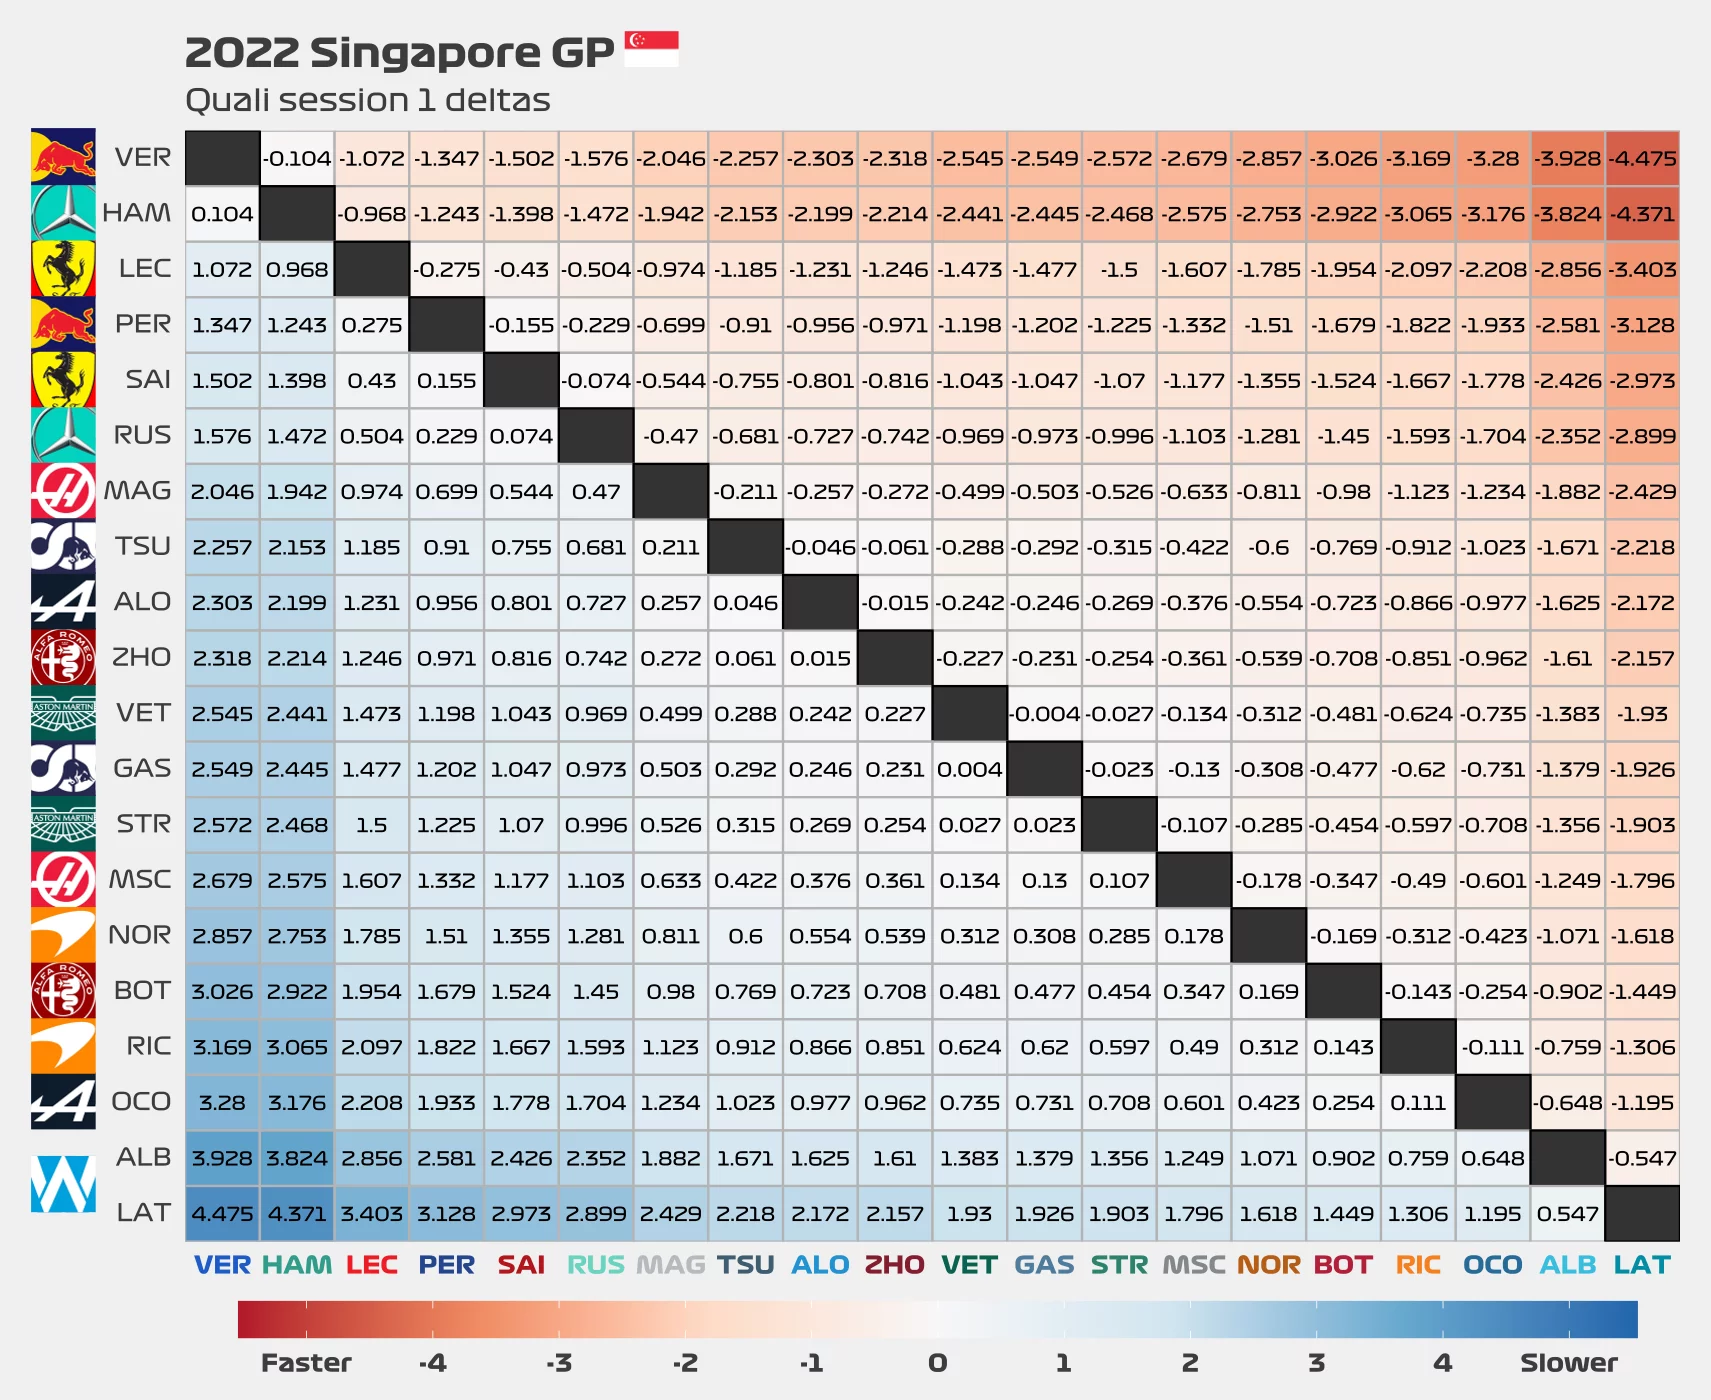
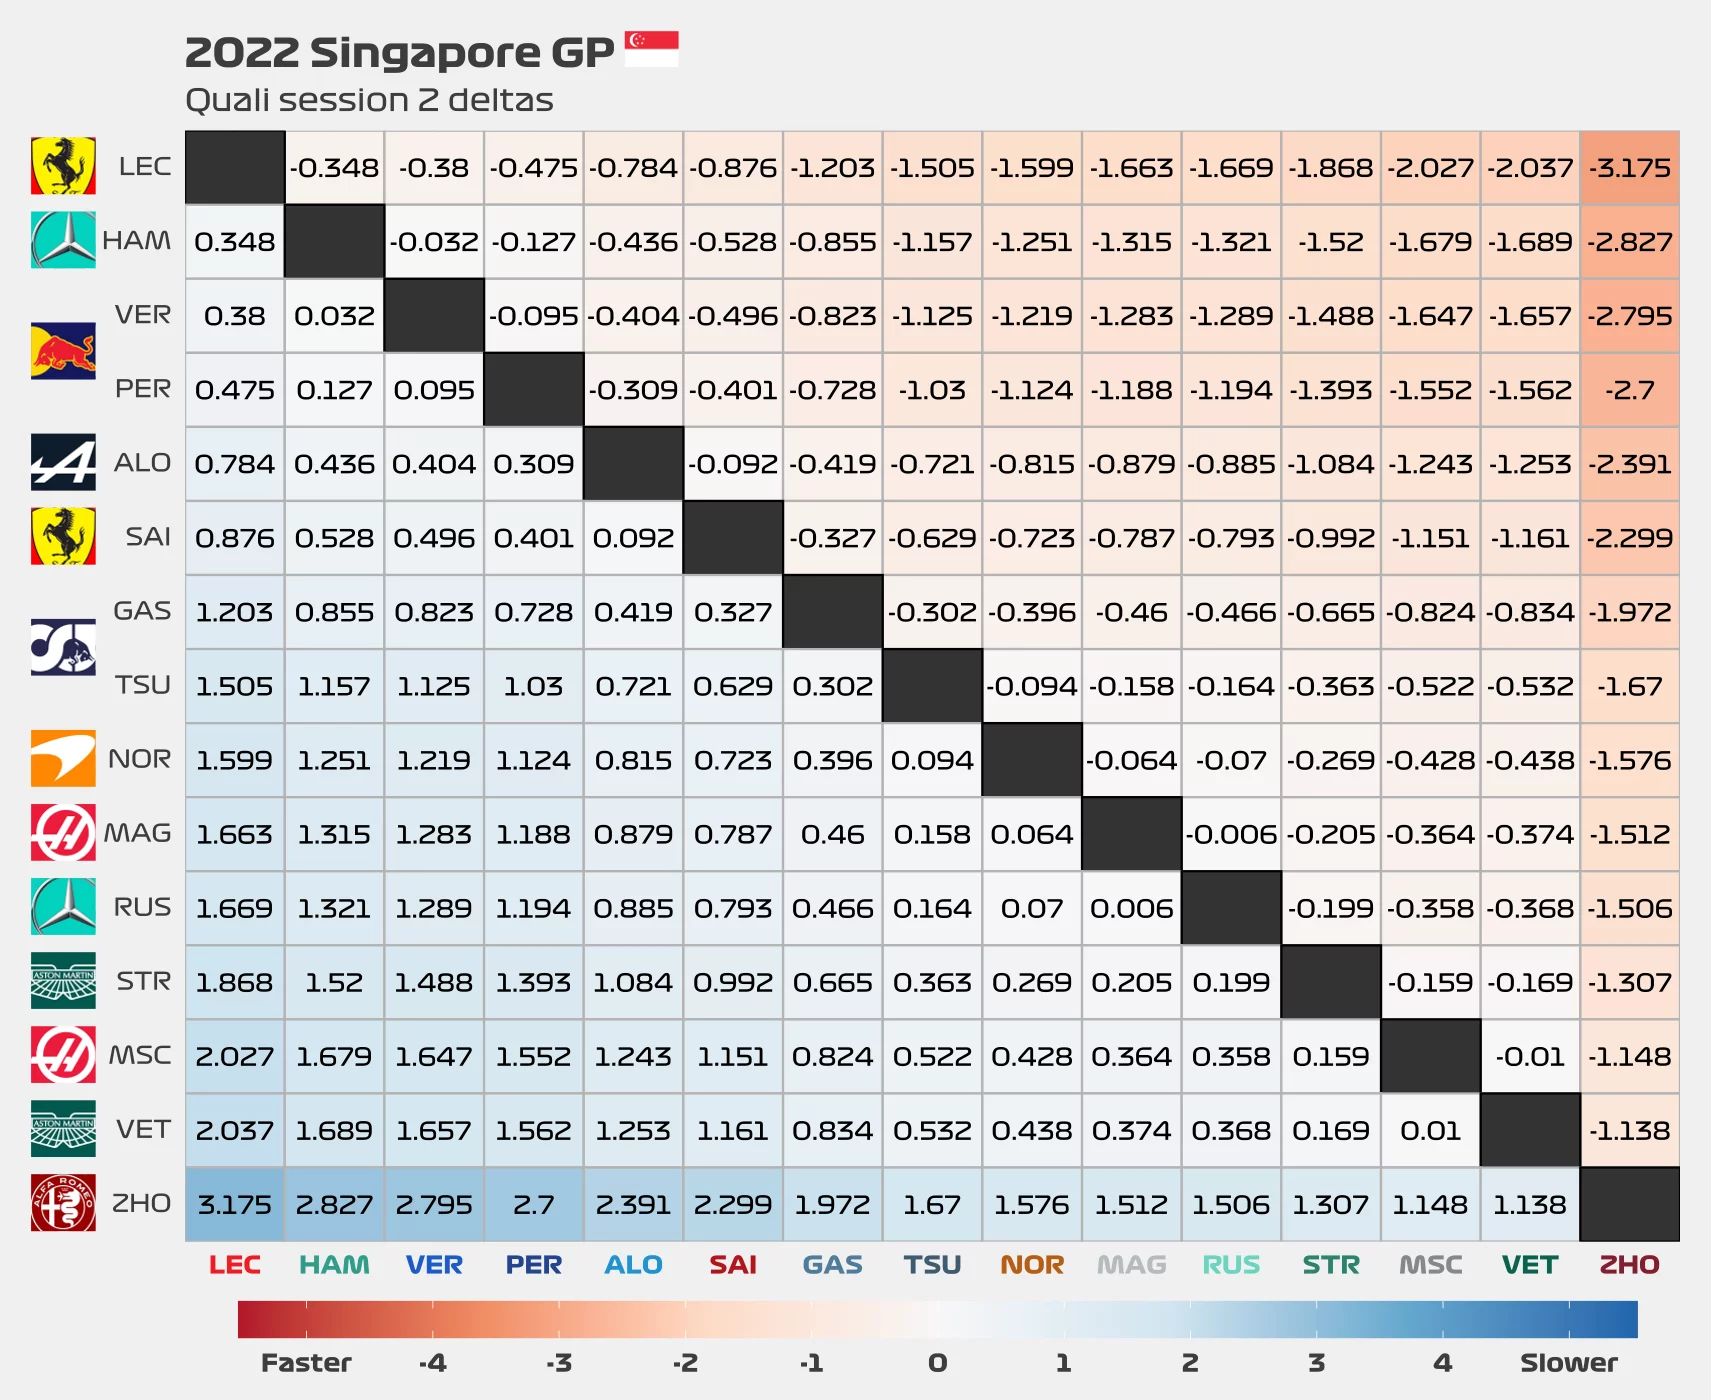
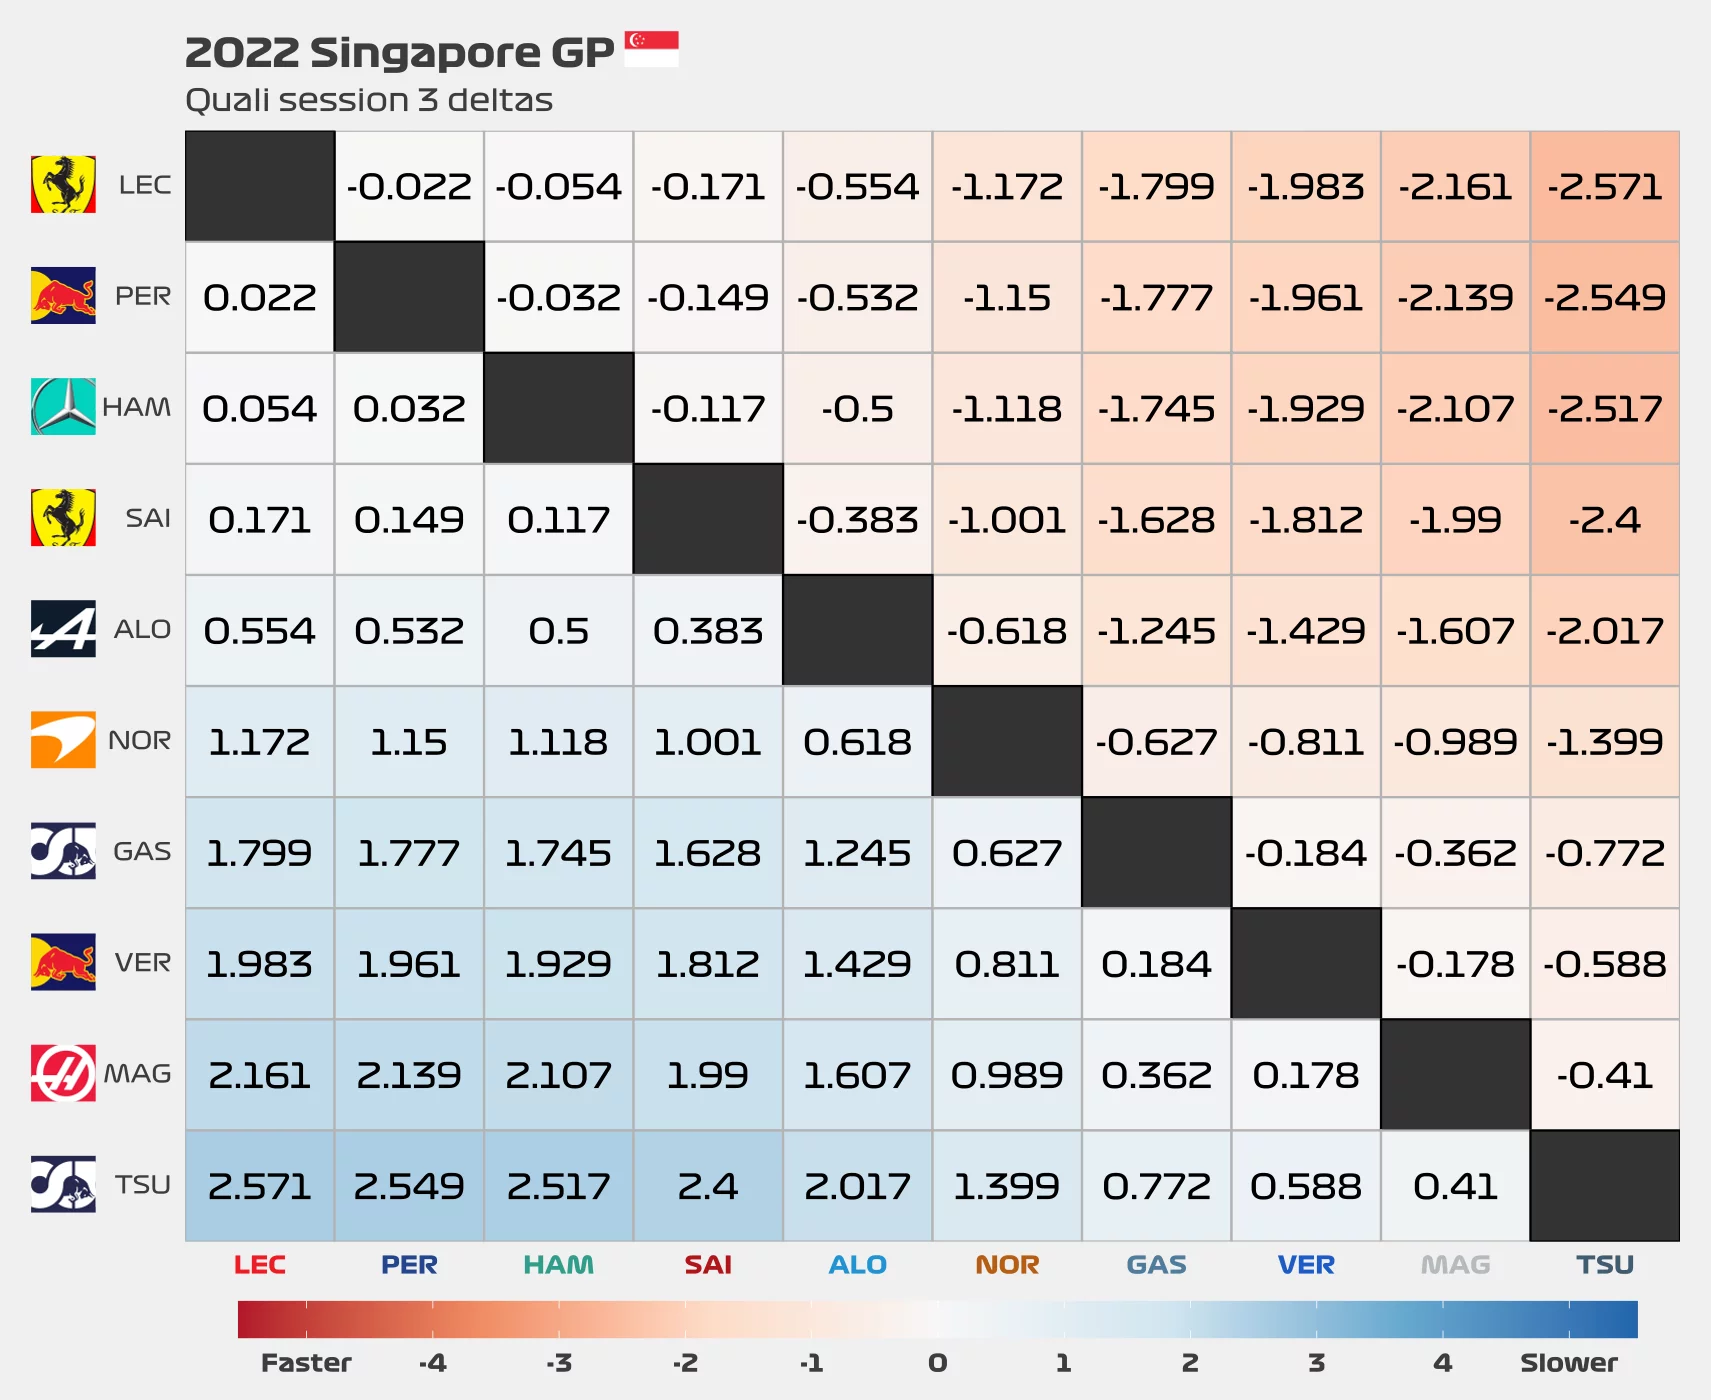
The quali session deltas plot shows all the deltas between the different drivers for all of the 3 quali sessions of the day.
You can read the charts like this:
- Choose a driver from the left side of the plot (y-axis)
- Choose a second driver from the bottom of the plot (x-axis)
- See where they intersect. The number that you see is the delta for their best lap in that quali session.
- Negative numbers mean the driver on the left side was faster than the driver he’s being compared to.
- Positive numbers mean the driver on the left side was slower than the driver he’s being compared to.
- For example: Leclerc on Q3 vs Pérez on Q3. The delta is of -0.282 seconds. This means that Leclerc’s best lap was 0.282 seconds faster than Pérez’s.
Quali best sector times
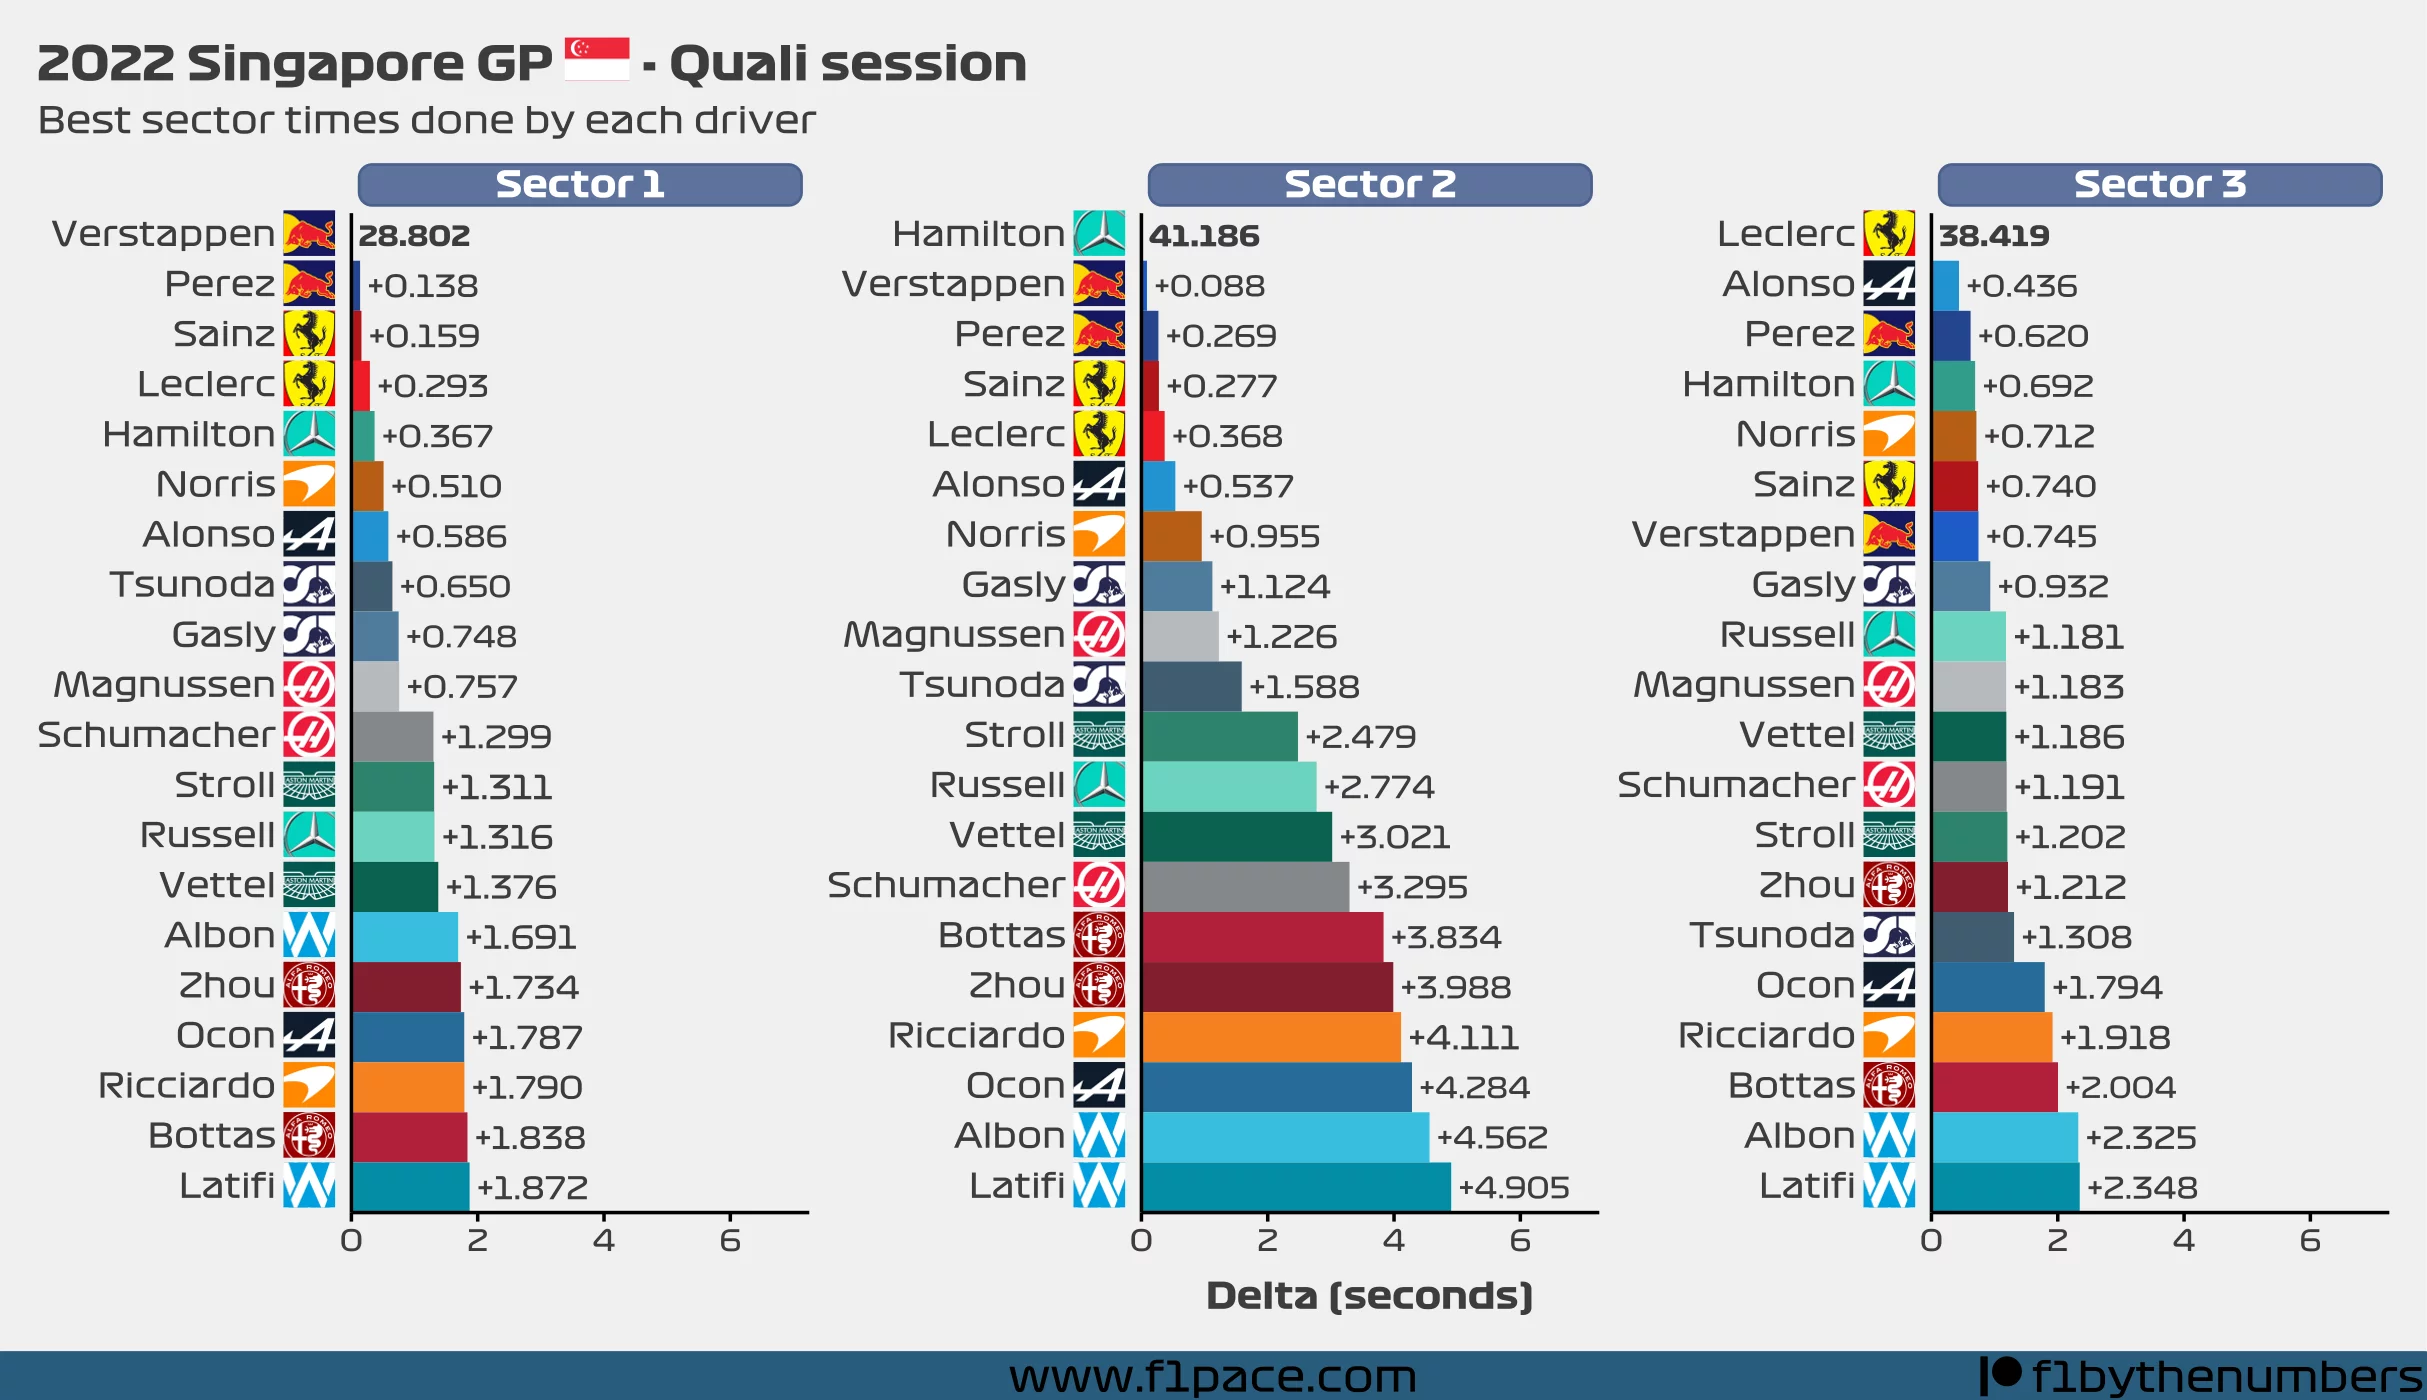
I’ve decided to add some additional information about the FP2 section to this article. The two charts that I’m showing have very similar information about the best sector times of the session. The difference between them is as follows:
- The first chart (Best sector times for each driver) shows the best sector times done by each driver, regardless of the lap those sector times were done. It could’ve been on a random lap and not necessarily on their best flying lap.
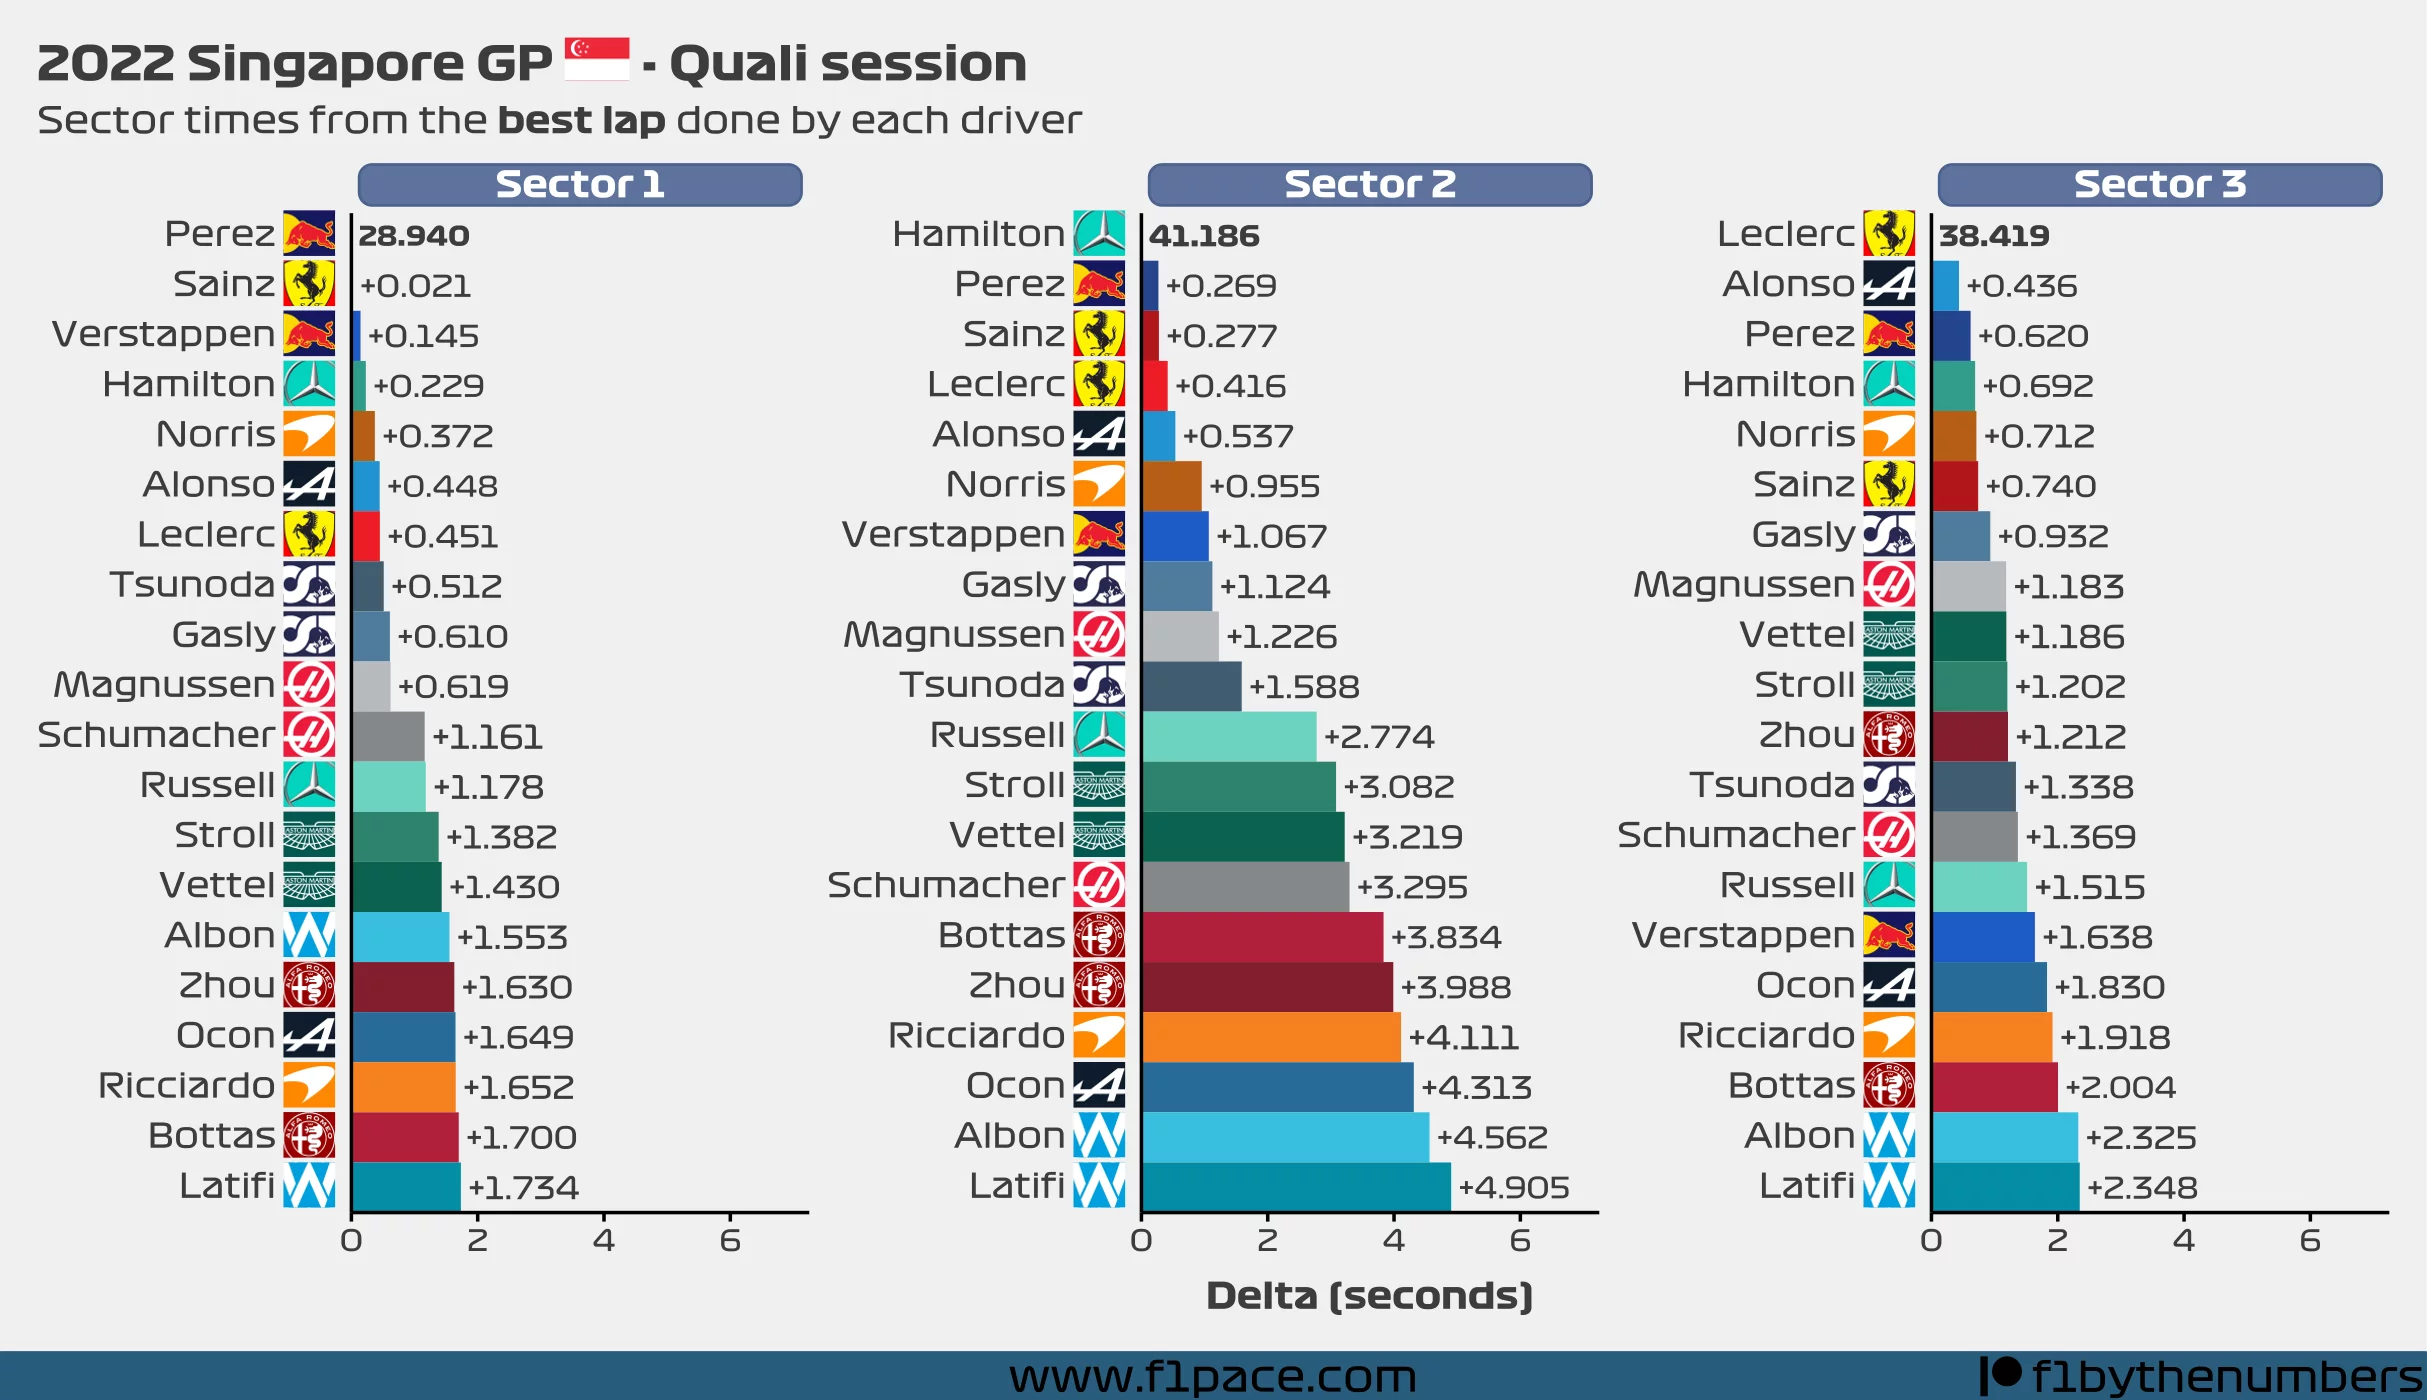
- The second chart (Sector times from the best lap done by each driver) shows the sector times of each driver for their fastest lap of the session.
Usually, you will see that the best sector times were done during their best lap of the session. Having said that, this won’t always be the case. For example, if a driver had 2 great sector times during a flying lap and then made a mistake on the final sector then chances are his best third sector time was done on an entirely different lap.
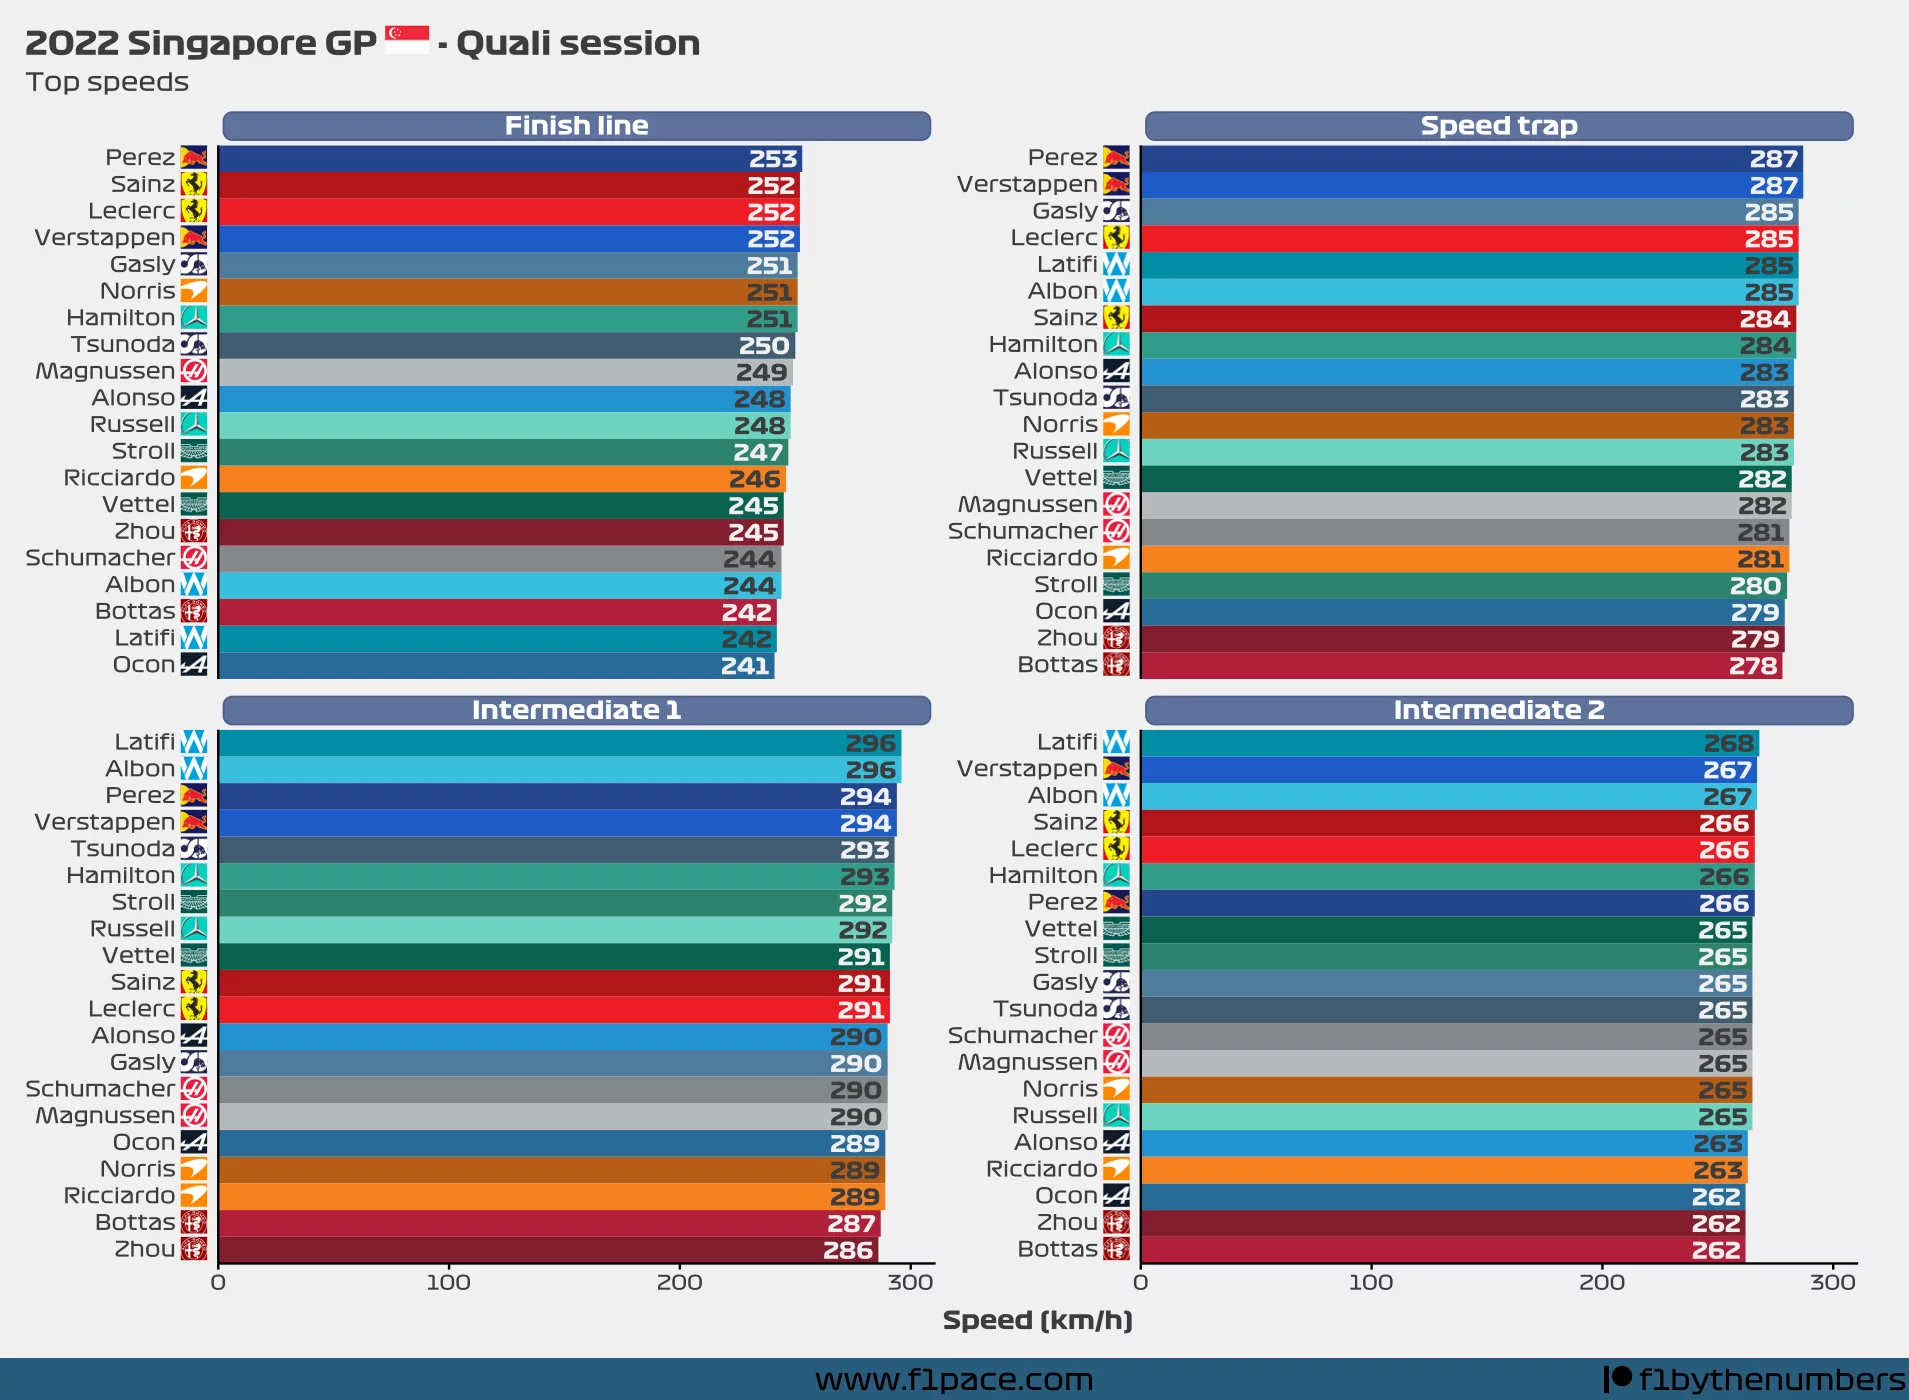
Quali top speeds
I think a lot of people like to see what were the top speeds of the session so I’m adding a chart for those too.
Quali session summary table
Just as before, I am adding a table that contains most of the information about the quali session. For this particular race, the chart may contain some laps that were not really flying laps. I normally filter the laps based on the minimum lap time + a value that I determine to be appropriate. With changing conditions it’s hard to do this so I decided to instead keep more laps instead of deleting valid laps.